Anger is considered as one of the basic human emotions, constituting the affective component of aggression. In the first year of the pandemic, the intense pressure on healthcare workers resulted in the deterioration of their psychosocial problems.
The aim of this study is to investigate the relationship between family support, anger, and aggression.
The present study included physicians and nurses who completed an online survey of Dimensions of Anger Reactions-5 (DAR-5), a Brief Aggression Questionnaire (BAQ) and a Family Support Scale (FSS). Before completing the questionnaires, participants were asked to state their gender, years of work, age, and profession.
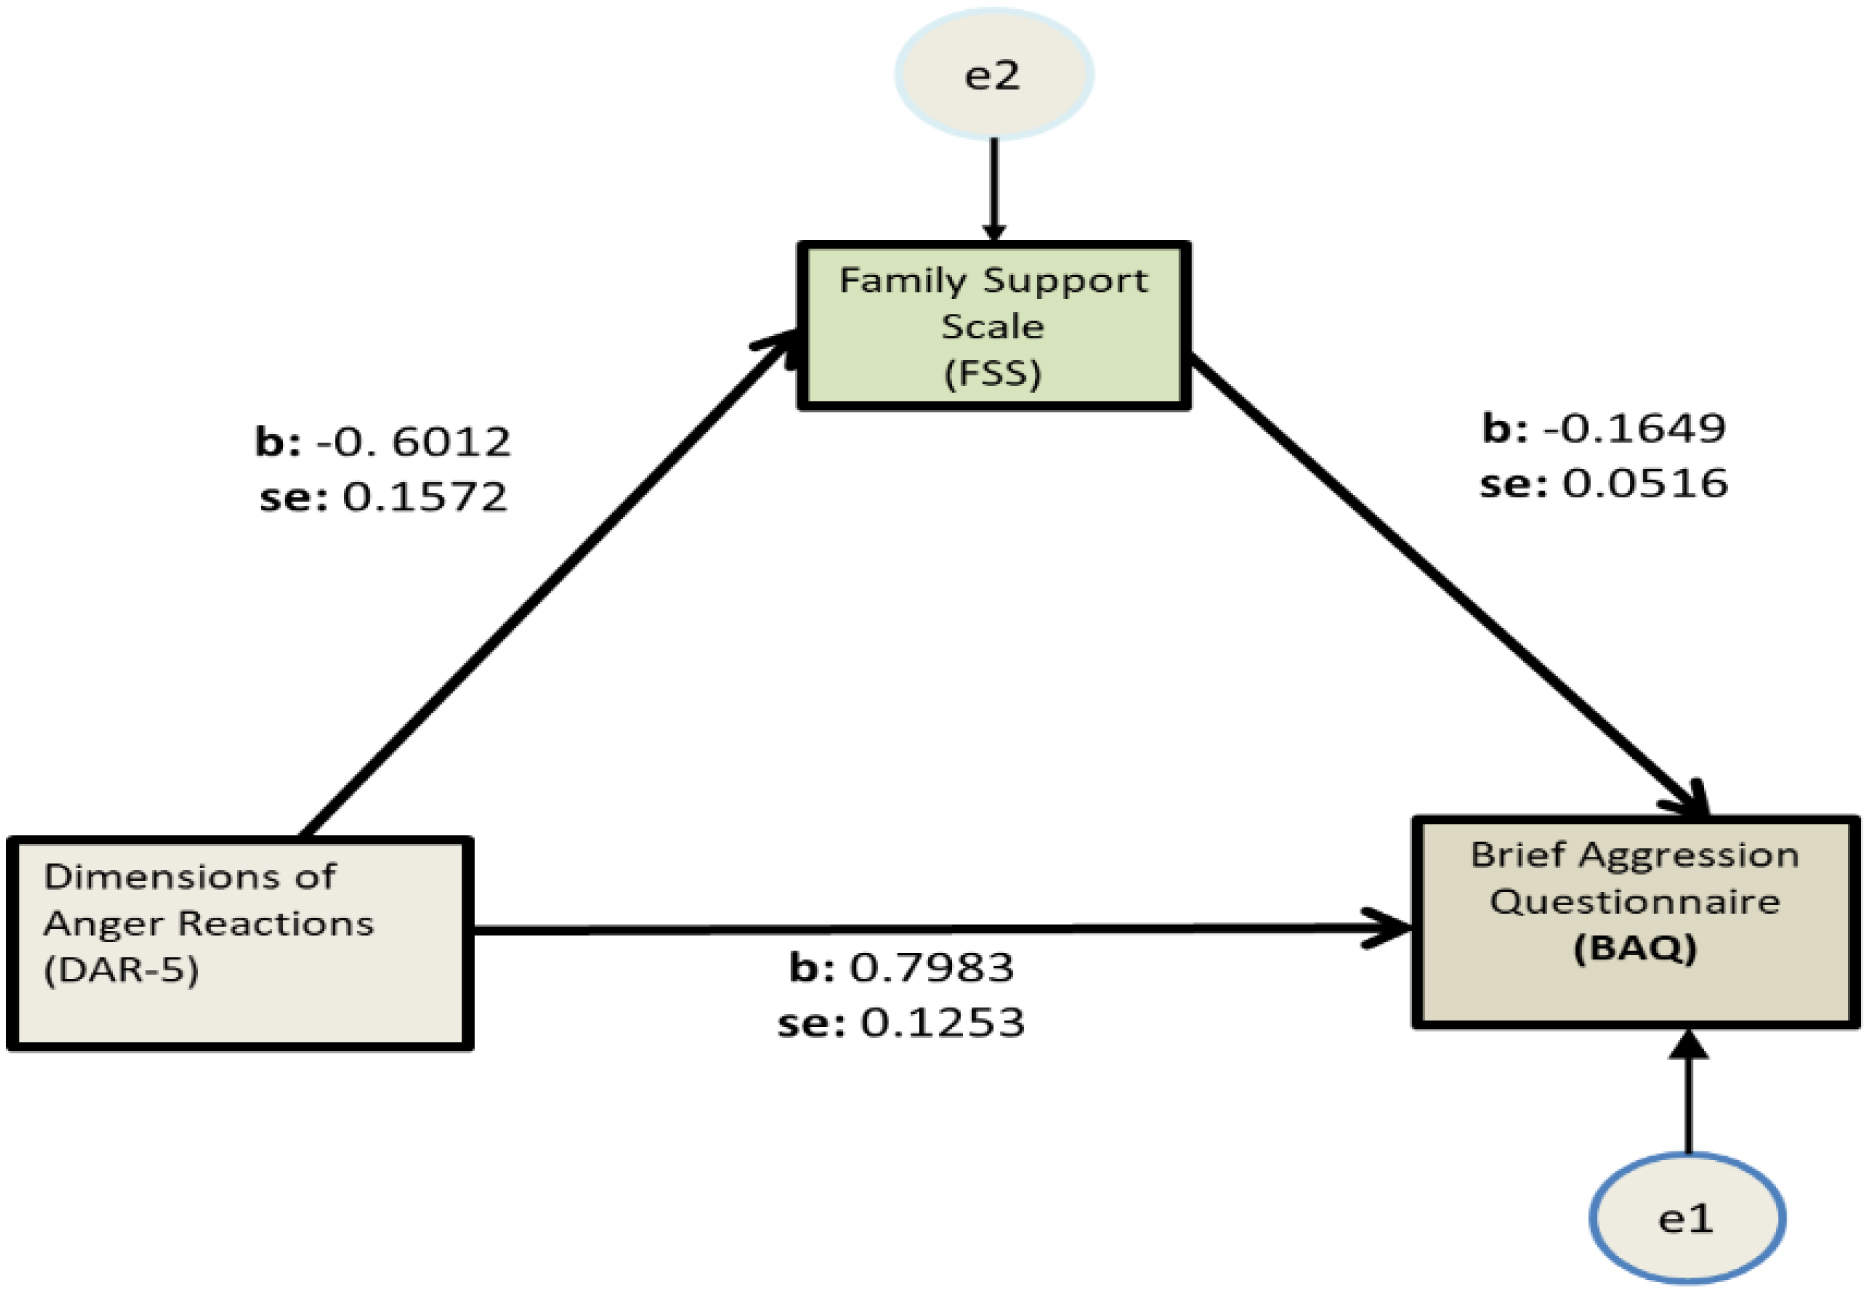
Fifty-three men and 190 women participated in the study. Almost one-third of the participants had a positive score on the DAR-5 scale. Male participants displayed lower DAR-5 scores compared to women. Female participants displayed lower FSS scores compared to men, but higher scores when compared with earlier measures. Regression showed that 15.2% of the variance in BAQ scores can be explained by DAR-5 scores, with an additional 3.8% explained by FSS scores, while an additional 2.3% is explained by years of working experience. Mediation analysis highlighted the role of family support as a negative mediator in the DAR-5 and BAQ relationship.
During the first year of the pandemic, there was an increase in the sense of family support among female health workers. One-third of the participants displayed increased anger scores. Family support acts as a mediator by preventing anger derailing into aggression. In healthcare worker support programs, it seems necessary to entail a specific section on anger management.
Citation: Argyro Pachi, Maria Anagnostopoulou, Athanasios Antoniou, Styliani Maria Papageorgiou, Effrosyni Tsomaka, Christos Sikaras, Ioannis Ilias, Athanasios Tselebis. Family support, anger and aggression in health workers during the first wave of the pandemic[J]. AIMS Public Health, 2023, 10(3): 524-537. doi: 10.3934/publichealth.2023037
Anger is considered as one of the basic human emotions, constituting the affective component of aggression. In the first year of the pandemic, the intense pressure on healthcare workers resulted in the deterioration of their psychosocial problems.
The aim of this study is to investigate the relationship between family support, anger, and aggression.
The present study included physicians and nurses who completed an online survey of Dimensions of Anger Reactions-5 (DAR-5), a Brief Aggression Questionnaire (BAQ) and a Family Support Scale (FSS). Before completing the questionnaires, participants were asked to state their gender, years of work, age, and profession.
Fifty-three men and 190 women participated in the study. Almost one-third of the participants had a positive score on the DAR-5 scale. Male participants displayed lower DAR-5 scores compared to women. Female participants displayed lower FSS scores compared to men, but higher scores when compared with earlier measures. Regression showed that 15.2% of the variance in BAQ scores can be explained by DAR-5 scores, with an additional 3.8% explained by FSS scores, while an additional 2.3% is explained by years of working experience. Mediation analysis highlighted the role of family support as a negative mediator in the DAR-5 and BAQ relationship.
During the first year of the pandemic, there was an increase in the sense of family support among female health workers. One-third of the participants displayed increased anger scores. Family support acts as a mediator by preventing anger derailing into aggression. In healthcare worker support programs, it seems necessary to entail a specific section on anger management.

| [1] |
Tselebis A, Pachi A (2022) Primary Mental Health Care in a New Era. Healthcare 10: 2025. https://doi.org/10.3390/healthcare10102025 
|
| [2] |
Yuan K, Zheng YB, Wang YJ, et al. (2022) A systematic review and meta-analysis on prevalence of and risk factors associated with depression, anxiety and insomnia in infectious diseases, including COVID-19: a call to action. Mol Psychiatry 27: 3214-3222. https://doi:10.1038/s41380-022-01638-z
|
| [3] |
Sikaras C, Zyga S, Tsironi M, et al. (2023) The Mediating Role of Depression and of State Anxiety οn the Relationship between Trait Anxiety and Fatigue in Nurses during the Pandemic Crisis. Healthcare 11: 367. https://doi.org/10.3390/healthcare11030367
|
| [4] |
Pachi A, Sikaras C, Ilias I, et al. (2022) Burnout, Depression and Sense of Coherence in Nurses during the Pandemic Crisis. Healthcare 10: 134. https://doi.org/10.3390/healthcare10010134
|
| [5] |
Williams R (2017) Anger as a basic emotion and its role in personality building and pathological growth: the neuroscientific, developmental and clinical perspectives. Front Psychol 8: 1950. https://doi.org/10.3389/fpsyg.2017.01950
|
| [6] |
Turan N (2021) An investigation of the effects of an anger management psychoeducation programme on psychological resilience and affect of intensive care nurses. Intensive Crit Care Nurs 62: 102915. https://doi.org/10.1016/j.iccn.2020.102915
|
| [7] |
Potegal M, Davidson RJ (2003) Temper tantrums in young children: 2. Tantrum duration and temporal organization. J Dev Behav Pediatr 24: 148-154. https://doi.org/10.1097/00004703-200306000-00003
|
| [8] |
Deffenbacher JL, Oetting ER, Lynch RS, et al. (1996) The expression of anger and its consequences. Behav Res Ther 34: 575-590. https://doi.org/10.1016/0005-7967(96)00018-6
|
| [9] |
Lerner JS, Keltner D (2001) Fear, anger, and risk. J Pers Soc Psychol 81: 146-159. https://doi.org/10.1037/0022-3514.81.1.146
|
| [10] |
Bushman BJ, Baumeister RF, Phillips CM (2011) Do people aggress to improve their mood? Catharsis beliefs, affect regulation opportunity, and aggressive responding. J Pers Soc Psychol 81: 17-32. https://doi.org/10.1037/0022-3514.81.1.17
|
| [11] | Bushman BJ, Huesmann LR (2010) Aggression. Handbook of Social Psychology . Hoboken, NJ: John Wiley & Sons 833-863. https://doi.org/10.1002/9780470561119.socpsy002023 |
| [12] | Allen JJ, Anderson CA (2017) Aggression and violence: Definitions and distinctions. The Wiley handbook of violence and aggression . https://doi.org/10.1002/9781119057574.whbva001 |
| [13] |
Anderson CA, Bushman BJ (2002) Human aggression. Annu Rev Psychol 53: 27-51. https://doi.org/10.1146/annurev.psych.53.100901.135231
|
| [14] |
Hortensius R, Schutter DJ, Harmon-Jones E (2012) When anger leads to aggression: induction of relative left frontal cortical activity with transcranial direct current stimulation increases the anger-aggression relationship. Soc Cogn Affect Neurosci 7: 342-347. https://doi.org/10.1093/scan/nsr012
|
| [15] |
Allen JJ, Anderson CA, Bushman BJ (2018) The General Aggression Model. Curr Opin Psychol 19: 75-80. https://doi.org/10.1016/j.copsyc.2017.03.034
|
| [16] |
DeWall CN, Anderson CA (2011) The general aggression model. Human aggression and violence: Causes, manifestations, and consequences . American Psychological Association 15-33. https://doi.org/10.1037/12346-001
|
| [17] |
Tselebis A, Lekka D, Sikaras C, et al. (2020) Insomnia, Perceived Stress, and Family Support among Nursing Staff during the Pandemic Crisis. Healthcare 8: 434. https://doi:10.3390/healthcare8040434
|
| [18] | Tselebis A, Bratis D, Pachi A, et al. (2013) Chronic obstructive pulmonary disease: sense of coherence and family support versus anxiety and depression. Psychiatriki 24: 109-116. |
| [19] |
Tselebis A, Moulou A, Ilias I, et al. (2006) Depression, family support and alexithymia in patients with bronchial asthma. Ann Gen Psychiatry 5: 1. https://doi.org/10.1186/1744-859X-5-S1-S128
|
| [20] |
Ilias I, Hatzimichelakis E, Souvatzoglou A, et al. (2006) Perception of family support is correlated with glycemic control in Greeks with diabetes mellitus. Psychol Rep 88: 929-930. https://doi:10.2466/pr0.2001.88.3.929
|
| [21] | Lekka D, Pachi A, Tselebis A, et al. (2014) Pain and Anxiety versus Sense of Family Support in Lung Cancer Patients. Pain Res Treat 2014: 312941. https://doi.org/10.1155/2014/312941 |
| [22] |
Faul F, Erdfelder E, Buchner A, et al. (2009) Statistical power analyses using G* Power 3.1: Tests for correlation and regression analyses. Behav Res Methods 41: 1149-1160. https://doi.org/10.3758/BRM.41.4.1149
|
| [23] |
Faul F, Erdfelder E, Lang AG, et al. (2007) G*Power 3: a flexible statistical power analysis program for the social, behavioral, and biomedical sciences. Behav Res Methods 39: 175-191. https://doi:10.3758/bf03193146
|
| [24] |
Thoemmes F, Mackinnon DP, Reiser MR (2010) Power analysis for complex mediational designs using Monte Carlo methods. Struct Equ Modeling 17: 510-534. https://doi:10.1080/10705511.2010.489379
|
| [25] |
Muthén LK, Muthén BO (2002) How to use a Monte Carlo study to decide on sample size and determine power. Struct Equ Modeling 9: 599-620. https://doi.org/10.1207/S15328007SEM0904_8
|
| [26] |
Forbes D, Alkemade N, Mitchell D, et al. (2014) Utility of the Dimensions of Anger Reactions-5 (DAR-5) scale as a brief anger measure. Depress Anxiety 31: 166-173. https://doi:10.1002/da.22148
|
| [27] |
Forbes D, Alkemade N, Hopcraft D, et al. (2014) Evaluation of the Dimensions of Anger Reactions-5 (DAR-5) Scale in combat veterans with posttraumatic stress disorder. J Anxiety Disord 28: 830-835. https://doi.org/10.1016/j.janxdis.2014.09.015
|
| [28] |
Webster GD, DeWall CN, Pond RS, et al. (2014) The brief aggression questionnaire: Psychometric and behavioral evidence for an efficient measure of trait aggression. Aggress Behav 40: 120-139. https://doi.org/10.1002/ab.21507
|
| [29] |
Webster GD, DeWall CN, Pond RS, et al. (2015) The Brief Aggression Questionnaire: Structure, Validity, Reliability, and Generalizability. J Pers Assess 97: 638-649. https://doi.org/10.1080/00223891.2015.1044093
|
| [30] |
Pachi A, Tselebis A, Ilias I, et al. (2022) Aggression, Alexithymia and Sense of Coherence in a Sample of Schizophrenic Outpatients. Healthcare 10: 1078. https://doi.org/10.3390/healthcare10061078
|
| [31] |
Tselebis A, Anagnostopoulou T, Bratis D, et al. (2011) The 13 item Family Support Scale: Reliability and validity of the Greek translation in a sample of Greek health care professionals. Asia Pac Fam Med 10: 3. https://doi.org/10.1186/1447-056X-10-3
|
| [32] | Hayes AF PROCESS: A versatile computational tool for observed variable mediation, moderation, and conditional process modeling (2012). Available from: http://www.afhayes.com/public/process2012.pdf. |
| [33] |
Hayes AF (2015) An Index and Test of Linear Moderated Mediation. Multivariate Behav Res 50: 1-22. https://doi.org/10.1080/00273171.2014.962683
|
| [34] |
Plant EA, Hyde JS, Keltner D, et al. (2000) The gender stereotyping of emotions. Psychol Women 24: 81-92. https://doi.org/10.1111/j.1471-6402.2000.tb01024.x
|
| [35] |
Marshburn CK, Cochran KJ, Flynn E, et al. (2020) Workplace Anger Costs Women Irrespective of Race. Front Psychol 11: 579884. https://doi.org/10.3389/fpsyg.2020.579884
|
| [36] |
Brescoll VL, Uhlmann EL (2008) Can an angry woman get ahead? Status conferral, gender, and expression of emotion in the workplace. Psychol Sci 19: 268-275. https://doi.org/10.1111/j.1467-9280.2008.02079.x
|
| [37] |
Sikaras C, Ilias I, Tselebis A, et al. (2021) Nursing staff fatigue and burnout during the COVID-19 pandemic in Greece. AIMS Public Health 9: 94-105. https://doi.org/10.3934/publichealth.2022008
|
| [38] |
Smith LE, Duffy B, Moxham-Hall V, et al. (2021) Anger and confrontation during the COVID-19 pandemic: a national cross-sectional survey in the UK. J R Soc Med 114: 77-90. https://doi.org/10.1177/0141076820962068
|
| [39] |
Brooks SK, Webster RK, Smith LE, et al. (2020) The psychological impact of quarantine and how to reduce it: rapid review of the evidence. Lancet 395: 912-920. https://doi.org/10.1016/S0140-6736(20)30460-8
|
| [40] |
Forrest CB, Xu H, Thomas LE, et al. (2021) Impact of the early phase of the COVID-19 pandemic on US healthcare workers: results from the HERO registry. J Gen Intern Med 36: 1319-1326. https://doi.org/10.1007/s11606-020-06529-z
|
| [41] |
Marton G, Vergani L, Mazzocco K, et al. (2020) 2020s Heroes Are Not Fearless: The Impact of the COVID-19 Pandemic on Wellbeing and Emotions of Italian Health Care Workers During Italy Phase 1. Front Psychol 11: 588762. https://doi.org/10.3389/fpsyg.2020.588762
|
| [42] |
Bayrak NG, Uzun S, Kulakaç N (2021) The relationship between anxiety levels and anger expression styles of nurses during COVID-19 pandemic. Perspect Psychiatr Care 57: 1829-1837. https://doi.org/10.1111/ppc.12756
|
| [43] |
Tselebis A, Gournas G, Tzitzanidou G, et al. (2006) Anxiety and Depression in Greek Nursing and Medical Personnel. Psychol Rep 99: 93-96. https://doi.org/10.2466/pr0.99.1.93-96
|
| [44] | Melemeni D, Mantzouranis K, Georgakopoulou VE, et al. (2021) Depression, Anxiety and Quality of Life in Staff of a Hospital in Athens: A Study in the Aftermath of the Debt Crisis Era. Acta Med Litu 28: 230-239. https://doi.org/10.15388/Amed.2021.28.2.3 |
| [45] |
Cox CL (2020) ‘Healthcare Heroes’: problems with media focus on heroism from healthcare workers during the COVID-19 pandemic. J Med Ethics Aug 46: 510-513. https://doi.org/10.1136/medethics-2020-106398
|
| [46] |
Hopkins PD (2021) Viral Heroism: What the Rhetoric of Heroes in the COVID-19 Pandemic Tells Us About Medicine and Professional Identity. HEC Forum 33: 109-124. https://doi.org/10.1007/s10730-020-09434-4
|
| [47] |
Averill JR (1983) Studies on anger and aggression. Implications for theories of emotion. Am Psychol 38: 1145-1160. https://doi.org/10.1037//0003-066X.38.11.1145
|
| [48] |
Hortensius R, Schutter DJ, Harmon-Jones E (2012) When anger leads to aggression: induction of relative left frontal cortical activity with transcranial direct current stimulation increases the anger-aggression relationship. Soc Cogn Affect Neurosci 7: 342-347. https://doi.org/10.1093/scan/nsr012
|
| [49] |
Hareli S, Kafetsios K, Hess U (2015) A cross-cultural study on emotion expression and the learning of social norms. Front Psychol 6: 1501. https://doi.org/10.3389/fpsyg.2015.01501
|
| [50] |
Park J, Kitayama S, Markus HR, et al. (2013) Social status and anger expression: the cultural moderation hypothesis. Emotion 13: 1122. https://doi.org/10.1037/a0034273
|
| [51] | Sotile WM, Sotile MO (1996) The angry physician-Part 1. The temper-tantruming physician. Physician Exec 22: 30-34. |
| [52] |
Imo U (2017) Burnout and psychiatric morbidity among doctors in the UK: A systematic literature review of prevalence and associated factors. BJPsych Bull 41: 197-204. https://doi.org/10.1192/pb.bp.116.054247
|
| [53] |
Costa DK, Moss M (2018) The cost of caring: emotion, burnout, and psychological distress in critical care clinicians. Ann Am Thorac Soc 15: 787-790. https://doi.org/10.1513/AnnalsATS.201804-269PS
|
| [54] |
Bradbury-Jones C, Isham L (2020) The pandemic paradox: The consequences of COVID-19 on domestic violence. J Clin Nurs 29: 2047-2049. https://doi.org/10.1111/jocn.15296
|
| [55] |
Gulati G, Kelly BD (2020) Domestic violence against women and the COVID-19 pandemic: What is the role of psychiatry?. Int J Law Psychiatry 71: 101594. https://doi.org/10.1016/j.ijlp.2020.101594
|
| [56] |
Piquero AR, Jennings WG, Jemison E, et al. (2021) Domestic violence during the COVID-19 pandemic - Evidence from a systematic review and meta-analysis. J Crim Justice 74: 101806. https://doi.org/10.1016/j.jcrimjus.2021.101806
|
| [57] | Storer HL, Mitchell B, Willey-Sthapit C (2023) “Safety Is Elusive:” A Critical Discourses Analysis of Newspapers' Reporting of Domestic Violence During the Coronavirus Pandemic. Violence Against Wom : 10778012221150277. https://doi.org/10.1177/10778012221150277 |
| [58] |
Chida Y, Steptoe A (2009) The association of anger and hostility with future coronary heart disease: a meta-analytic review of prospective evidence. J Am Coll Cardiol 53: 936-946. https://doi.org/10.1016/j.jacc.2008.11.044
|
| [59] |
Smith TW, Glazer K, Ruiz JM, et al. (2004) Hostility, anger, aggressiveness, and coronary heart disease: An interpersonal perspective on personality, emotion, and health. J Pers 72: 1217-1270. https://doi.org/10.1111/j.1467-6494.2004.00296.x
|
| [60] |
Ekaterina Mosolova, Dmitry Sosin, Mosolo Sergey (2021) Stress, anxiety, depression and burnout in frontline healthcare workers during two peaks of COVID-19 pandemic in Russia. Psychiatry Res 306: 114226. https://doi.org/10.1016/j.psychres.2021.114226
|
| [61] |
Chung S, Kim HJ, Ahn MH, et al. (2021) Development of the stress and anxiety to viral epidemics-9 (SAVE-9) scale for assessing work-related stress and anxiety in healthcare workers in response to viral epidemics. J Korean Med Sci 36: e319. https://doi.org/10.3346/jkms.2021.36.e319
|
Figures(1) / Tables(5)

Argyro Pachi, Maria Anagnostopoulou, Athanasios Antoniou, Styliani Maria Papageorgiou, Effrosyni Tsomaka, Christos Sikaras, Ioannis Ilias, Athanasios Tselebis. Family support, anger and aggression in health workers during the first wave of the pandemic[J]. AIMS Public Health, 2023, 10(3): 524-537. doi: 10.3934/publichealth.2023037


 DownLoad: