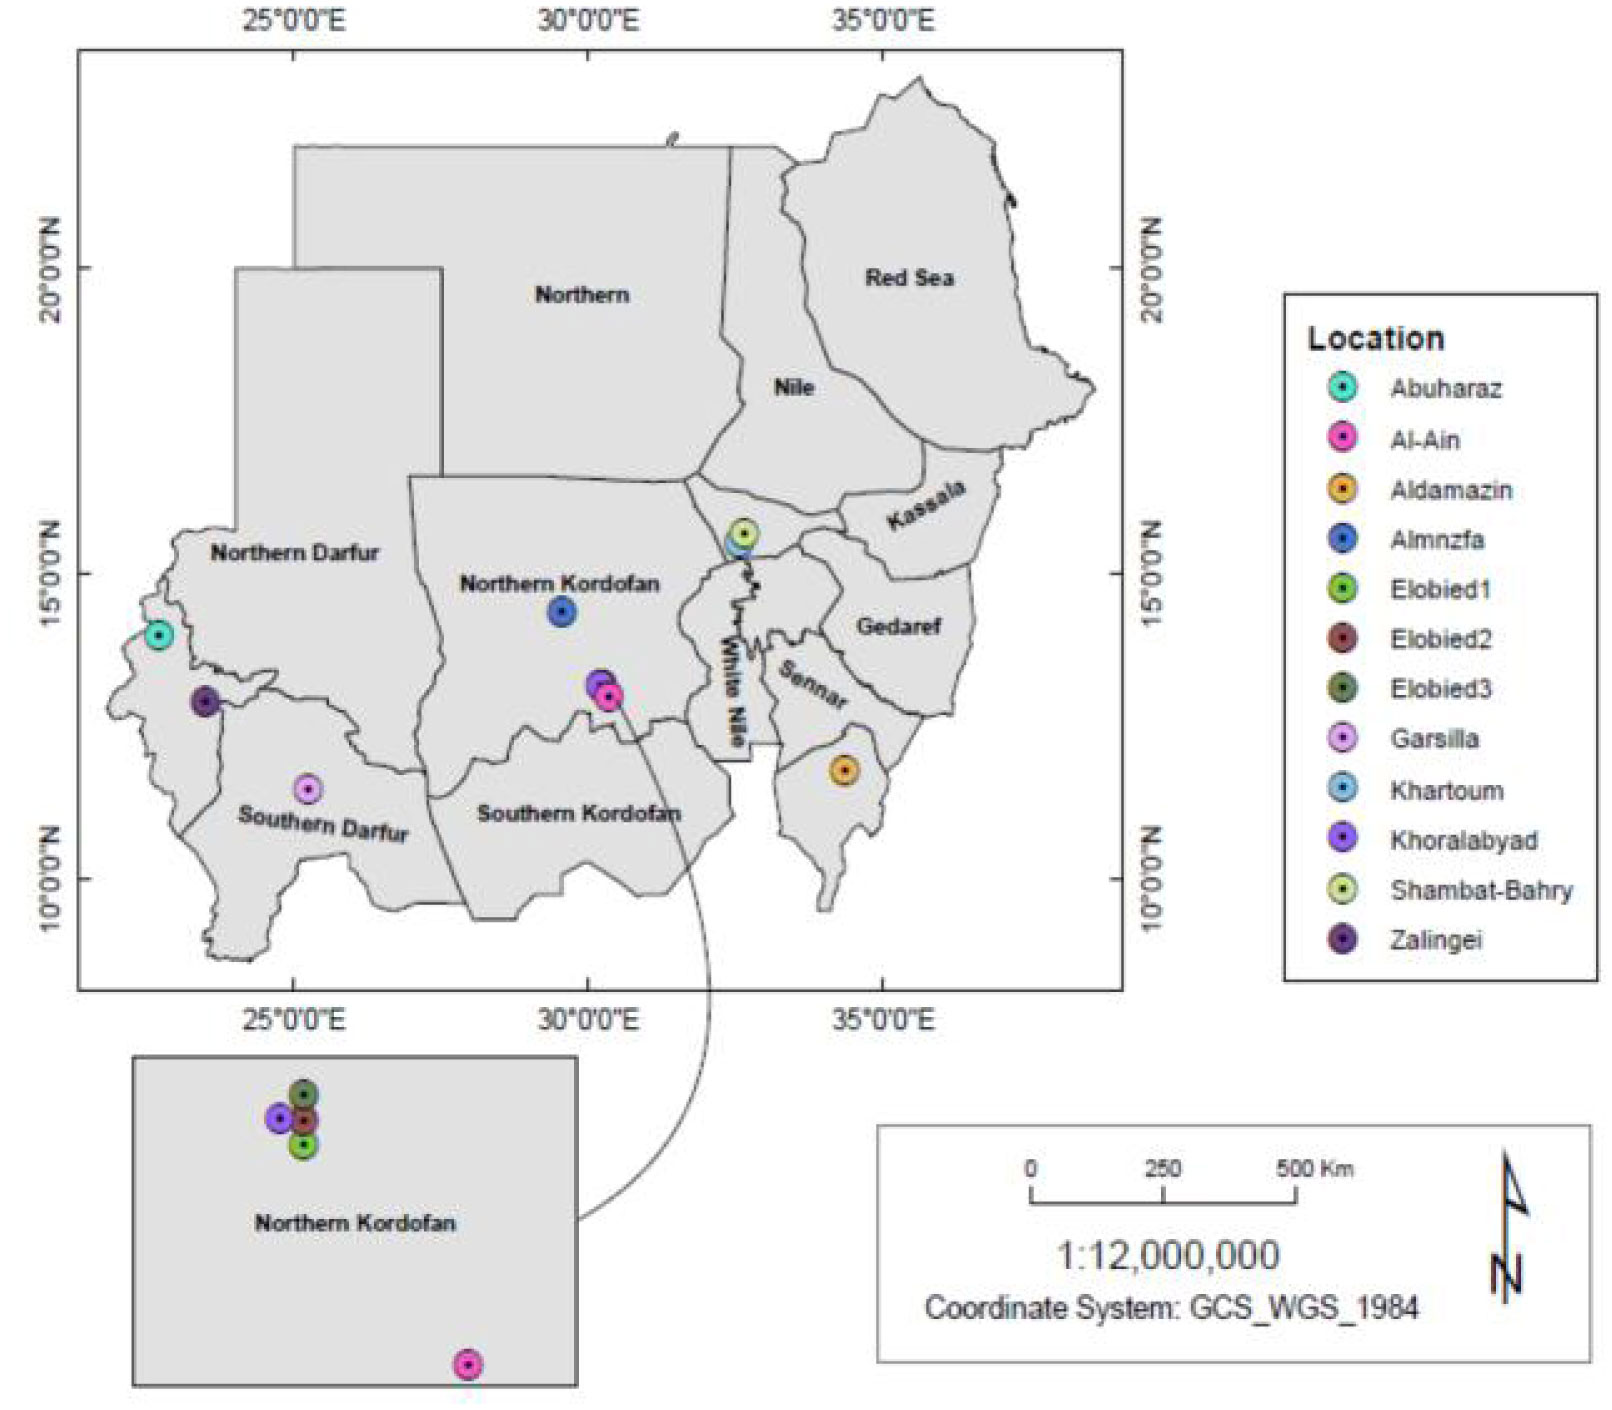
1.
Introduction
Grewia tenax (L.) belongs to the Malvaceae family, is a multi-stemmed fruit shrub with manifold uses throughout the tropics and subtropics [1]. For decades it has been used for the preparation of traditional medicines. Grewia tenax is considered as a typical tropical plant specie which can tolerate seasonal drought and withstand temperatures of more than 50°C [2]. Moreover, G. tenax is also known as dune fixing species because of its dense fast growing root system [3]. It is a deciduous fruit-producing shrub or small tree that may reach a height of 1 to 3 m.
As result of the overexploitation and lack of regeneration, G. tenax wild stands became increasingly threatened, hence the fruit sources and natural gene pool were exhausted [2]. G. tenax grows as a wild plant at low elevations throughout the western Sahelian zone (Mali, Mauritania, Niger, Nigeria and Senegal), the eastern Sahelian zone (Djibouti, Eritrea, Ethiopia, Kenya, Somalia and Sudan), northern Africa (Algeria and Morocco) as well southern Africa (Botswana, Namibia, Transvaal and South Africa). It is also found in the Arabian Peninsula and from Iran to India [1]. In Sudan and South of Sudan, G. tenax is found in Bahr El Gazal, Blue Nile, Darfur, Equatoria, Kassala, Khartoum, Kordofan, Upper Nile and White Nile province [4].
The genus Grewia is composed of about 150 Species [5], its fruits and other parts contribute significantly to the food and energy needs of rural populations in multiple ways [6]. Its leaves and branches are eatable for livestock. Due to their high nutritive values, the fruits have a number of uses like the main source of food during starvation [7].
The fruit, known locally in Sudan as “Gudaim,” is a rich source of carbohydrates, protein, and vitamins. minerals and constitutes important contributors to improving the nutritional contents of diet of rural and urban people in Sudan [6]. Rural populations consider G. tenax as a source of income by sale of the fruits and other products [2].
G. tenax fruits were thought for a long time as a simple, naturally available food and medication against iron-deficiency anemia and fatigue [3],[8],[9]. Anemia, which is one of the top ten death-causing disorders in developing countries, not related only to malnutrition and poverty, but also to the free radicals activities [10],[11]. Grewia tenax extracts were reported to have effects on the regulation of iron digestive transfer and absorption [9].
Biochemical markers (isozymes/allozymes), direct DNA sequencing, and molecular (DNA) markers can be used to investigate genetic variation within and among populations [12]. Until recently, research on the genetics of tropical trees was restricted mainly to allozyme studies of the genetic structure of trees in continuous forests [13],[14]. The first DNA marker exploited is referred to as Restriction Fragment Length polymorphism (RFLPs) [15]. The recent molecular techniques such as Random Amplified polymorphic DNA (RAPD) [16], Inter Simple Sequence Repeat polymorphism [17], Microsatellites (also known as Simple Sequence Repeat, SSRs [18], Amplified Fragment Length polymorphism [19] as well as Inverse Sequence-Tagged Repeat [20] which involve the Polymerase Chain Reaction (PCR), in which amplification of genomic DNA fragments is conducted using a heat-resistant DNA polymerase (Taq polymerase), primers and deoxyribonucleotide triphosphates at high temperatures [21].The use of molecular markers in the investigation of genetic variation is getting a wide acceptance and broad application in fields such as phylogeny, taxonomy, ecology, genetics and breeding [12].
The general objectives of the study is to determine the genetic variation in populations of Grewia tenax found at different altitudes and geographical locations ranging from scattered to continuous populations over a wide geographical distance of Sudan, by employing DNA marker systems. The general objective of the study is to determine the genetic variation in populations of Grewia tenax found at different altitudes and geographical locations ranging from scattered to continuous populations over a wide geographical distance of Sudan, by employing DNA marker systems techniques.
2.
Materials and methods
Collection Sites and laboratory: leaves were collected from 12 populations, with each population represented by 12 natural population samples thought to constitute the geographical range of Grewia tenax. Samples were carried to the laboratory in brown paper bags and kept in Refrigerator (5°C) for future DNA extraction. Use of plastic bags was avoided as it led to degradation of leaf samples. The Selection parameters for leaves collection was based on detail of samples and other detail are mentioned. The location and details of leaves are showed in Table 1 and Figure 1. All samples were collected from natural, healthy and productive Grewia tenax trees. Total genomic DNA was isolated using the Dellaporta method [22] (with slight modification made in buffer concentrations).
2.1. DNA extraction
Sample preparation: fresh young and healthy leaves were collected from plant samples (0.5 g) and kept in aluminum foil under cool conditions till use. Samples were placed into mortar grinders and covered with dry ice powder until it thawed followed by grinding to fine powder with vigorous pulverizing at intervals of 20 to 30 seconds. Ground green dry powders were immediately used for DNA isolation.
2.2. Solutions for DNA extraction and purification
– Ten percent (w/v) CTAB (Cetyltrimethylammonium bromide).
– 10g of CTAB was dissolved in 70ml of distel water and then final volume was made to 100 ml.
– 0.5M EDTA (pH 8.0) - 93.05 g of Ethylene Diamine Tetra Acetate was added to 400 ml of water. The pH of solution was adjusted to 8.0 by addition of NaOH (Sodium Hydroxide). The final volume was made to 500 ml and sterilized by autoclaving.
– 5M NaCl- 146.1 g of sodium chloride was dissolved in 400 ml of water and the final volume was made to 500 ml and sterilized by autoclave.
– Phenol: Chloroform: Isoamyl alcohol (25:24:1) – 750 µl phenol, 720 µl Chloroform and 30 µl Isoamyl alcohol were mixed by vortexing.
– 1M Tris- 60.58 g Tris base was dissolved in 400 ml of water and the pH was adjusted to 8.0. The final volume was made to 500 ml and sterilized by autoclaving.
– Chloroform: Isoamyl (24:1).
- 720 µl Chloroform and 30 µl Isoamyl alcohol were mixed by vortexing.
– DNA extraction buffer contained 100 mM Tris-HCl, 20 mM, EDTA (pH-8.0), 1.4 M NaCl, 2.0 (w/v) SDS, 0.2 per cent (v/v) 2-Mercaptoethanol.
–TE buffer – 10mM Tris, 1mM EDTA, and (pH 8) and stored at 4°C for further use.
2.3. DNA extraction and purification
DNA isolation was based on phenol: chloroform: isoamyl alchohol (24:25:1) protocol as described by [22]. The modification was made on step of isoamyl alcohol: chloroform with the intention to improve the quantity and the quality of the DNA. In this method the fine powder plant materials (0.5g) were immediately transferred into 15 ml Falcon tubes containing 6 ml of pre-warmed lysis solution. Tubes containing the samples were then incubated in water path at 65 °C with gentle shaking for 30 min and left to cool at room temperature for 5 min. 3ml of phenol: chloroform: (25:24) added to each tube and the phases were mixed gently for 5 min at room temperature to make homogeneous mixture. Centrifugation at 5000 rpm for 15 min was done to remove the cell debris, the resulted aqueous phases (containing DNA) were transferred to new sterile tubes. The transferred aqueous phase was mixed thoroughly with equal volume of chloroform: isoamyl alchohol (24:1) followed by centrifugation at 5000 rpm for 5min. The step of the chloroform: isoamyl alchohol extraction was repeated twice and the final supernatants were transferred to sterile 1.5 ml Eppendorf tubes (400µl/ tube). The nucleic acids in the aqueous phase precipitated by adding equal volume of cooled absolute ethanol. The contents of the Eppendorf tubes were mixed gently for 5 min by inversion manually and collected by cooled centrifugation (5°C) at 8000 rpm for 3 min. The formed DNA pellet was washed twice with 70% ethanol, and the ethanol was discarded after spinning with flash centrifugation. The remained ethanol was evaporated after leaving the pellet to dry at room temperature. The pellet was dissolved in TE buffer. The extracted DNA samples were observed under UV illumination after staining with (Ez- Vision (cat number 10450003-1), which was used instead of Ethidium Bromide.
2.4. DNA Quantification
According to [23], the purity and the concentration of the DNA were assessed. The DNA isolated was quantified by using Lambda UV-vis spectrophotometer. First the absorbance was set to zero by using 50 µl of Tris EDTA buffer in the cuvette. The cuvette was properly washed with distilled water, 2 µl of the isolated DNA added to 48 µl of TE buffer, the ratio at 260/280 nm was recorded following the amount of DNA in terms of ng/µl. This quantification of isolated DNA provided with concentration of DNA present in a particular sample and also the 260/280 nm ratio was estimated to find out purity of DNA. This ratio is 1.8 for pure double stranded DNA. If the ratio is greater than 1.8 this suggests RNA contamination, where as one less than 1.8 suggests protein in the sample. The quantified samples were brought to the final working concentration of DNA to 5ng/µl, which will then be used for the RAPD and ISSR analysis.
2.4.1. RAPD analysis
2.4.2. Primers
For standardization of the amplification conditions a total of twenty decamer oligonucleotide primers were used for amplification of the extracted cellular DNAs. Primers were selected according to the reproducibility of their amplification product. Primers used in this study were OPA-17, OPA-09, OPA-02, OPC-15, OPD-01, OPD-03, OPG-10, OPN-15, OPS-03, OPS-06, OPC-04, OPC-11, OPC-13, PF-08, OPF-12, OPF-13, OPA-04, OPA-05, OPO-20, and OPF-15. They were obtained from Operon Technologies Inc., USA (Table 2).
2.4.3. Standardization of concentration of DNA for RAPD
For standardizing the concentration of template DNA, PCR amplification was performed with different DNA concentrations using previously standardized master-mix concentrations. Five different concentrations of DNA were used which were 5 ng, 10 ng, 15 ng, 20 ng and 25 ng, for obtaining the maximum number of amplification products. The maximum number of amplification products was observed at 20 ng of template DNA.
2.4.4. Standardization of PCR amplification conditions
Tests were performed for standardizing polymerase chain reaction amplification conditions mainly the annealing temperature. PCR amplification conducted at different annealing temperatures i.e. 36°C, 37°C, 38°C using standard concentrations of various components of reaction mixture. The maximum number of amplification products was observed at 20 ng of template DNA.
2.4.5. Polymerase chain reaction mixture
The PCR reaction mixtures were prepared according to [24], in 25µl volumes containing 2.5 µl of buffer (B), 3µl MgCl2 (25mM), 0.25µl dNTP's (200 µM), 2µl random primer (10 pmol/µl), 0.5µl Taq polymerase 5U/µl and 1µl of extracted DNA ( 20 ng). The mixture was completed to 25 µl by addition of sterilized distilled water. The reagents were mixed thoroughly in 2ml microcentrifuge tube and vortexed for 5 seconds. 24 µl of mixture was distributed to each PCR tube and 1 µl of template DNA (20 ng/µl) was added to each tube for each amplification reaction in thermal cycler (Real- time PCR, Bio- Rad CFX96) [25].
2.4.6. DNA amplification
PCR conditions used for RAPD amplification included initial denaturation for 3 min at 94°C followed by 45 cycles of amplification (denaturation at 92°C for 45 seconds, annealing of primer at 36°C for 1min and primer amplification at 72 °C for 2 min) and final extension at 72 °C for 10 min. the PCR machine was adjusted to hold the product at 4 °C.
2.4.7. Electrophoresis using agarose gel
Amplification products were separated on 2 per cent agarose gel using 1X TBE buffer (Tris HCI pH 8.0, Boric Acid, Ethylene diamine tetra- Acetic). Horizontal gel electrophoresis apparatus (Consort-UK) [26]. Ez-vision dye was used as intercalating agent. 5 µl of RAPD amplification products were mixed with 1 µl of Ez-vision dye and loaded on to the gel. Gel was run according to 5v/cm of the length of gel till the bands separate. 1 Kb DNA ladder (250 - 1000bp, cat number: DM010-R500) was used as standard in the first well of the gel.
2.5. ISSR analysis
DNA amplification was carried out for ISSR analysis. A total of ten ISSR primers synthesized by Operon Technologies Inc., USA. Primers used in this study were 864, 835, 825, 812, 811, 810, 809, UBC-841, UBC-827, and UBC-807 (Table 3).
2.5.1. Electrophoresis using agarose gel
Amplification products were separated on 2 per cent agarose gel using 1X TBE buffer (Tris HCI pH 8.0, Boric Acid, Ethylene diamine tetra- Acetic). Horizontal gel electrophoresis apparatus (Consort-UK) [26]. Ez-vision dye was used as intercalating agent. 5 µl of RAPD amplification products were mixed with 1 µl of Ez-vision dye and loaded on to the gel. Gel was run according to 5v/cm of the length of gel till the bands separate. 1 Kb DNA ladder (250 - 1000bp, cat number: DM010-R500) was used as standard in the first well of the gel.
2.5.2. ISSR analysis
DNA amplification was carried out for ISSR analysis. A total of ten ISSR primers synthesized by Operon Technologies Inc., USA. Primers used in this study were 864, 835, 825, 812, 811, 810, 809, UBC-841, UBC-827, and UBC-807 (Table 3).
2.5.3. Polymerase chain reaction (PCR) mixture
The PCR reaction mixtures were prepared in 25µl volumes containing 2.5µl of buffer (B), 4µl MgCl2 (25mM), 0.25µl dNTP's (200µM), 2µl random primer (10 pmol/µl), 0.5µl Taq polymerase 5U/µl and 1µl of extracted DNA ( 20 ng) the mixture was made up to 25 µl by addition of sterilized distilled water. The reagents were mixed thoroughly in 2ml microcentrifuge tube and vortexed for seconds. 23 µl of mixture was distributed to each PCR tube and 2 µl of template DNA (20 ng/µl) was added to each tube for each amplification reaction in thermal cycler (Real- time PCR, Bio- Rad CFX96)[25].
2.5.4. DNA amplification
PCR conditions used for ISSR amplification included initial denaturation for 3 min at 94 °C followed by 45 cycles of amplification (denaturation at 92 °C for 45 seconds, annealing of primer at 36 °C for 1 min and primer amplification at 72 °C for 2 min) and final extension at 72 °C for 10 min. the PCR machine was adjusted to hold the product at 4 °C.
2.6. Data analysis
2.6.1. Viewing of amplified DNA
After the run was over, the gel was viewed under the UV light using Gel Documentation system and was photographed.
2.6.2. Scoring of bands
The amplified bands after separation were visualized using Gel Documentation System. For each primer, the number of polymorphic and monomorphic bands was determined. Band clearly visible in at least one genotype were scored (1) for present, 0 for absent and entered into data matrix. Fragment size was estimated by interpolation from the migration distance of marker fragments. Percentage of polymorphism was calculated as the proportion of polymorphic bands over the total number of bands. The genetic dissimilarity (D) matrix among genotypes was estimated according to [27]. Coefficient of similarity trees were produced by clustering the similarity data with the unweighted pair group method using STATISTCA and GenALEx 6.5 software. The similarity coefficient was used to construct a dendrogram by the unweighted pair group method with arithmetic averages (UPGMA) according to [28].
Principal coordinates analysis (PCoA) was performed with the GenAlEx 6.5 software, using unbiased Nei genetic distances [29].
3.
Results
RAPD and ISSR Combination analysis.
3.1. Genetic diversity within populations of Grewia tenax genotypes
The evaluation of the twelve Grewia populations detected with Fourteen RAPD and 10 ISSR primers resulted in overall Grewia genotypes diversity (He) recorded at 0.250 (Table 4).
Based on pair-wise population analysis, Abuhraz were found to be the most diverse population with average Nei's gene diversity and Shannon index values of 0.325 and 0.480 respectively, whereas Elobaid 2 was the least diverse followed by Elobaid3 (0.184 and 0.201) and Shannon index of (0.205 and 0.301) respectively ( Table 4). The different alleles (Na) and effective alleles numbers (Ne) also followed the same trend being highest for Abuharaz and lowest for Elobaid 2 (Table 4). The proportion of polymorphic loci for the present set of population ranged from 52.47% (Elobaid2) to Abuharaz with average 68.16% polymorphism.
The maximum dissimilarity (0.5) was observed between samples (Elobaid2 and Almnzfa) while the minimum dissimilarity (0.1) was recorded between (Khartoum and Abuharaz).
Pair-wise distance analysis (Nei genetic distance) between populations (Table 5) ranged from 0.267 (between Elobaid 2 and Abuhraz) to 0.098 (between Zalingei and Garsilla). The highest distances were observed between the populations Abuhraz and Shambat.
The distances between the Grewia spp populations were low indicating close relatedness of genotypes from sometimes widely separated geographical locations. This may be due to a high gene flow resulting in exchange across regions.
3.2. Principal Coordinate Analysis (PCO) and AMOVA
Principal coordinate analysis of the 144 Grewia genotypes generated a total variation of 11.17%. The first and the second principal coordinates explained 7.58 and 5.67 of genetic variation, respectively (Figure 2).
PCoA diagram (Figure 3) showed individual accessions of Shambat population from gathering to gather with genotypes from (Elobaid2) population.
Principal coordinate analysis of the12 populations showed a total variation of 36.29%, the first and the second principal coordinates explained 17.52 and 15.12 of genetic variation, respectively (Figure 3).The AMOVA test, calculated to examine the differences in molecular variance among and within geographical populations was found to be statistically significant (p < 001) (Table 6). The test showed highest genetic variation within population (74%), whereas the variation among geographic populations was 26% (Table 6). The calculated PhiPT (0.349) was significant P < 0.001, indicating low genetic differentiation among populations. The P values were calculated for a random permutation test of 9999 permutations (Table 6).
3.3. Total Band Patterns
The highest total number of bands among the 12 studied populations was produced by Grewia tenax genotypes from Abuharaz region producing 215 bands, followed by Almnzfa which produced 213 bands. The lowest number of bands was found in Elobaid2 region which produced 190 bands. No private bands were found in the 12 populations studied.
The highest number of locally bands found in 25% or less, Alain, Abuharaz, Elobaid3, Aldamazin, khoralbyed, Garsilla, Zalingei and Shambat. Elobaid2 and Elobaid3 regions was the lowest one.
The expected mean heterozygosity (He) was highest in the Abuharaz region (0.325) and lowest in Elobaid2 region with 0.184 (Figure 4) (Table 7).
3.4. RAPD and ISSR Data UPGMA Dendrogram
The tree diagram of RAPD and ISSR markers analysis (Figure 5) showed three main clusters, cluster A had two groups, group I included Grewia spp genotypes (2, 7, 8, 10, 11, 12, 13, 17, 18, 14,15) from North kordofan, (Abuhraz, Almnzfa). Group II contained three subgroups, the first from North Kordofan (9, 35, 36, 37, 38), (Abuharaz, Elobaid1, Garsilla) the second contained (21, 22, 23, 24, 25, 26, 27, 29, 30, 28, 33, 34), from Northern Kordofan, (Almnzfa, Elobaid1) the third contained (31, 32), from Northern Kordofan. Cluster B had three groups. Group one had two subgroups, the first from Northern Kordofan contained (39, 40, 47, 44, 48, 43, 45, 41, 42, 46, 49, 50, 51, 53, 54, 57, 55, 56, 52 58, 60, 59), (Garsilla, Zalingei). The second from Northern Kordofan contained (61, 65, 62, 64, 63, 66, 67, 70, 71, 68, 69, 72, 73, 74, 76, 75), (Elobaid2, khoralbyed). Group two had two subgroups, The first from Northern Kordofan contained (77, 78, 79, 80, 81, 82, 83, 84, 85, 86, 87, 88, 90, 89), (khoralbyed, Alain). The second from Northern Kordofan and Blue Nile contained (91, 94, 92, 93, 95, 96, 97, 102, 104, 98, 99, 100, 101, 108, 111, 112, 105, 109, 110, 103), (Alain, Elobaid3, Aldamazin). Group three had three subgroups, the first from Aldamazin contained (113, 114, 115). The second from (Aldamazin, Khartoum, Shambat) contained (116, 118, 117, 119, 127, 120, 121, 124, 122, 123, 126, 128, 125, 129, 130, 132, 131, 133). The third subgroup from Shambat contained (134, 137, 135, 138, 140, 139, 144, 141, 142, 143, 136). Cluster C contained (5, 16, 19, 20) from (Abuhraz, Almnzfa).
4.
Discussion
Molecular markers have emerged as convenient methods for quantifying of genetic diversity in populations [30]. History of populations is often inferred from the variation at genetic markers that are assumed to be neutral. However, if a marker is actually subject to selection, conclusion based on patterns of genetic variation could be misleading [31], [32]. Since neutral marker alleles could be linked to deleterious mutations or selectively favored alleles genetic variation can erode faster than expected under neutral assumptions [33]. Gene diversity estimates based on dominant markers like RAPDs and ISSR depends on the frequency of null homozygotes [34]–[39].
Study of genetic diversity is very important because it can give a clear picture of whether a species can survive in the long run or not. A population with low genetic diversity cannot tolerate negative environmental impacts as most of the population is identical. population with higher genetic diversity can lead to individuals with a new genetic makeup which may make them survive under adverse conditions [40].
The genetic diversity studies using molecular markers have become useful due to their better reliability and high resolution. The low reproducibility of RAPD [41], introduces problem when used for cultivar identification compared with the other marker applications.
ISSRs was proposed for fingerprinting by [42] and commonly used in population genetics, taxonomy and phylogeny of many plant species [43], ISSR primers can also confirm specific amplified DNA polymorphic fragments within the variety [44].The high reproducibility of ISSR markers may be because of using longer primers and higher annealing temperature than those used for RAPD. Based on its unique characters, ISSR technique can detect more genetic loci than isozyme and has higher stability than RAPD [42],[45]–[47], also the technique is more economical than other molecular marker fingerprinting methods (RAPD, RFLP, AFLP, or SSR). Also ISSR fingerprints appeared to be a useful and quick molecular tool to solve the problems of morphological identification and individual characterization of Grewia spp genotypes. Apart from surveying different genomic regions, the marker distribution throughout the genome and the coverage of DNA targets of each specific marker assay provide additional information [48]. Therefore, arbitrary (RAPD), semi-arbitrary (ISSR) markers were used in the present study. First report evaluating the genetic diversity of large number of Grewia tenax genotypes utilizing multiple marker systems in Sudan which are easy to handle and amenable for PCR-based analysis. Since no reports of RAPD and ISSR analysis are available in Sudan, therefore, we have discussed the results in comparison to other tree species.
In the present study, 14 of RAPD and 10 ISSR markers (Tables 2 and 3) were utilized to assess the genetic diversity of 144 Grewia tenax genotypes belonging to 12 different populations collected from 12 districts of Sudan (Table 1).
In this study the mean level of polymorphism revealed by ISSR (97.8 %) is higher than RAPD (94%) method. ISSR primers generated 6 to 12 bands with average of 10.4 bands per populations indicating sufficient genetic diversity among the 144 genotypes (Table 4 and 6).
In the present study the most polymorphic and reproducible pictures have been obtained with poly (AG) or poly (GA) microsatellites, irrespective of the anchors at the 3′ end, which suggests that these are the most frequent simple sequence repeats in Grewia spp genome. However, poly (AT) or poly (CA) microsatellites have not given good profiles. This might be due to the fact that the distribution of these repeats in the Grewia spp genome was beyond the range of amplification by Taq DNA polymerase. However, this is not likely the situation for poly (AT) repeats, as these are reported to be the most abundant motifs in different plant species [49],[50]. However, in the present investigation, poly (AT) or poly (TA) repeats gave improper amplifications. Similar results were found in rice [51],[52], grapevine [53], wheat [54]. Populations genetics in varieties of Grewia tenax were studied using RAPD and ISSR markers. In present study, the applicability of ISSR and RAPD is compared as genetic marker to characterize the population of Grewia tenax. The results indicate that percentage of ISSR polymorphic bands (97.8%) are higher than RAPD polymorphic bands (94%), these findings are in disagreement with [55] who reported screening of twenty ISSR primers and twenty-five RAPD primers in Grewia optiva, reporting 91.72% and 96.31% respectively. Our results showed that ISSR primers revealed more DNA polymorphism (97.8%) among genotypes of Grewia tenax than RAPD primers (94%). Whereas our results are in agreement with [56].In the study of Morus alba, they observed that ISSR primers revealed 74.13% polymorphism while RAPD generated 60.75% polymorphism among the 11 mulberry genotypes which showed that ISSR primers were more efficient in revealing the DNA polymorphism.
The AMOVA of the 12 populations revealed that higher genetic variations existed within the populations i.e., 77% and 71% compared to that observed among populations (23 and 29%) with RAPD and ISSR marker systems respectively, while the combination RAPD+ISSR showed 74%, 26%, (Table 6). The results demonstrate that most of the variations in the Grewia populations are due to greater genetic diversity within the populations as opposed to between populations. Greater genetic variation within the populations (88.2%) was also observed in P. cineraria compared to the variance among populations (11.8%), [57]. Similar results were also observed in Acacia senegal populations, 86% within and 14% among the populations [58].
The dendrograms based on RAPD and ISSR combined markers showed partially different genetic distance levels than when used individually. But when used together, ISSR-based cluster is more similar to the combined cluster than RAPD-based cluster. Results are in disagreement with the studies in Grewia optiva species [55] However, it was discovered that the ISSR-based cluster is more comparable to the combined cluster than the RAPD-based cluster in Lupin (Lupinus sp) [59]. Jatropha curcas also showed similar result when RAPD and ISSR dendrogram patterns were combined [60].
Cluster analysis was carried out on marker profiling data based on RAPD, ISSR and combination between RAPD-ISSR. The results based on all the DNA marker profiles broadly grouped the 12 populations into three clusters. There was close relationship between some of the populations used in this study; presumably they might have been collected from similar locations.
According to combined RAPD, ISSR profiles, these genotypes are more closely related in genetic relationship to their populations. For example, samples (Abuhraz, Almnzfa and Elobaid1), coded as ( 3, 4, 6, 11, 21, 22, 34, 23, 24, 33, 25, 27, 26, 28, 29, 30, 32, 31) from North Kordofan were joined RAPD cluster grouped together and closely related also to genotypes from (Alain, Elobaid3, Aldamazin), coded as (93, 108, 104, 110, 105, 109), were joined RAPD cluster. This type of pairing could be attributed to importation or exchange of plants among the populations, as the sites were close enough geographically for introduction of plants from other locations to occur.
The clustering pattern of Grewia tenax samples obtained using different marker systems (RAPDs, ISSR) exhibited variations in grouping of the samples independent of their place of origin, probably indicating the presence of wide genetic variability among the Grewia tenax from different regions of Sudan. Several studies have also reported limited or low correlation between geographic region and genetic relatedness using molecular marker data [55].
This study documenting genetic diversity of Grewia tenax genotypes using multiple marker systems (RAPD, ISSR) demonstrated high genetic diversity within populations but moderate genetic diversity among populations. This genetically diverse wild genotypes from twelve populations in Sudan, is urgently required to be characterized and conserved and exploited judiciously for agroforestry, medicinal and timber purposes so as to ensure the existence of the species in near future as well as to harvest economic benefits.
RAPD and ISSR markers combination have been used in many studies for DNA fingerprinting and phylogenetic analysis [61]. Our study, agreement with [62], we have seen that the reproducibility of RAPD and ISSR markers depends on right PCR conditions.
This study clearly showed that it was possible to analyze the RAPD and ISSR patterns for correlating their similarity and distance between Grewia tenax genotypes.
From the results of the combination RAPD - ISSR profiling, it was observed that Grewia tenax genotypes produced good number of amplified bands but few showed less number of amplified bands on some primer. Similarity, unique patterns were observed differentiating all 144 genotypes from each other by using 10 ISSR primers and 14 RAPD primers. It can be concluded that RAPD and ISSR markers could be used for differentiating Grewia genotypes and it might help in generating molecular data base for genotypes conservation.
Effective plant improvement programs depend on the variability of genetic diversity. It is well known that land races are the original source of variation in plants and are still the major source of variation for crop improvement programs in developing countries.
5.
Conclusions
The genetic variation and genetic relationships among Grewia spp populations from different regions were efficiently determined using RAPD and ISSR markers.
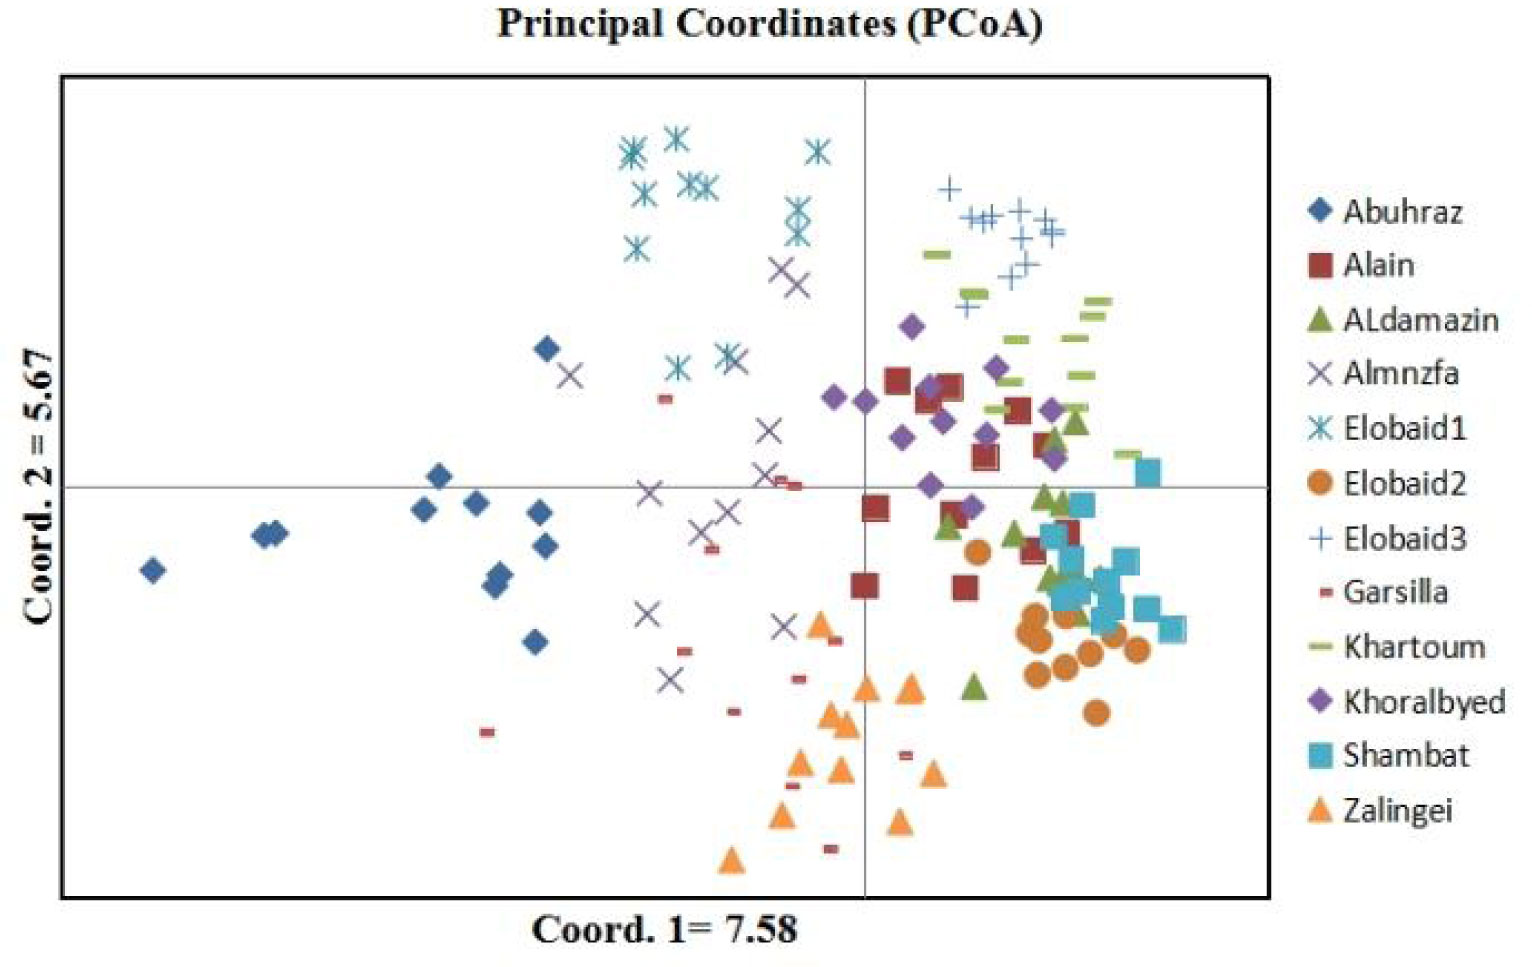
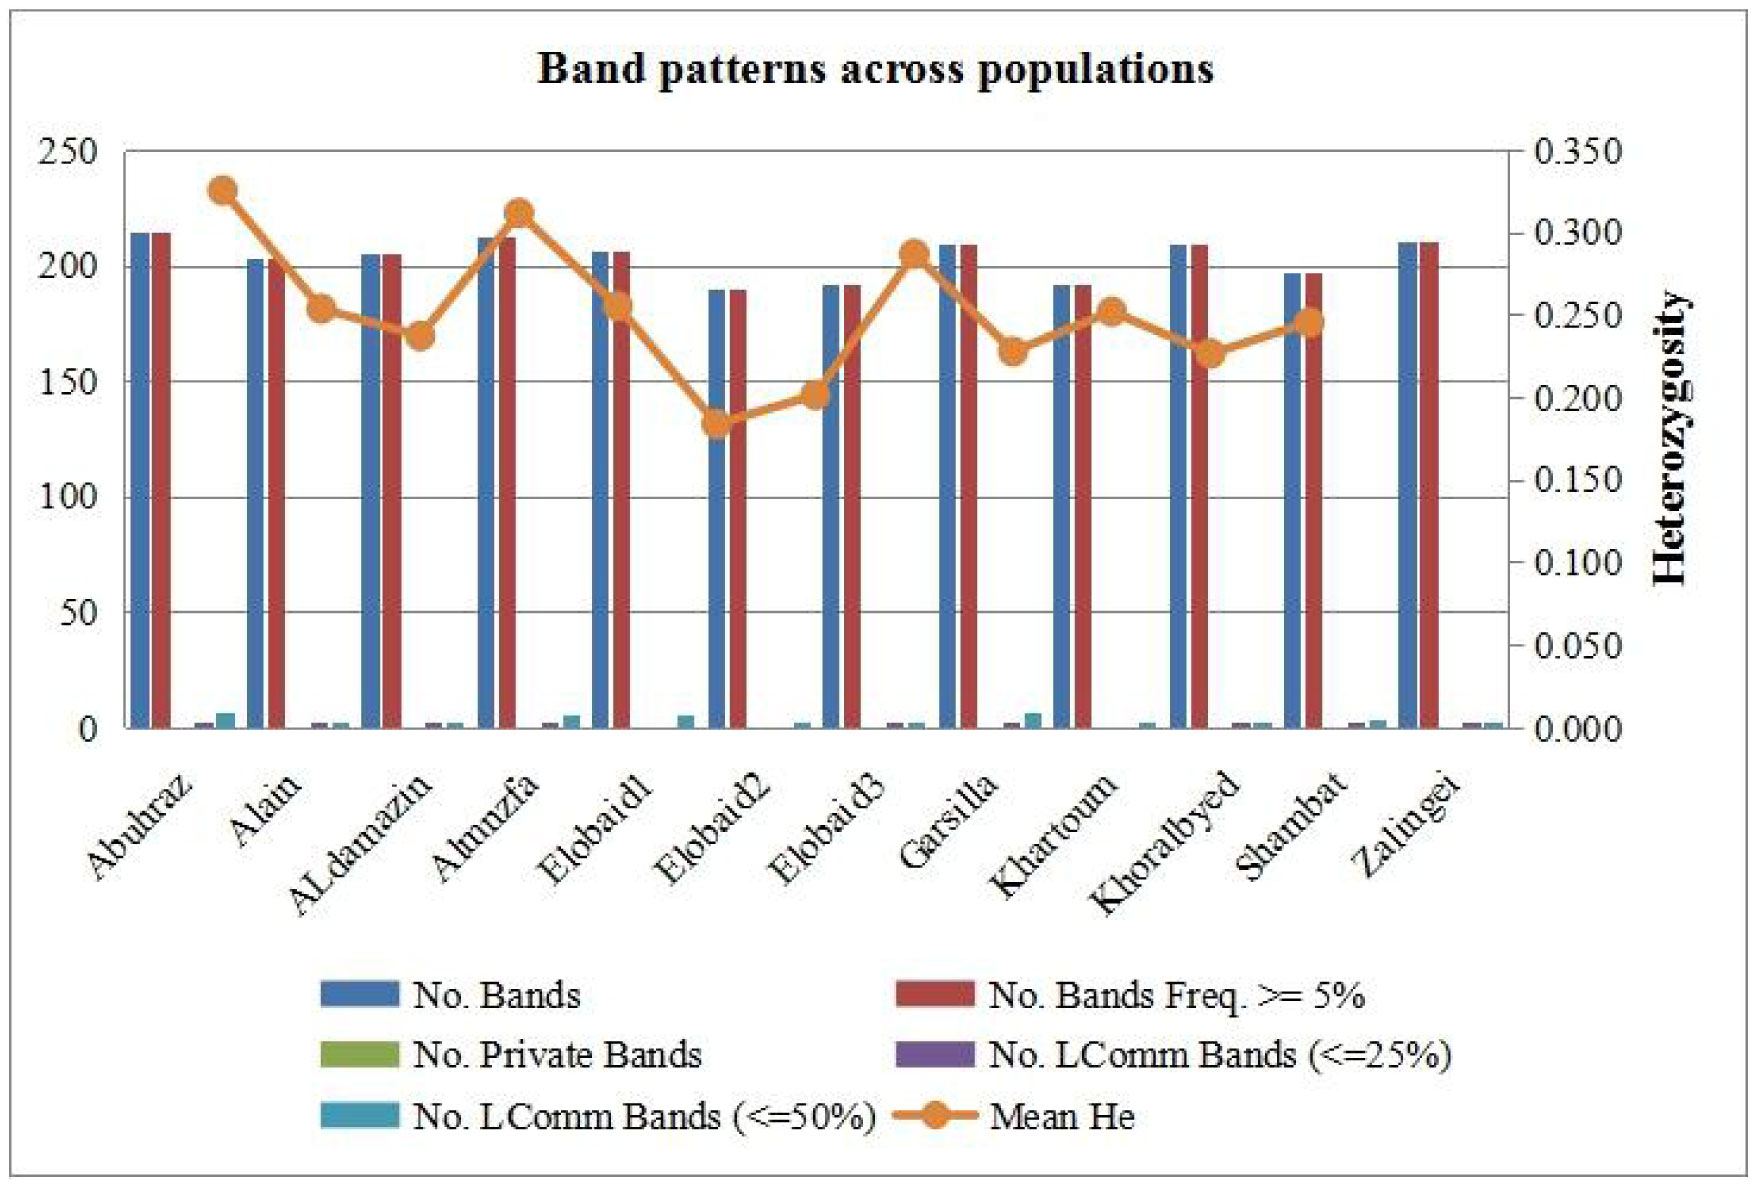
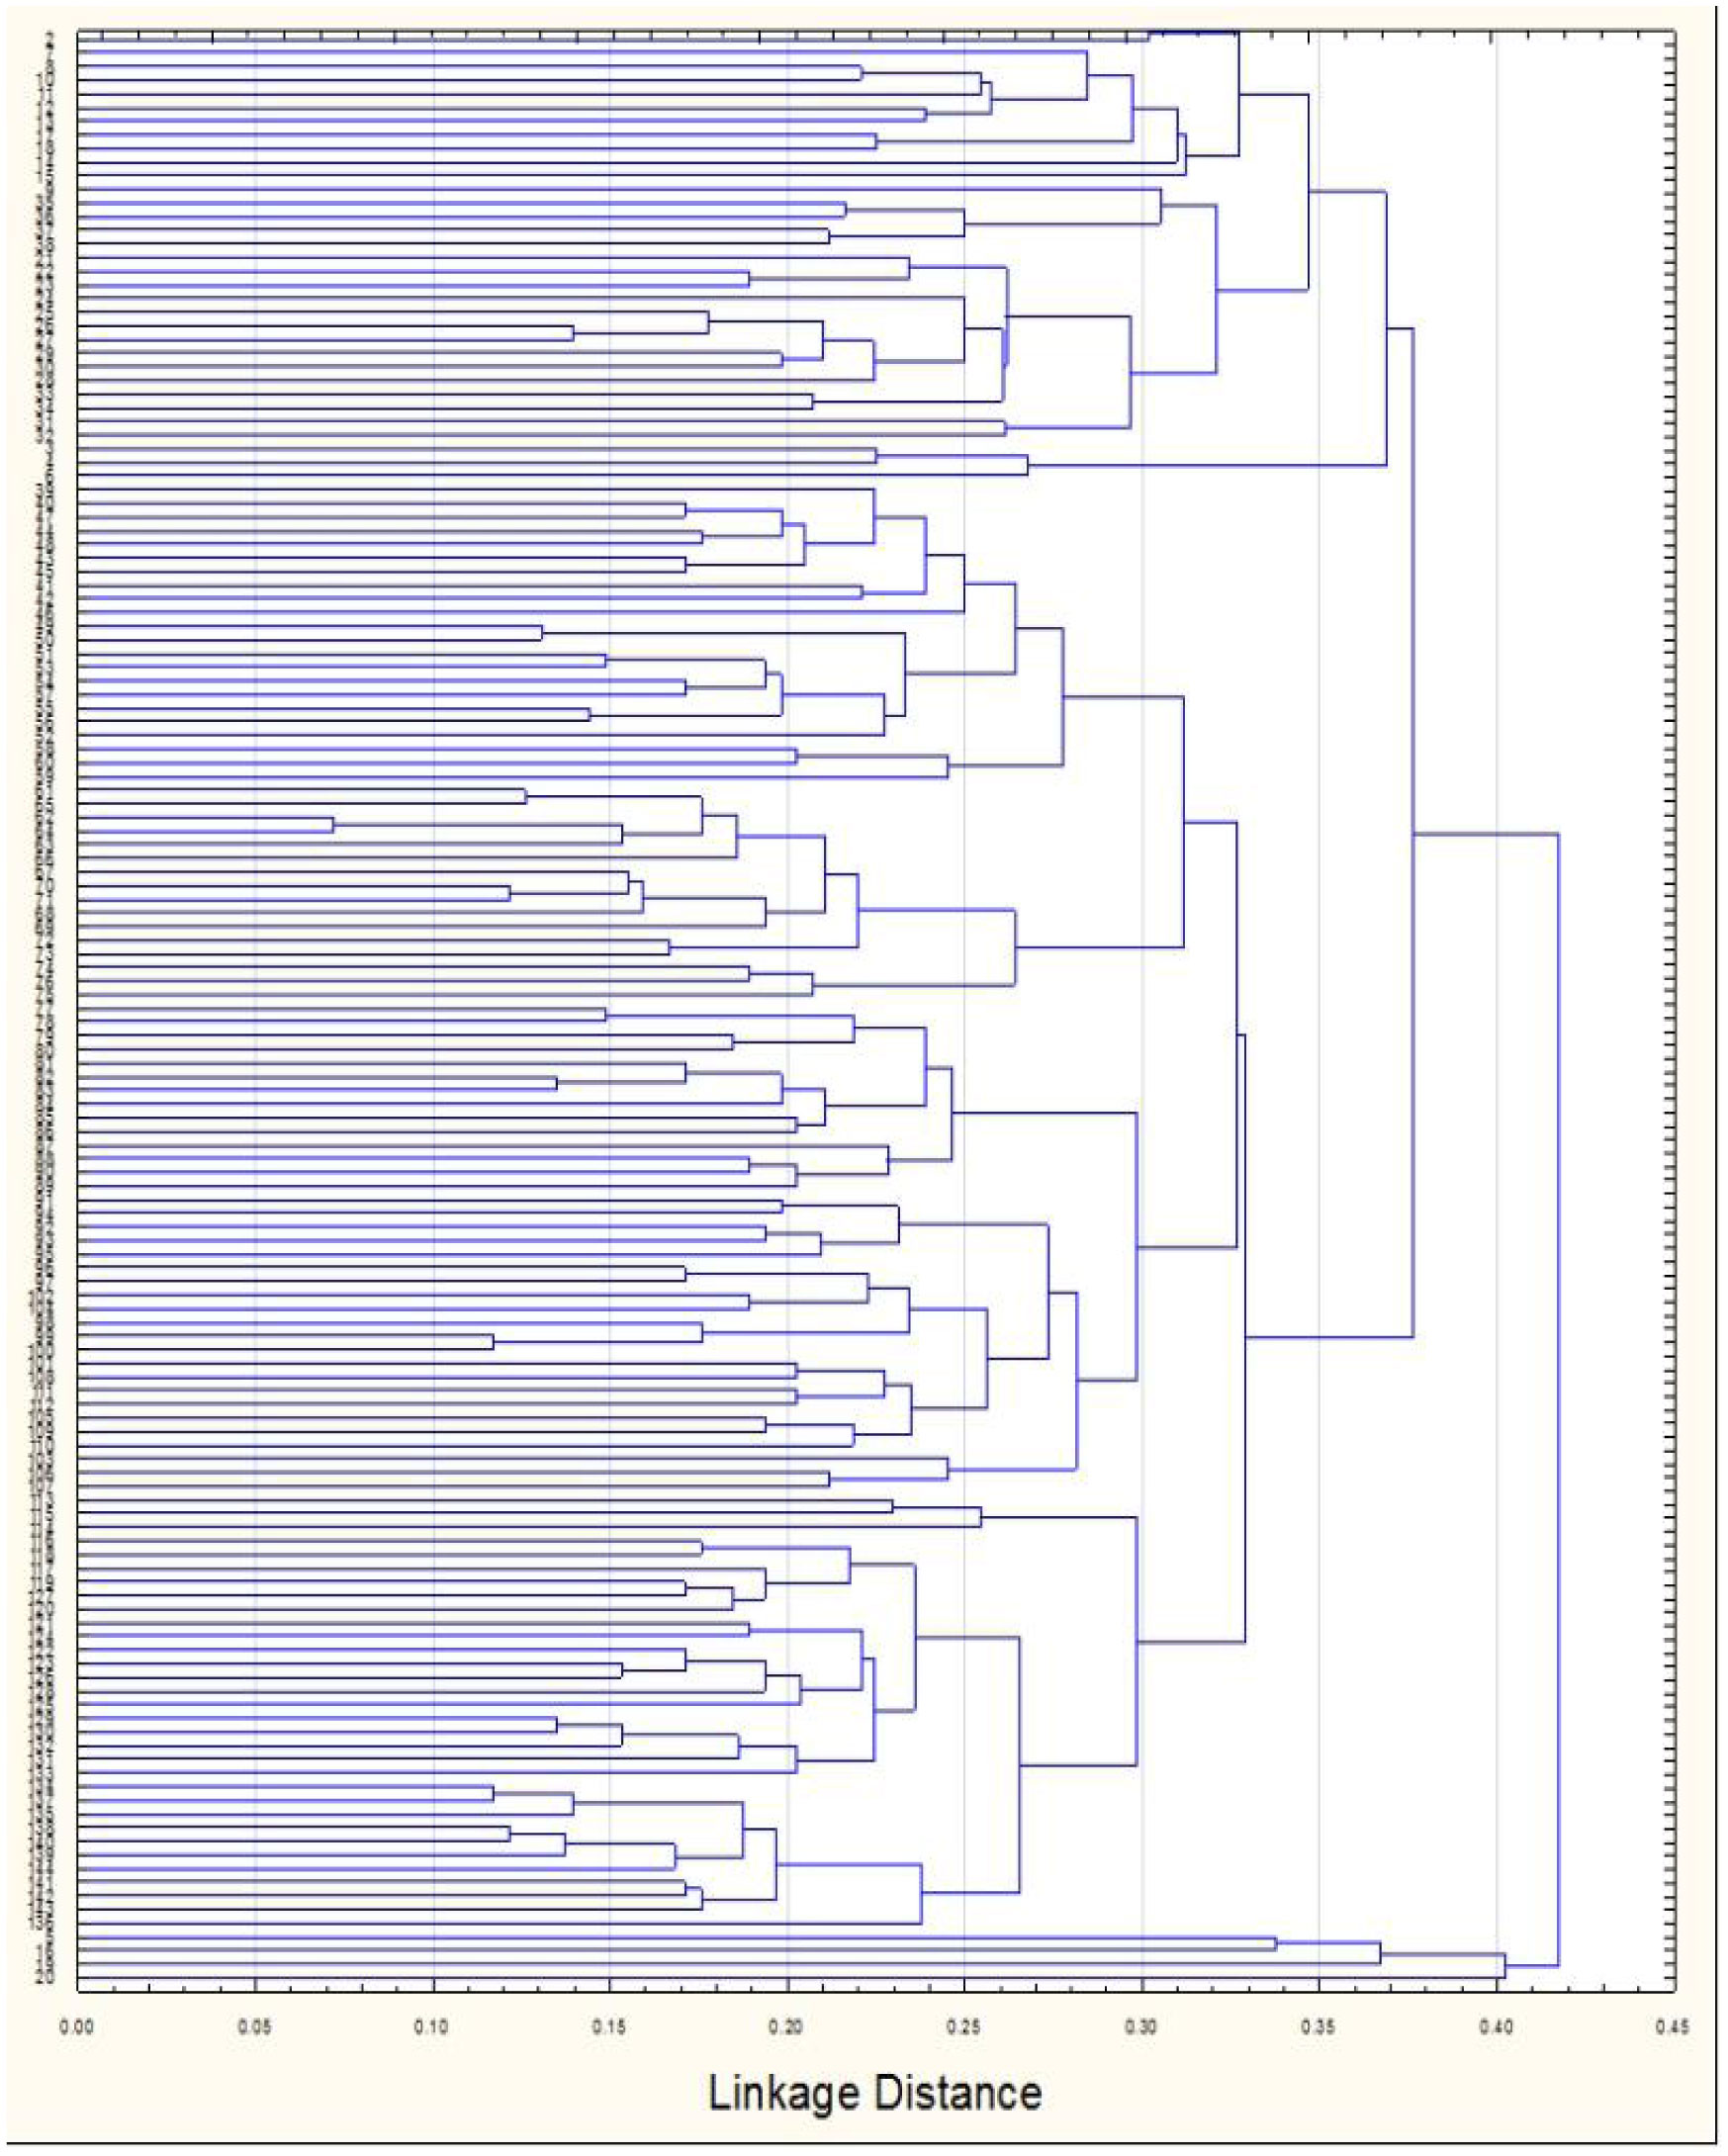
 The identification of Grewia tenax from the Sudan contributes to our knowledge of genetic relationships and the strategies required for protecting natural populations and preserving genetic diversity. 
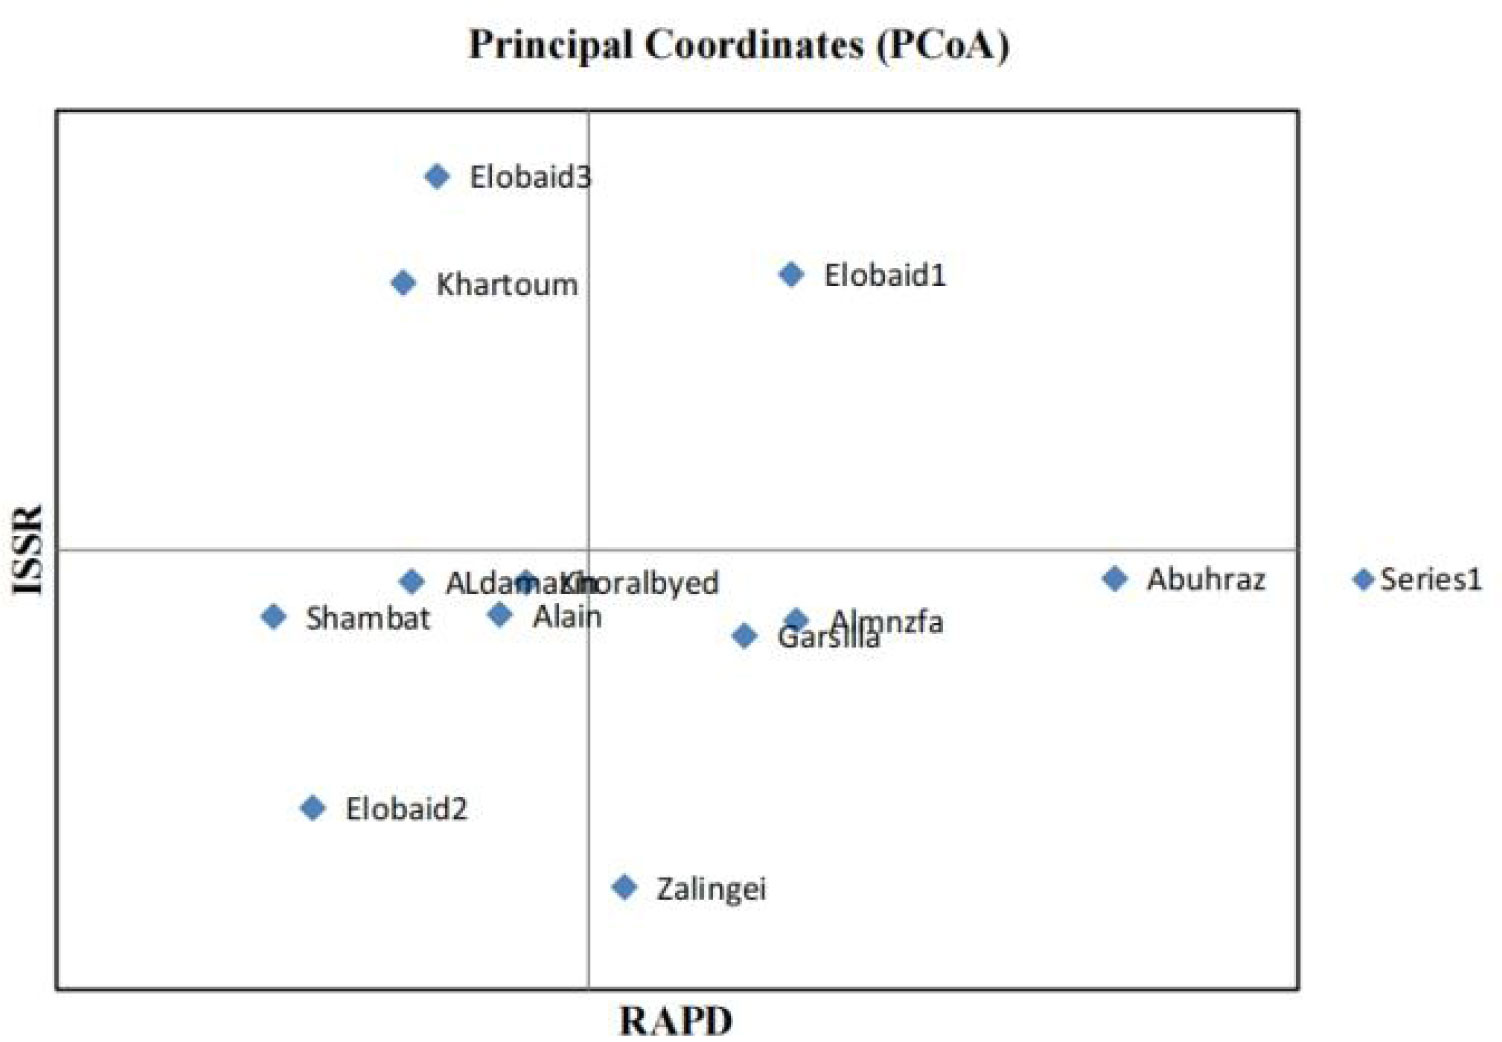
It was concluded that both the marker systems RAPD and ISSR either individually or in combination can be effectively used in determination of genetic relationships among Grewia tenax genotypes.