Our aim was to compare the prealbumin/fibrinogen ratio (PFR) of diabetic patient populations with or without diabetic nephropathy.
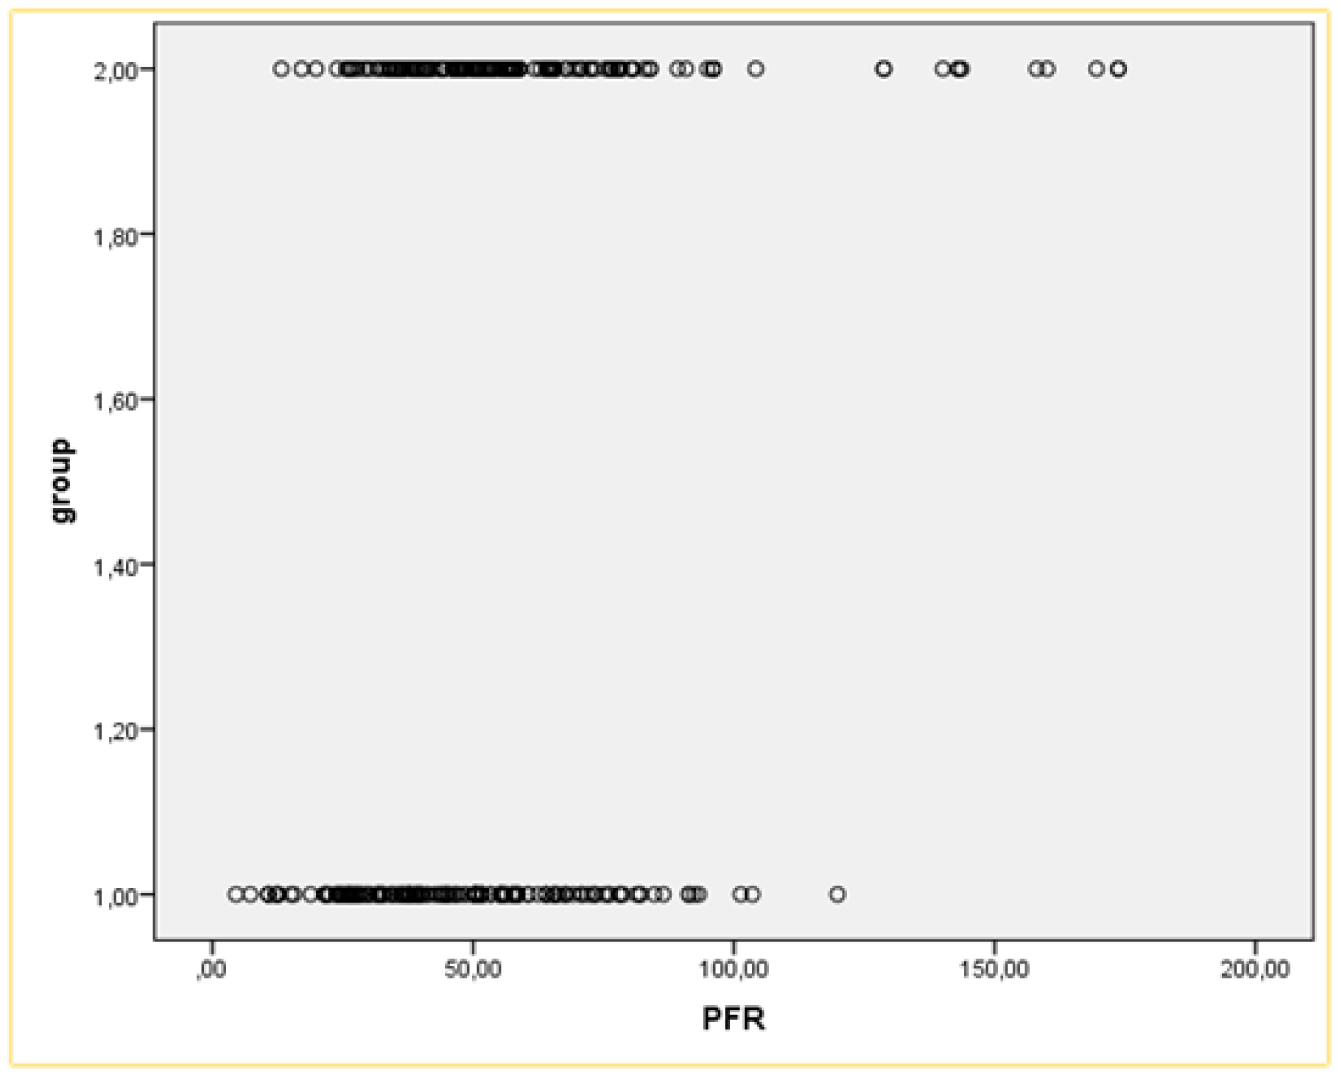
People with type 2 diabetes who attended the internal medicine outpatient clinic were enrolled in the study. Two groups were formed according to the proteinuria of the patients: Diabetic nephropathy and non-nephropathy group. Diabetic nephropathy was calculated using the mathematical formula of spot urine albumin/spot urine creatinine x100. Patients with proteinuria above 200 mg/g were considered to have nephropathy. PFR was simply calculated by dividing prealbumin by fibrinogen.
A total of 152 patients who attended our outpatient clinic were enrolled in the study. There were 68 patients in the diabetic nephropathy group and 84 in the non-nephropathy group. The prealbumin/fibrinogen ratios (PFR) were significantly lower in the nephropathic group [0.061 (0.02–0.16)] than the non-nephropathic group [0.0779 (0.01–0.75)] (p = 0.002).
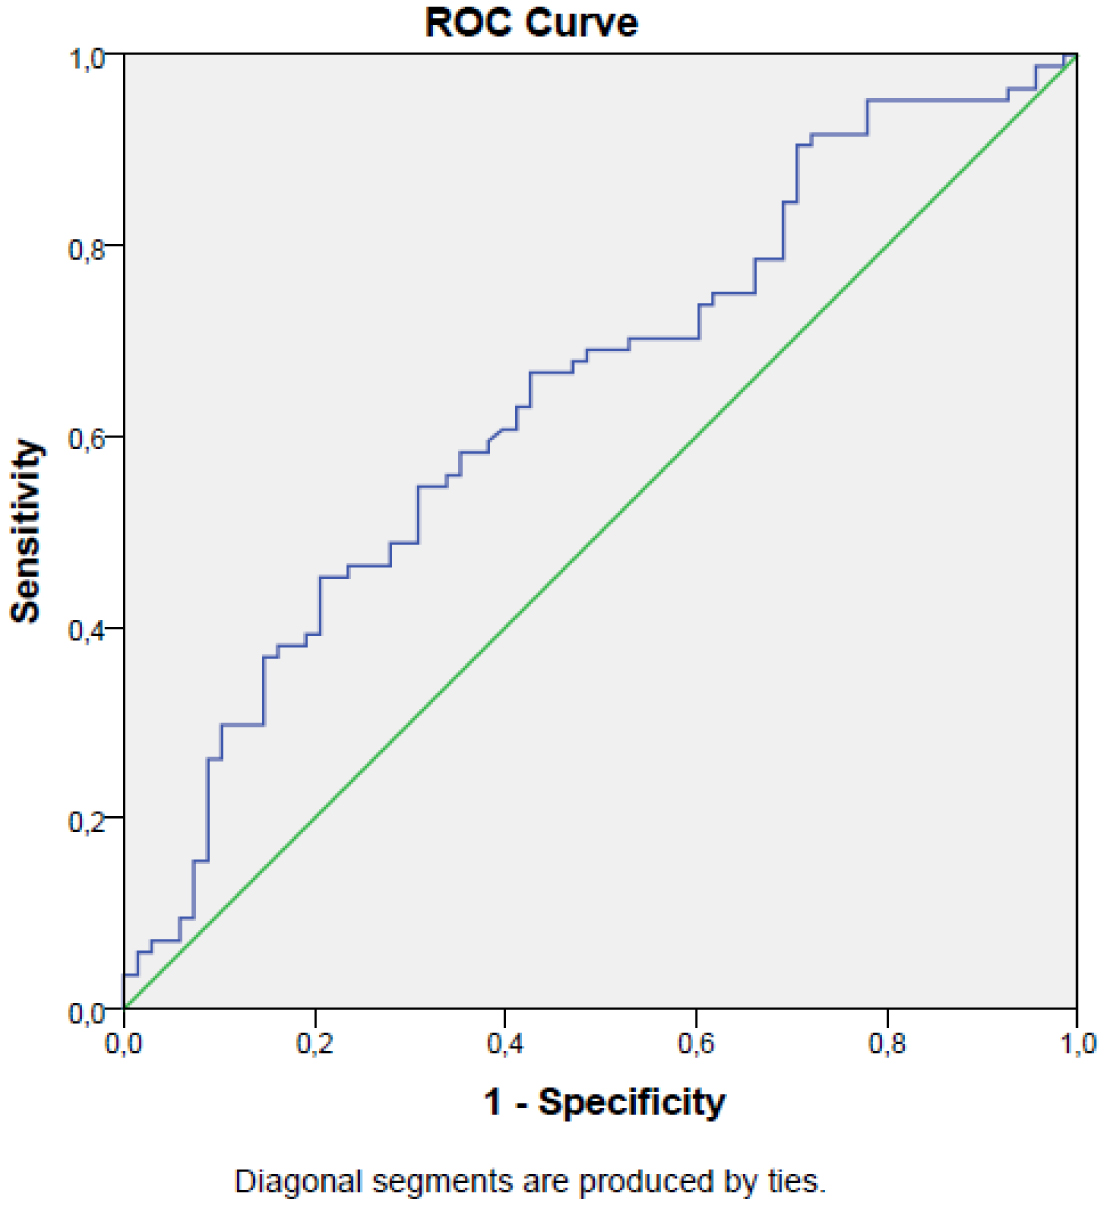
We suggest that decreased levels of PFR can indicate diabetic nephropathy in subjects with type 2 diabetes mellitus.
Citation: Burcin Meryem Atak Tel, Ramiz Tel, Tuba Duman, Satilmis Bilgin, Hamza Kaya, Halil Bardak, Gulali Aktas. Evaluation of the relationship between the prealbumin/fibrinogen ratio and diabetic nephropathy in patients with type 2 diabetes mellitus[J]. AIMS Medical Science, 2024, 11(2): 90-98. doi: 10.3934/medsci.2024008
Our aim was to compare the prealbumin/fibrinogen ratio (PFR) of diabetic patient populations with or without diabetic nephropathy.
People with type 2 diabetes who attended the internal medicine outpatient clinic were enrolled in the study. Two groups were formed according to the proteinuria of the patients: Diabetic nephropathy and non-nephropathy group. Diabetic nephropathy was calculated using the mathematical formula of spot urine albumin/spot urine creatinine x100. Patients with proteinuria above 200 mg/g were considered to have nephropathy. PFR was simply calculated by dividing prealbumin by fibrinogen.
A total of 152 patients who attended our outpatient clinic were enrolled in the study. There were 68 patients in the diabetic nephropathy group and 84 in the non-nephropathy group. The prealbumin/fibrinogen ratios (PFR) were significantly lower in the nephropathic group [0.061 (0.02–0.16)] than the non-nephropathic group [0.0779 (0.01–0.75)] (p = 0.002).
We suggest that decreased levels of PFR can indicate diabetic nephropathy in subjects with type 2 diabetes mellitus.

| [1] |
Lovic D, Piperidou A, Zografou I, et al. (2020) The growing epidemic of ddiabetes mellitus. Curr Vasc Pharmacol 18: 104-109. https://doi.org/10.2174/1570161117666190405165911 
|
| [2] |
Arnous MM, Al Saidan AA, Al Dalbhi S, et al. (2022) Association of atrial fibrillation with diabetic nephropathy: A meta-analysis. J Family Med Prim Care 11: 3880-3884. https://doi.org/10.4103/jfmpc.jfmpc_577_21
|
| [3] |
Kim YG, Han KD, Roh SY, et al. (2023) Being underweight is associated with increased risk of sudden cardiac death in people with diabetes mellitus. J Clin Med 12: 1045. https://doi.org/10.3390/jcm12031045
|
| [4] |
Bailes BK (2002) Diabetes mellitus and its chronic complications. AORN J 76: 266-27. https://doi.org/10.1016/s0001-2092(06)61065-x
|
| [5] |
Braunwald E (2019) Diabetes, heart failure, and renal dysfunction: The vicious circles. Prog Cardiovasc Dis 62: 298-302. https://doi.org/10.1016/j.pcad.2019.07.003
|
| [6] |
Targher G, Bertolini L, Zoppini G, et al. (2005) Increased plasma markers of inflammation and endothelial dysfunction and their association with microvascular complications in Type 1 diabetic patients without clinically manifest macroangiopathy. Diabet Med 22: 999-1004. https://doi.org/10.1111/j.1464-5491.2005.01562.x
|
| [7] |
Spijkerman AM, Gall MA, Tarnow L, et al. (2007) Endothelial dysfunction and low-grade inflammation and the progression of retinopathy in Type 2 diabetes. Diabet Med 24: 969-76. https://doi.org/10.1111/j.1464-5491.2007.02217.x
|
| [8] |
Mansoor G, Tahir M, Maqbool T, et al. (2022) Increased expression of circulating stress markers, inflammatory cytokines and decreased antioxidant level in diabetic nephropathy. Medicina (Kaunas) 58: 1604. https://doi.org/10.3390/medicina58111604
|
| [9] |
Yue W, Liu Y, Ding W, et al. (2015) The predictive value of the prealbumin-to-fibrinogen ratio in patients with acute pancreatitis. Int J Clin Pract 69: 1121-1128. https://doi.org/10.1111/ijcp.12682
|
| [10] |
Hrnciarikova D, Juraskova B, Hyspler R, et al. (2007) A changed view of serum prealbumin in the elderly: prealbumin values influenced by concomitant inflammation. Biomed Pap Med Fac Univ Palacky Olomouc Czech Repub 151: 273-276. https://doi.org/10.5507/bp.2007.046
|
| [11] |
Sun DW, An L, Lv GY (2020) Albumin-fibrinogen ratio and fibrinogen-prealbumin ratio as promising prognostic markers for cancers: an updated meta-analysis. World J Surg Oncol 18: 9. https://doi.org/10.1186/s12957-020-1786-2
|
| [12] |
Omiya K, Sato H, Sato T, et al. (2021) Albumin and fibrinogen kinetics in sepsis: a prospective observational study. Crit Care 25: 436. https://doi.org/10.1186/s13054-021-03860-7
|
| [13] |
Chen C, Liu L, Luo J (2022) Identification of the molecular mechanism and candidate markers for diabetic nephropathy. Ann Transl Med 10: 1248. https://doi.org/10.21037/atm-22-5128
|
| [14] |
Hou S, Jin C, Yang M, et al. (2022) Prognostic Value of Hematologic Prealbumin/Fibrinogen Ratio in Patients with Glioma. World Neurosurg 160: e442-e453. https://doi.org/10.1016/j.wneu.2022.01.048
|
| [15] |
Bilgin S, Kurtkulagi O, Atak Tel BM, et al. (2021) Does C-reactive protein to serum Albumin Ratio correlate with diabEtic nephropathy in patients with type 2 diabetes MEllitus? The CARE TIME study. Prim Care Diabetes 15: 1071-1074. https://doi.org/10.1016/j.pcd.2021.08.015
|
| [16] |
Kocak MZ, Aktas G, Duman TT, et al. (2020) Monocyte lymphocyte ratio as a predictor of diabetic kidney injury in type 2 diabetes mellitus; The MADKID study. J Diabetes Metab Disord 19: 997-1002. https://doi.org/10.1007/s40200-020-00595-0
|
| [17] | Wang J, Xi H, Zhang K, et al. (2020) Circulating C-reactive protein to prealbumin ratio and prealbumin to fibrinogen ratio are two promising inflammatory markers associated with disease activity in rheumatoid arthritis. Clin Lab 66. https://doi.org/10.7754/Clin.Lab.2019.190833 |
| [18] |
Zhang HL, Zhang XM, Mao XJ, et al. (2012) Altered cerebrospinal fluid index of prealbumin, fibrinogen, and haptoglobin in patients with Guillain-Barre syndrome and chronic inflammatory demyelinating polyneuropathy. Acta Neurol Scand 125: 129-135. https://doi.org/10.1111/j.1600-0404.2011.01511.x
|
| [19] |
Zang S, Shi L, Zhao J, et al. (2020) Prealbumin to fibrinogen ratio is closely associated with diabetic peripheral neuropathy. Endocr Connect 9: 858-863. https://doi.org/10.1530/EC-20-0316
|
| [20] |
Rim TH, Byun IH, Kim HS, et al. (2013) Factors associated with diabetic retinopathy and nephropathy screening in Korea: the third and fourth Korea national health and nutrition examination survey (KNHANES III and IV). J Korean Med Sci 28: 814-820. https://doi.org/10.3346/jkms.2013.28.6.814
|
| [21] |
Hess K (2015) The vulnerable blood. Coagulation and clot structure in diabetes mellitus. Hamostaseologie 35: 25-33. https://doi.org/10.5482/HAMO-14-09-0039
|
| [22] | Dayer MR, Mard-Soltani M, Dayer MS, et al. (2014) Causality relationships between coagulation factors in type 2 diabetes mellitus: path analysis approach. Med J Islam Repub Iran 28: 59. |
| [23] |
Zhou C, Zhang Y, Yang S, et al. (2022) Associations between visceral adiposity index and incident nephropathy outcomes in diabetic patients: Insights from the ACCORD trial. Diabetes Metab Res Rev 39: e3602. http://doi.org/10.1002/dmrr.3602.e3602
|
| [24] |
Aktas G (2023) Association between the prognostic nutritional index and chronic microvascular complications in patients with type 2 diabetes mellitus. J Clin Med 12: 5952. https://doi.org/10.3390/jcm12185952
|
| [25] |
Aktas G, Yilmaz S, Kantarci DB, et al. (2023) Is serum uric acid-to-HDL cholesterol ratio elevation associated with diabetic kidney injury?. Postgrad Med 135: 519-523. https://doi.org/10.1080/00325481.2023.2214058
|
Figures(2) / Tables(1)

Burcin Meryem Atak Tel, Ramiz Tel, Tuba Duman, Satilmis Bilgin, Hamza Kaya, Halil Bardak, Gulali Aktas. Evaluation of the relationship between the prealbumin/fibrinogen ratio and diabetic nephropathy in patients with type 2 diabetes mellitus[J]. AIMS Medical Science, 2024, 11(2): 90-98. doi: 10.3934/medsci.2024008


 DownLoad: