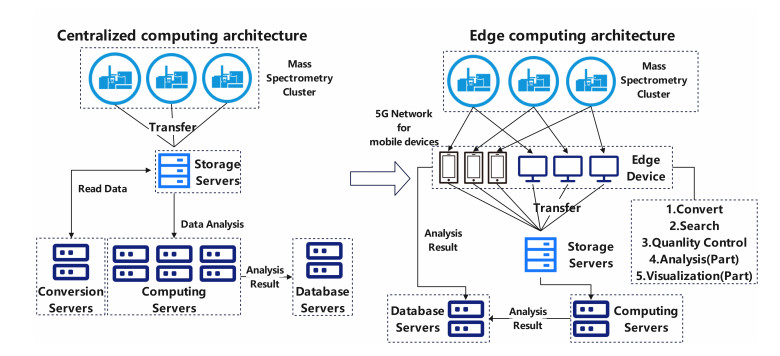
With the continuous improvement of biological detection technology, the scale of biological data is also increasing, which overloads the central-computing server. The use of edge computing in 5G networks can provide higher processing performance for large biological data analysis, reduce bandwidth consumption and improve data security. Appropriate data compression and reading strategy becomes the key technology to implement edge computing. We introduce the column storage strategy into mass spectrum data so that part of the analysis scenario can be completed by edge computing. Data produced by mass spectrometry is a typical biological big data based. A blood sample analysed by mass spectrometry can produce a 10 gigabytes digital file. By introducing the column storage strategy and combining the related prior knowledge of mass spectrometry, the structure of the mass spectrum data is reorganized, and the result file is effectively compressed. Data can be processed immediately near the scientific instrument, reducing the bandwidth requirements and the pressure of the central server. Here, we present Aird-Slice, a mass spectrum data format using the column storage strategy. Aird-Slice reduces volume by 48% compared to vendor files and speeds up the critical computational step of ion chromatography extraction by an average of 116 times over the test dataset. Aird-Slice provides the ability to analyze biological data using an edge computing architecture on 5G networks.
Citation: Miaoshan Lu, Junjie Tong, Weidong Fang, Jinyin Wang, Shaowei An, Ruimin Wang, Hengxuan Jiang, Changbin Yu. Column storage enables edge computation of biological big data on 5G networks[J]. Mathematical Biosciences and Engineering, 2023, 20(9): 17197-17219. doi: 10.3934/mbe.2023766
With the continuous improvement of biological detection technology, the scale of biological data is also increasing, which overloads the central-computing server. The use of edge computing in 5G networks can provide higher processing performance for large biological data analysis, reduce bandwidth consumption and improve data security. Appropriate data compression and reading strategy becomes the key technology to implement edge computing. We introduce the column storage strategy into mass spectrum data so that part of the analysis scenario can be completed by edge computing. Data produced by mass spectrometry is a typical biological big data based. A blood sample analysed by mass spectrometry can produce a 10 gigabytes digital file. By introducing the column storage strategy and combining the related prior knowledge of mass spectrometry, the structure of the mass spectrum data is reorganized, and the result file is effectively compressed. Data can be processed immediately near the scientific instrument, reducing the bandwidth requirements and the pressure of the central server. Here, we present Aird-Slice, a mass spectrum data format using the column storage strategy. Aird-Slice reduces volume by 48% compared to vendor files and speeds up the critical computational step of ion chromatography extraction by an average of 116 times over the test dataset. Aird-Slice provides the ability to analyze biological data using an edge computing architecture on 5G networks.

| [1] |
H. Lin, S. Garg, J. Hu, X. Wang, M. J. Piran, M. S. Hossain, Privacy-enhanced data fusion for COVID-19 applications in intelligent internet of medical things, IEEE Int. Things J., 8 (2020), 15683–15693. https://doi.org/10.1109/JIOT.2020.3033129 doi: 10.1109/JIOT.2020.3033129

|
| [2] |
W. Fang, C. Zhu, W. Zhang, Toward secure and lightweight data transmission for cloud-edge-terminal collaboration in artificial intelligence of things, IEEE Int. Things J., (2023). https://doi.org/10.1109/JIOT.2023.3295438 doi: 10.1109/JIOT.2023.3295438
|
| [3] |
W. Fang, C. Zhu, F. R. Yu, K. Wang, W. Zhang, A secure data aggregation strategy in edge computing and blockchain empowered internet of things, IEEE Trans. Ind. Inform., 18 (2022), 4265-4274. https://doi.org/10.1109/TII.2021.3122370 doi: 10.1109/TII.2021.3122370
|
| [4] | D. Abadi, S. Madden, M. Ferreira, Integrating compression and execution in column-oriented database systems, in Proceedings of the 2006 ACM SIGMOD international conference on Management of data, (2006), 671–682. https://doi.org/10.1145/1142473.1142548 |
| [5] | D. J. Abadi, Column stores for wide and sparse data, in CIDR 2007 - 3rd Biennial Conference on Innovative Data Systems Research, (2007), 292–297. |
| [6] | D. J. Abadi, S. R. Madden, N. Hachem, Column-stores vs. row-stores: How different are they really?, in Proceedings of the 2008 ACM SIGMOD International Conference on Management of Data, (2008), 967–980. https://doi.org/10.1145/1376616.1376712 |
| [7] |
K. Cao, Y. Liu, G. Meng, Q. Sun, An overview on edge computing research, IEEE Access, 8 (2020), 85714–85728. https://doi.org/10.1109/ACCESS.2020.2991734 doi: 10.1109/ACCESS.2020.2991734
|
| [8] |
Y. Ai, M. Peng, K. Zhang, Edge computing technologies for Internet of Things: a primer, Digital Commun. Netw., 4 (2018), 77–86. https://doi.org/10.1016/j.dcan.2017.07.001 doi: 10.1016/j.dcan.2017.07.001
|
| [9] |
N. Hulstaert, J. Shofstahl, T. Sachsenberg, M. Walzer, H. Barsnes, L. Martens, et al., ThermoRawFileParser: Modular, scalable, and cross-platform RAW file conversion, J. Proteome Res., 19 (2020), 537–542. https://doi.org/10.1021/acs.jproteome.9b00328 doi: 10.1021/acs.jproteome.9b00328
|
| [10] |
E. W. Deutsch, File formats commonly used in mass spectrometry proteomics, Mol. Cell. Proteomics, 11 (2012), 1612–1621. https://doi.org/10.1074/mcp.R112.019695 doi: 10.1074/mcp.R112.019695
|
| [11] |
H. S. Wiley, G. S. Michaels, Should software hold data hostage?, Nat. Biotechnol., 22 (2004), 1037–1038. https://doi.org/10.1038/nbt0804-1037 doi: 10.1038/nbt0804-1037
|
| [12] |
L. Martens, A. I. Nesvizhskii, H. Hermjakob, M. Adamski, G. S. Omenn, J. Vandekerckhove, et al., Do we want our data raw? Including binary mass spectrometry data in public proteomics data repositories, Proteomics, 5 (2005), 3501-3505. https://doi.org/10.1002/pmic.200401302 doi: 10.1002/pmic.200401302
|
| [13] |
G. Mayer, L. Montecchi-Palazzi, D. Ovelleiro, A. R. Jones, P. A. Binz, E. W. Deutsch, et al., The HUPO proteomics standards initiativemass spectrometry controlled vocabulary, Database, 2013 (2013). https://doi.org/10.1093/database/bat009 doi: 10.1093/database/bat009
|
| [14] |
P. G. A. Pedrioli, J. K. Eng, R. Hubley, M. Vogelzang, E. W. Deutsch, B. Raught, et al., A common open representation of mass spectrometry data and its application to proteomics research, Nat. Biotechnol., 22 (2004), 3501-3505. https://doi.org/10.1038/nbt1031 doi: 10.1038/nbt1031
|
| [15] |
L. Martens, M. Chambers, M. Sturm, D. Kessner, F. Levander, J. Shofstahl, et al., mzML—a Community Standard for Mass Spectrometry Data, Mol. Cell. Proteomics, 10 (2011). https://doi.org/10.1074/mcp.R110.000133 doi: 10.1074/mcp.R110.000133
|
| [16] |
E. W. Deutsch, N. Bandeira, V. Sharma, Y. Perez-Riverol, J. J. Carver, D. J. Kundu, et al., The ProteomeXchange consortium in 2020: Enabling 'big data' approaches in proteomics, Nucleic Acids Res., 48 (2020), D1145–D1152. https://doi.org/10.1093/nar/gkz984 doi: 10.1093/nar/gkz984
|
| [17] |
E. W. Deutsch, N. Bandeira, Y. Perez-Riverol, V. Sharma, J. J. Carver, L. Mendoza, et al., The ProteomeXchange consortium at 10 years: 2023 update, Nucleic Acids Res., 51 (2023), D1539–D1548. https://doi.org/10.1093/nar/gkac1040 doi: 10.1093/nar/gkac1040
|
| [18] |
N. S. Kale, K. Haug, P. Conesa, K. Jayseelan, P. Moreno, P. Rocca‐Serra, et al., MetaboLights: An open-access database repository for metabolomics data, Current Protoc. Bioinformatics, 2016 (2016). https://doi.org/10.1002/0471250953.bi1413s53 doi: 10.1002/0471250953.bi1413s53
|
| [19] |
K. Haug, K. Cochrane, V. C. Nainala, M. Williams, J. Chang, K. V. Jayaseelan, et al., MetaboLights: An open-access database repository for metabolomics data, Nucleic Acids Res., 48 (2020), D440–D444. https://doi.org/10.1093/nar/gkz1019 doi: 10.1093/nar/gkz1019
|
| [20] |
M. Wilhelm, M. Kirchner, J. A. J. Steen, H. Steen, mz5: Space- and time-efficient storage of mass spectrometry data sets, Mol. Cell. Proteomics, 11 (2012). https://doi.org/10.1074/mcp.O111.011379 doi: 10.1074/mcp.O111.011379
|
| [21] | M. Folk, G. Heber, Q. Koziol, E. Pourmal, D. Robinson, An overview of the HDF5 technology suite and its applications, in Proceedings of the EDBT/ICDT 2011 Workshop on Array Databases, (2011), 36–47. https://doi.org/10.1145/1966895.1966900 |
| [22] |
J. Teleman, A. W. Dowsey, F. F. Gonzalez-Galarza, S. Perkins, B. Pratt, H. L. Röst, et al., Numerical compression schemes for proteomics mass spectrometry data, Mol. Cell. Proteomics, 13 (2014), 1537–1542. https://doi.org/10.1074/mcp.O114.037879 doi: 10.1074/mcp.O114.037879
|
| [23] |
D. Bouyssié, M. Dubois, S. Nasso, A. G. de Peredo, O. Burlet-Schiltz, R. Aebersold, et al., MzDB: A file format using multiple indexing strategies for the efficient analysis of large LC-MS/MS and SWATH-MS data sets, Mol. Cell. Proteomics, 14 (2015), 771–781. https://doi.org/10.1074/mcp.O114.039115 doi: 10.1074/mcp.O114.039115
|
| [24] | T. Bhosale, T. Patil, P. Patil, SQLite: Light Database System, in Int. J. Comput. Sci. Mob. Comput., 44 (2015), 882–885. |
| [25] |
R. Yang, X. Chen, I. Ochoa, MassComp, a lossless compressor for mass spectrometry data, BMC Bioinformatics, 20 (2019). https://doi.org/10.1186/s12859-019-2962-7 doi: 10.1186/s12859-019-2962-7
|
| [26] |
B. Tully, Toffee–a highly efficient, lossless file format for DIA-MS, Sci. Rep., 10 (2020). https://doi.org/10.1038/s41598-020-65015-y doi: 10.1038/s41598-020-65015-y
|
| [27] |
R. S. Bhamber, A. Jankevics, E. W. Deutsch, A. R. Jones, A. W. Dowsey, MzMLb: A future-proof raw mass spectrometry data format based on standards-compliant mzML and optimized for speed and storage requirements, J. Proteome Res., 20 (2021), 172–183. https://doi.org/10.1021/acs.jproteome.0c00192 doi: 10.1021/acs.jproteome.0c00192
|
| [28] |
F. Hanau, H. Röst, I. Ochoa, mspack: efficient lossless and lossy mass spectrometry data compression, Bioinformatics, 37 (2021), 3923–3925. https://doi.org/10.1093/bioinformatics/btab636 doi: 10.1093/bioinformatics/btab636
|
| [29] |
M. Lu, S. An, R. Wang, J. Wang, C. Yu, Aird: a computation-oriented mass spectrometry data format enables a higher compression ratio and less decoding time, BMC Bioinformatics, 23 (2022). https://doi.org/10.1186/s12859-021-04490-0 doi: 10.1186/s12859-021-04490-0
|
| [30] |
J. Wang, M. Lu, R. Wang, S. An, C. Xie, C. Yu, StackZDPD: A novel encoding scheme for mass spectrometry data optimized for speed and compression ratio, BMC Bioinformatics, 12 (2022), 5384. https://doi.org/10.1038/s41598-022-09432-1 doi: 10.1038/s41598-022-09432-1
|
| [31] |
M. Lu, J. Tong, R. Wang, S. An, J. Wang, C. Yu, Aird-ComboComp: A combinable compressor framework with a dynamic-decider for lossy mass spectrometry data compression, bioRxiv, 2023 (2023). https://doi.org/10.1101/2023.05.04.539411 doi: 10.1101/2023.05.04.539411
|
| [32] |
R. Schmid, S. Heuckeroth, A. Korf, A. Smirnov, O. Myers, T. S. Dyrlund, et al., Integrative analysis of multimodal mass spectrometry data in MZmine 3, Nat. Biotechnol., 41 (2023), 447–449. https://doi.org/10.1038/S41587-023-01690-2 doi: 10.1038/S41587-023-01690-2
|
| [33] |
D. Lemire, L. Boytsov, N. Kurz, SIMD compression and the intersection of sorted integers, Software Pract. Exper., 46 (2016), 723–749. https://doi.org/10.1002/spe.2326 doi: 10.1002/spe.2326
|
| [34] | Google, Zstd, 1.5.2, (2022). Available from: https://github.com/facebook/zstd |
| [35] | Google, snappy, 1.1.9, (2022). Available from: https://github.com/google/snappy |
| [36] |
J. Alakuijala, A. Farruggia, P. Ferragina, E. Kliuchnikov, R. Obryk, Z. Szabadka, et al., Brotli: A general-purpose data compressor, ACM Trans. Inf. Syst., 37 (2018), 1–30. https://doi.org/10.1145/3231935 doi: 10.1145/3231935
|
| [37] |
J. Tong, M. Lu, B. Peng, S. An, J. Wang, C. Yu, How much storage precision can be lost: Guidance for near-lossless compression of untargeted metabolomics mass spectrometry data, bioRxiv, (2023). https://doi.org/10.1101/2023.03.14.532504 doi: 10.1101/2023.03.14.532504
|
| [38] | R. Adusumilli, P. Mallick, Data conversion with proteoWizard msConvert, in Methods in Molecular Biology, Humana Press, (2017), 339–368. https://doi.org/10.1007/978-1-4939-6747-6_23 |


Figures(10) / Tables(2)

Miaoshan Lu, Junjie Tong, Weidong Fang, Jinyin Wang, Shaowei An, Ruimin Wang, Hengxuan Jiang, Changbin Yu. Column storage enables edge computation of biological big data on 5G networks[J]. Mathematical Biosciences and Engineering, 2023, 20(9): 17197-17219. doi: 10.3934/mbe.2023766


 DownLoad: