In this paper, we propose a multi-patch SVEIR epidemic model that incorporates vaccination of both newborns and susceptible populations. We determine the basic reproduction number $ R_{0} $ and prove that the disease-free equilibrium $ P_{0} $ is locally and globally asymptotically stable if $ R_{0} < 1, $ and it is unstable if $ R_{0} > 1. $ Moreover, we show that the disease is uniformly persistent in the population when $ R_{0} > 1. $ Numerical simulations indicate that vaccination strategies can effectively control disease spread in all patches while population migration can either intensify or prevent disease transmission within a patch.
Citation: Maoxing Liu, Yuhang Li. Dynamics analysis of an SVEIR epidemic model in a patchy environment[J]. Mathematical Biosciences and Engineering, 2023, 20(9): 16962-16977. doi: 10.3934/mbe.2023756
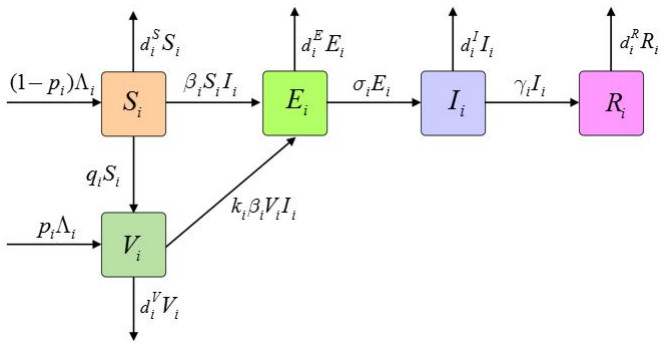
In this paper, we propose a multi-patch SVEIR epidemic model that incorporates vaccination of both newborns and susceptible populations. We determine the basic reproduction number $ R_{0} $ and prove that the disease-free equilibrium $ P_{0} $ is locally and globally asymptotically stable if $ R_{0} < 1, $ and it is unstable if $ R_{0} > 1. $ Moreover, we show that the disease is uniformly persistent in the population when $ R_{0} > 1. $ Numerical simulations indicate that vaccination strategies can effectively control disease spread in all patches while population migration can either intensify or prevent disease transmission within a patch.

| [1] |
A. L. Lloyd, R. M. May, Spatial heterogeneity in epidemic models, J. Theor. Biol., 179 (1996), 1–11. https://doi.org/10.1006/jtbi.1996.0042 doi: 10.1006/jtbi.1996.0042

|
| [2] |
D. J. Rodríguez, L. Torres-Sorando, Models of infectious diseases in spatially heterogeneous environments, Bull. Math. Biol., 63 (2001), 547–571. https://doi.org/10.1006/bulm.2001.0231 doi: 10.1006/bulm.2001.0231
|
| [3] |
J. Arino, J. R. Davis, D. Hartley, R. Jordan, J. M. Miller, P. Van Den Driessche, A multi-species epidemic model with spatial dynamics, Math. Med. Biol., 22 (2005), 129–142. https://doi.org/10.1093/imammb/dqi003 doi: 10.1093/imammb/dqi003
|
| [4] |
W. Wang, G. Mulone, Threshold of disease transmission in a patch environment, J. Math. Anal. Appl., 285 (2003), 321–335. https://doi.org/10.1016/S0022-247X(03)00428-1 doi: 10.1016/S0022-247X(03)00428-1
|
| [5] |
C. Wolf, M. Langlais, F. Sauvage, D. Pontier, A multi-patch epidemic model with periodic demography, direct and indirect transmission and variable maturation rate, Math. Popul. Stud., 13 (2006), 153–177. https://doi.org/10.1080/08898480600788584 doi: 10.1080/08898480600788584
|
| [6] |
D. Gao, S. Ruan, A multipatch malaria model with logistic growth populations, SIAM J. Appl. Math., 72 (2012), 819–841. https://doi.org/10.1137/110850761 doi: 10.1137/110850761
|
| [7] |
Q. Liu, D. Jiang, Global dynamical behavior of a multigroup SVIR epidemic model with Markovian switching, Int. J. Biomath., 15 (2022), 2150080. https://doi.org/10.1142/S1793524521500807 doi: 10.1142/S1793524521500807
|
| [8] |
Z. Qiu, Q. Kong, X. Li, M. Martcheva, The vector–host epidemic model with multiple strains in a patchy environment, J. Math. Anal. Appl., 405 (2013), 12–36. https://doi.org/10.1016/j.jmaa.2013.03.042 doi: 10.1016/j.jmaa.2013.03.042
|
| [9] | Y. Chen, M. Yan, Z. Xiang, Transmission dynamics of a two-city SIR epidemic model with transport-related infections, J. Appl. Math., 2014 (2014). https://doi.org/10.1155/2014/764278 |
| [10] |
H. L. Li, L. Zhang, Z. Teng, Y. L. Jiang, A. Muhammadhaji, Global stability of an SI epidemic model with feedback controls in a patchy environment, Appl. Math. Comput., 321 (2018), 372–384. https://doi.org/10.1016/j.amc.2017.10.057 doi: 10.1016/j.amc.2017.10.057
|
| [11] |
V. P. Bajiya, J. P. Tripathi, V. Kakkar, Y. Kang, Modeling the impacts of awareness and limited medical resources on the epidemic size of a multi-group SIR epidemic model, Int. J. Biomath., 15 (2022), 2250045. https://doi.org/10.1142/S1793524522500450 doi: 10.1142/S1793524522500450
|
| [12] |
H. W. Hethcote, Qualitative analyses of communicable disease models, Math. Biosci., 28 (1976), 335–356. https://doi.org/10.1016/0025-5564(76)90132-2 doi: 10.1016/0025-5564(76)90132-2
|
| [13] |
S. Ruan, W. Wang, S. A. Levin, The effect of global travel on the spread of SARS, Math. Biosci. Eng., 3 (2006), 205. https://doi.org/10.3934/mbe.2006.3.205 doi: 10.3934/mbe.2006.3.205
|
| [14] |
W. Wang, X. Q. Zhao, An epidemic model in a patchy environment, Math. Biosci., 190 (2004), 97–112. https://doi.org/10.1016/j.mbs.2002.11.001 doi: 10.1016/j.mbs.2002.11.001
|
| [15] |
M. Salmani, P. van den Driessche, A model for disease transmission in a patchy environment, Discrete Contin. Dyn. Syst. Ser. B., 6 (2006), 185–202. https://doi.org/10.3934/dcdsb.2006.6.185 doi: 10.3934/dcdsb.2006.6.185
|
| [16] |
M. Y. Li, Z. Shuai, Global stability of an epidemic model in a patchy environment, Canad. Appl. Math. Q., 17 (2009), 175–187. https://doi.org/10.1016/j.amc.2017.10.057 doi: 10.1016/j.amc.2017.10.057
|
| [17] |
D. Gao, Travel frequency and infectious diseases, SIAM J. Appl. Math., 79 (2019), 1581–1606. https://doi.org/10.1137/18M1211957 doi: 10.1137/18M1211957
|
| [18] |
X. Wang, S. Liu, L. Wang, W. Zhang, An epidemic patchy model with entry–exit screening, Bull. Math. Biol., 77 (2015), 1237–1255. https://doi.org/10.1007/s11538-015-0084-6 doi: 10.1007/s11538-015-0084-6
|
| [19] |
M. El Hajji, A. H. Albargi, A mathematical investigation of an "SVEIR" epidemic model for the measles transmission, Math. Biosci. Eng., 19 (2022), 2853–2875. https://doi.org/10.3934/mbe.2022131 doi: 10.3934/mbe.2022131
|
| [20] |
Z. Wang, Q. Zhang, Optimal vaccination strategy for a mean-field stochastic susceptible-infected-vaccinated system, Int. J. Biomath., 16 (2023), 2250061. https://doi.org/10.1142/S1793524522500619 doi: 10.1142/S1793524522500619
|
| [21] |
X. Liu, Y. Takeuchi, S. Iwami, SVIR epidemic models with vaccination strategies, J. Theor. Biol., 253 (2008), 1–11. https://doi.org/10.1016/j.jtbi.2007.10.014 doi: 10.1016/j.jtbi.2007.10.014
|
| [22] |
J. Li, Y. Yang, SIR-SVS epidemic models with continuous and impulsive vaccination strategies, J. Theor. Biol., 280 (2011), 108–116. https://doi.org/10.1016/j.jtbi.2011.03.013 doi: 10.1016/j.jtbi.2011.03.013
|
| [23] |
X. Duan, S. Yuan, Z. Qiu, J. Ma, Global stability of an SVEIR epidemic model with ages of vaccination and latency, Comput. Math. Appl., 68 (2014), 288–308. https://doi.org/10.1016/j.camwa.2014.06.002 doi: 10.1016/j.camwa.2014.06.002
|
| [24] |
L. M. Cai, Z. Li, X. Song, Global analysis of an epidemic model with vaccination, J. Appl. Math. Comput., 57 (2018), 605–628. https://doi.org/10.1007/s12190-017-1124-1 doi: 10.1007/s12190-017-1124-1
|
| [25] |
Q. Cui, Z. Qiu, L. Ding, An SIR epidemic model with vaccination in a patchy environment, Math. Biosci. Eng., 14 (2017), 1141–1157. https://doi.org/10.3934/mbe.2017059 doi: 10.3934/mbe.2017059
|
| [26] |
M. De la Sen, A. Ibeas, S. Alonso-Quesada, R. Nistal, On a SIR model in a patchy environment under constant and feedback decentralized controls with asymmetric parameterizations, Symmetry, 11 (2019), 430. https://doi.org/10.3390/sym11030430 doi: 10.3390/sym11030430
|
| [27] | M. De la Sen, A. Ibeas, S. Alonso-Quesada, R. Nistal, Infectious diseases of humans: dynamics and control, Oxford University Press, 1991. https://doi.org/10.1016/0169-5347(91)90048-3 |
| [28] |
L. Zhang, Z. C. Wang, X. Q. Zhao, Threshold dynamics of a time periodic reaction–diffusion epidemic model with latent period, J. Differ. Equ., 258 (2015), 3011–3036. https://doi.org/10.1016/j.jde.2014.12.032 doi: 10.1016/j.jde.2014.12.032
|
| [29] |
Y. Lou, X. Q. Zhao, A reaction–diffusion malaria model with incubation period in the vector population, J. Math. Biol., 62 (2011), 543–568. https://doi.org/10.1007/s00285-010-0346-8 doi: 10.1007/s00285-010-0346-8
|
| [30] |
X. F. San, Z. C. Wang, Traveling waves for a two-group epidemic model with latent period in a patchy environment, J. Math. Anal. Appl., 475 (2019), 1502–1531. https://doi.org/10.1016/j.jmaa.2019.03.029 doi: 10.1016/j.jmaa.2019.03.029
|
| [31] |
J. Li, X. Zou, Dynamics of an epidemic model with non-local infections for diseases with latency over a patchy environment, J. Math. Biol., 60 (2010), 645–686. https://doi.org/10.1007/s00285-009-0280-9 doi: 10.1007/s00285-009-0280-9
|
| [32] | A. Berman, R. J. Plemmons, Nonnegative Matrices in the Mathematical Sciences, Academic Press, New York, 1979. https://doi.org/10.1016/C2013-0-10361-3 |
| [33] |
P. van den Driessche, J. Watmough, Reproduction numbers and sub-threshold endemic equilibria for compartmental models of disease transmission, Math. Biosci., 180 (2002), 29–48. https://doi.org/10.1016/S0025-5564(02)00108-6 doi: 10.1016/S0025-5564(02)00108-6
|
| [34] | J. P. LaSalle, The Stability of Dynamical Systems, SIAM, 1976. https://doi.org/10.1137/1.9781611970432 |
| [35] | X. Q. Zhao, Uniform persistence and periodic coexistence states in infinite-dimensional periodic semiflows with applications, Canad. Appl. Math. Q., 3 (1995), 473–495. |
| [36] |
H. R. Thieme, Persistence under relaxed point-dissipativity (with application to an endemic model), SIAM J. Math. Anal., 24 (1993), 407–435. https://doi.org/10.1137/0524026 doi: 10.1137/0524026
|


Figures(6) / Tables(2)

Maoxing Liu, Yuhang Li. Dynamics analysis of an SVEIR epidemic model in a patchy environment[J]. Mathematical Biosciences and Engineering, 2023, 20(9): 16962-16977. doi: 10.3934/mbe.2023756


 DownLoad: