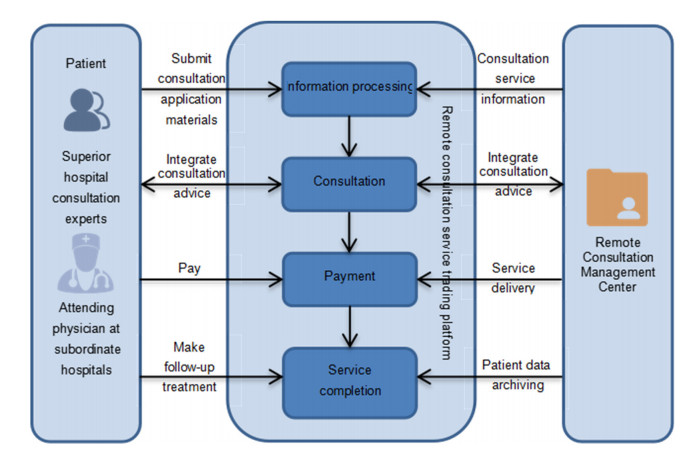
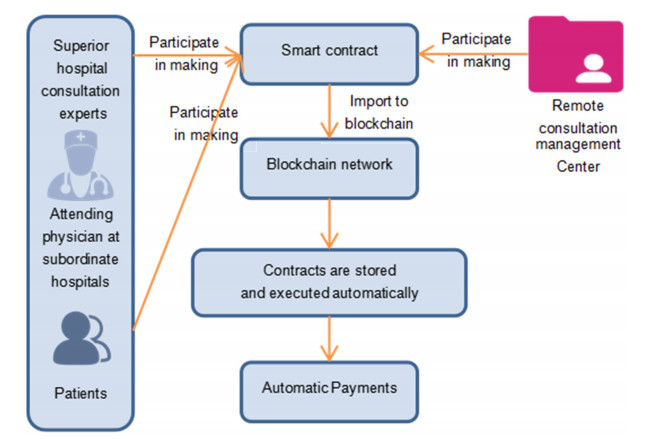
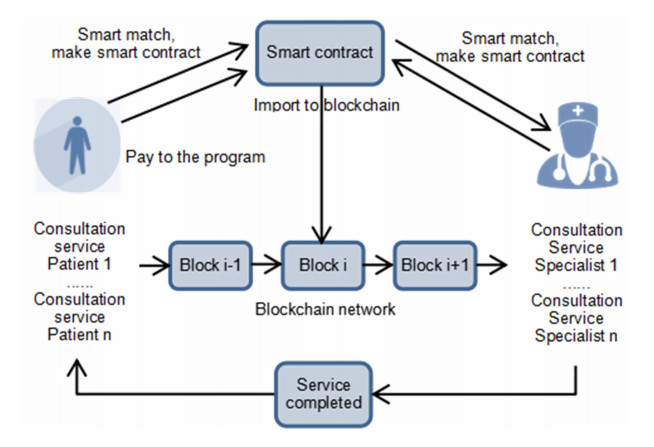
To guide the more reasonable and fair allocation of medical resources, to solve the problem of fee prices negotiated by various subjects in the medical and health system and patient payment, and to solve the problem of how to ensure the privacy, accuracy, consistency and traceability of data in the process of collecting patient information in each hospital, according to the operation process of a remote consultation service, a decentralized remote intelligent consultation blockchain model is proposed. The model uses the improved ant colony algorithm under a smart contract and studies the practicality of the improved ant colony algorithm on the multi-node remote consultation service simulation platform. According to the experimental analysis results, the improved ant colony algorithm can automatically execute and effectively match the target population under the smart contract.
Citation: Xiang Gao, Yipeng Zhang. Advancing remote consultation through the integration of blockchain and ant colony algorithm[J]. Mathematical Biosciences and Engineering, 2023, 20(9): 16886-16912. doi: 10.3934/mbe.2023753
To guide the more reasonable and fair allocation of medical resources, to solve the problem of fee prices negotiated by various subjects in the medical and health system and patient payment, and to solve the problem of how to ensure the privacy, accuracy, consistency and traceability of data in the process of collecting patient information in each hospital, according to the operation process of a remote consultation service, a decentralized remote intelligent consultation blockchain model is proposed. The model uses the improved ant colony algorithm under a smart contract and studies the practicality of the improved ant colony algorithm on the multi-node remote consultation service simulation platform. According to the experimental analysis results, the improved ant colony algorithm can automatically execute and effectively match the target population under the smart contract.

| [1] | A. D. Dwivedi, R. Singh, S. Dhall, G. Srivastava, S. K. Pal, Tracing the source of fake news using a scalable blockchain distributed network, in 2020 IEEE 17th International Conference on Mobile Ad Hoc and Sensor Systems (MASS), (2020), 38–43. https://doi.org/10.1109/MASS50613.2020.00015 |
| [2] | G. Srivastava, J. Crichigno, S. Dhar, A light and secure healthcare blockchain for IoT medical devices, in 2019 IEEE Canadian Conference of Electrical and Computer Engineering (CCECE), 1–5. https://doi.org/10.1109/CCECE.2019.8861593 |
| [3] |
Z. Chen, Z. Jin, J. Liu, Research and application of remote consultation support system based on the information exchange platform, China Digital Med., 9 (2014), 88–90. https://doi.org/10.3969/j.issn.1673-7571.2014.03.026 doi: 10.3969/j.issn.1673-7571.2014.03.026

|
| [4] |
L. Wang, Thoughts on how telemedicine can promote regional medical informatization construction, Chongqing Med., 40 (2011), 3574–3575. https://doi.org/10.3969/j.issn.1671-8348.2011.35.018 doi: 10.3969/j.issn.1671-8348.2011.35.018
|
| [5] |
A. I. Hernández, F. Mora, M. Villegas, G. Passariello, G. Carrault, Real-time ECG transmission via the Internet for nonclinical applications, IEEE Tran. Inf. Technol. Biomed., 5 (2001), 253–257. https://doi.org/10.1109/4233.945297 doi: 10.1109/4233.945297
|
| [6] |
J. Guo, Y. Bao, M. Jing, Building of multipath remote consultation platform based on medical alliance, J. Med. Intell., 39 (2018), 22–25. https://doi.org/10.3969/j.issn.1673-6036.2018.01.005 doi: 10.3969/j.issn.1673-6036.2018.01.005
|
| [7] |
K. Fan, S. Wang, Y. Ren, H. Li, Y. Yang, MedBlock: efficient and secure medical data sharing via blockchain, J. Med. Syst., 42 (2018), 1–11. https://doi.org/10.1007/s10916-018-0993-7 doi: 10.1007/s10916-018-0993-7
|
| [8] | J. Liu, X. Li, L. Ye, H. Zhang, X. Du, M. Guizani, BPDS: a blockchain-based privacy-preserving data sharing for electronic medical records, in 2018 IEEE Global Communications Conference (GLOBECOM), (2018), 1–6. https://doi.org/10.1109/glocom.2018.8647713 |
| [9] |
J. Zhang, Q. Xia, Y. Zhao, Research on electronic medical record data storage system based on blockchain technology, China Med. Devices, 36 (2021), 106–109. https://doi.org/10.3969/j.issn.1674-1633.2021.07.024 doi: 10.3969/j.issn.1674-1633.2021.07.024
|
| [10] |
K. N. Griggs, O. Ossipova, C. P. Kohlios, A. N. Baccarini, E. A. Howson, T. Hayajneh. Healthcare blockchain system using smart contracts for secure automated remote patient monitoring, J. Med. Syst., 42 (2018), 1–7. https://doi.org/10.1007/s10916-018-0982-x doi: 10.1007/s10916-018-0982-x
|
| [11] | Z. Shae, J. J. P. Tsai, On the design of a blockchain platform for clinical trial and precision medicine, in 2017 IEEE 37th International Conference on Distributed Computing Systems (ICDCS), (2017), 1972–1980. https://doi.org/10.1109/ICDCS.2017.61 |
| [12] |
K. Christidis, M. M. Devetsikiotis, Blockchains and smart contracts for the internet of things, IEEE Access, 4 (2016), 2292–2303. https://doi.org/10.1109/access.2016.2566339 doi: 10.1109/access.2016.2566339
|
| [13] |
J. Moosavi, L.M. Naeni, A. M. Fathollahi-Fard, U. Fiore, Blockchain in supply chain management: A review, bibliometric, and network analysis, Environ. Sci. Pollut. Res., (2021), 1–15. https://doi.org/10.1007/s11356-021-13094-3 doi: 10.1007/s11356-021-13094-3
|
| [14] |
K. S. Alshudukhi, M. A. Khemakhem, F. E. Eassa, K. M. Jambi, An interoperable blockchain security frameworks based on microservices and smart contract in IoT environment, Electronics, 12 (2023), 776. https://doi.org/10.3390/electronics12030776 doi: 10.3390/electronics12030776
|
| [15] |
J. Liao, J. Yang, W. Zhu, L. Cai, L. Han, H. Wang, Design and application of telemedicine consultation system, Pract. J. Clin. Med., 8 (2011), 206–208. https://doi.org/10.3969/j.issn.1672-6170.2011.06.078 doi: 10.3969/j.issn.1672-6170.2011.06.078
|
| [16] |
Y. Zhou, H. Lin, Q. Geng, Y. Zhang, Constitution and new development of remote medical system, China Digital Med., 4 (2009), 21–23. https://doi.org/10.3969/j.issn.1673-7571.2009.09.005 doi: 10.3969/j.issn.1673-7571.2009.09.005
|
| [17] |
Y. Chen, X. Zhang, X. Zou, Q. Ye, L. Nie, Y. Chen, et al., Effect of telemedicine on improving medical service capacity in the county, Chin. J. Hosp. Adm., 30 (2014), 408–410. https://doi.org/10.3760/cma.j.issn.1000-6672.2014.06.003 doi: 10.3760/cma.j.issn.1000-6672.2014.06.003
|
| [18] |
Y. Mao, L. Zhang, Optimization of the medical service consultation system based on the artificial intelligence of the internet of things, IEEE Access, 9 (2021), 98261–98274. https://doi.org/10.1109/access.2021.3096188 doi: 10.1109/access.2021.3096188
|
| [19] |
Y. Bachrach, R. Everett, E. Hughes, A. Lazaridou, J. Z. Leibo, M. Lanctot, et al., Negotiating team formation using deep reinforcement learning, Artif. Intell., 288 (2020), 103356. https://doi.org/10.1016/j.artint.2020.103356 doi: 10.1016/j.artint.2020.103356
|
| [20] |
P. Bharti, R. Ranjan, B. Prasad, Broker-based optimization of SLA negotiations in cloud computing, Multiagent Grid Syst., 17 (2021), 179–195. https://doi.org/10.3233/MGS-210349 doi: 10.3233/MGS-210349
|
| [21] |
C. Roy, S. Misra, J. Maiti, U. Chakravarty, Safe-serv: Energy-efficient decision delivery for provisioning safety-as-a-service, IEEE Trans. Serv. Comput., 15 (2020), 1954–1966. https://doi.org/10.1109/TSC.2020.3026135 doi: 10.1109/TSC.2020.3026135
|
| [22] |
M. Bai, X. Wang, J. Xin, G. Wang, An efficient algorithm for distributed density-based outlier detection on big data, Neurocomputing, 181 (2016), 19–28. https://doi.org/10.1016/j.neucom.2015.05.135 doi: 10.1016/j.neucom.2015.05.135
|
| [23] | N. Atzei, M. Bartoletti, T. Cimoli, A survey of attacks on Ethereum smart contracts (sok), in International Conference on Principles of Security and Trust, 10204 (2017), 164–186. https://doi.org/10.1007/978-3-662-54455-6_8 |
| [24] |
L. Wang, M. Li, Z Liu, Application of an ant colony optimization based on attractive field in TSP, J. Jiangsu Univ. Nat. Sci. Ed., 36 (2015), 573–577. https://doi.org/10.3969/j.issn.1671-7775.2015.05.014 doi: 10.3969/j.issn.1671-7775.2015.05.014
|
| [25] | Z. Zhou, J. Yang, L. Ma, A hybrid bacteria foraging algorithm for solving the traveling salesman problem, Math. Pract. Theory, 45 (2015), 159–165. |
| [26] |
K. Zhou, X. Qiang, X. Tong, J. Xu, Algorithm of TSP, Comput. Eng. Appl., 43 (2007), 43–47. https://doi.org/10.3321/j.issn:1002-8331.2007.29.013 doi: 10.3321/j.issn:1002-8331.2007.29.013
|
| [27] |
M. Mojtahedi, A. M. Fathollahi-Fard, R. Tavakkoli-Moghaddam, S. Newton, Sustainable vehicle routing problem for coordinated solid waste management. J. Ind. Inf. Integr., 23 (2021), 100220. https://doi.org/10.1016/j.jii.2021.100220 doi: 10.1016/j.jii.2021.100220
|
| [28] |
L. Zhang, T. Fei, T. Liu, J. Zhang, Application in medical device emergency logistics distribution routing optimization based on chaos ant colony optimization, J. Civ. Aviat. Univ. China, 29 (2011), 61–64. https://doi.org/10.3969/j.issn.1001-5590.2011.03.015 doi: 10.3969/j.issn.1001-5590.2011.03.015
|
| [29] |
L. Zhang, Y. Wang, T. Fei, X. Zhou, Research on low carbon logistics routing optimization based on chaotic-simulated annealing ant colony algorithm, Comput. Eng. Appl., 53 (2017), 63–68. https://doi.org/10.3778/j.issn.1002-8331.1503-0167 doi: 10.3778/j.issn.1002-8331.1503-0167
|
| [30] |
Y. Liu, B. Cao, A novel ant colony optimization algorithm with Levy flight, IEEE Access, 8 (2020) 67205–67213. https://doi.org/10.1109/ACCESS.2020.2985498 doi: 10.1109/ACCESS.2020.2985498
|
| [31] | Z. Ye, Z. Zheng, Configuration of parameters α, β, ρ in ant algorithm, Geomatics Inf. Sci. Wuhan Univ., (2004), 597–601. |
| [32] | T. Fei, L. Zhang, Y. Bai, L. Chen, Improved artificial fish swarm algorithm based on DNA, J. Tianjin Univ. Sci. Technol., 49 (2016), 581–588. |
| [33] | J. Kennedy, R. Eberhart, Particle swarm optimization, in Proceedings of ICNN'95-International Conference on Neural Networks, (1995), 1942–1948. |
| [34] | S. Li, W. Li, H. Shun, Z. Lin, Artificial fish swarm parallel algorithm based on multi-core cluster, J. Comput. Appl., 33, (2013), 3380–3384. |
Figures(11) / Tables(12)

Xiang Gao, Yipeng Zhang. Advancing remote consultation through the integration of blockchain and ant colony algorithm[J]. Mathematical Biosciences and Engineering, 2023, 20(9): 16886-16912. doi: 10.3934/mbe.2023753


 DownLoad: