Anti-angiogenesis as a treatment strategy for normalizing the microvascular network of tumors is of great interest among researchers, especially in combination with chemotherapy or radiotherapy. According to the vital role that angiogenesis plays in tumor growth and in exposing the tumor to therapeutic agents, this work develops a mathematical framework to study the influence of angiostatin, a plasminogen fragment that shows the anti-angiogenic function, in the evolutionary behavior of tumor-induced angiogenesis. Angiostatin-induced microvascular network reformation is investigated in a two-dimensional space by considering two parent vessels around a circular tumor by a modified discrete angiogenesis model in different tumor sizes. The effects of imposing modifications on the existing model, i.e., the matrix-degrading enzyme effect, proliferation and death of endothelial cells, matrix density function, and a more realistic chemotactic function, are investigated in this study. Results show a decrease in microvascular density in response to the angiostatin. A functional relationship exists between angiostatin's ability to normalize the capillary network and tumor size or progression stage, such that capillary density decreases by 55%, 41%, 24%, and 13% in tumors with a non-dimensional radius of 0.4, 0.3, 0.2, and 0.1, respectively, after angiostatin administration.
Citation: Mahya Mohammadi, M. Soltani, Cyrus Aghanajafi, Mohammad Kohandel. Investigation of the evolution of tumor-induced microvascular network under the inhibitory effect of anti-angiogenic factor, angiostatin: A mathematical study[J]. Mathematical Biosciences and Engineering, 2023, 20(3): 5448-5480. doi: 10.3934/mbe.2023252
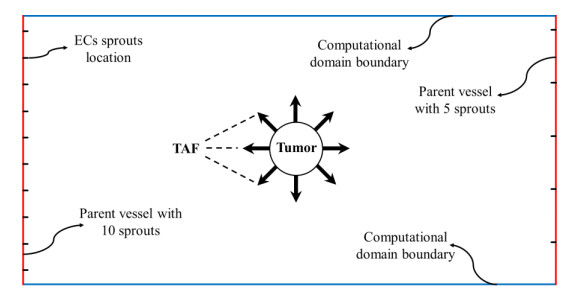
Anti-angiogenesis as a treatment strategy for normalizing the microvascular network of tumors is of great interest among researchers, especially in combination with chemotherapy or radiotherapy. According to the vital role that angiogenesis plays in tumor growth and in exposing the tumor to therapeutic agents, this work develops a mathematical framework to study the influence of angiostatin, a plasminogen fragment that shows the anti-angiogenic function, in the evolutionary behavior of tumor-induced angiogenesis. Angiostatin-induced microvascular network reformation is investigated in a two-dimensional space by considering two parent vessels around a circular tumor by a modified discrete angiogenesis model in different tumor sizes. The effects of imposing modifications on the existing model, i.e., the matrix-degrading enzyme effect, proliferation and death of endothelial cells, matrix density function, and a more realistic chemotactic function, are investigated in this study. Results show a decrease in microvascular density in response to the angiostatin. A functional relationship exists between angiostatin's ability to normalize the capillary network and tumor size or progression stage, such that capillary density decreases by 55%, 41%, 24%, and 13% in tumors with a non-dimensional radius of 0.4, 0.3, 0.2, and 0.1, respectively, after angiostatin administration.

| [1] |
F. M. Kashkooli, M. Soltani, M. Rezaeian, E. Taatizadeh, M. H. Hamedi, Image-based spatio-temporal model of drug delivery in a heterogeneous vasculature of a solid tumor-computational approach, Microvasc. Res., 123 (2019), 111–124. https://doi.org/10.1016/j.mvr.2019.01.005 doi: 10.1016/j.mvr.2019.01.005

|
| [2] |
M. Soltani, M. Jabarifar, F. M. Kashkooli, A. Rahmim, Evaluation of inverse methods for estimation of mechanical parameters in solid tumors, Biomed. Phys. Eng. Express, 6 (2020), 035027. https://doi.org/10.1088/2057-1976/ab872b doi: 10.1088/2057-1976/ab872b
|
| [3] |
R. K. Jain, Normalization of tumor vasculature: An emerging concept in antiangiogenic therapy, Science, 307 (2005), 58–62. https://doi.org/10.1126/science.1104819 doi: 10.1126/science.1104819
|
| [4] |
J. Folkman, Tumor angiogenesis: Therapeutic implications, N. Engl. J. Med., 285 (1971), 1182–1186. https://doi.org/10.1056/NEJM197111182852108 doi: 10.1056/NEJM197111182852108
|
| [5] | J. W. Baish, R. K. Jain, Fractals and cancer, Cancer Res., 60 (2000), 3683–3688. Retrieved from https://aacrjournals.org/cancerres |
| [6] |
F. M. Kashkooli, M. Soltani, Evaluation of solid tumor response to sequential treatment cycles via a new computational hybrid approach, Sci. Rep., 11 (2021), 21475. https://doi.org/10.1038/s41598-021-00989-x doi: 10.1038/s41598-021-00989-x
|
| [7] |
F. M. Kashkooli, M. Soltani, M. M. Momeni, A. Rahmim, Enhanced drug delivery to solid tumors via drug-loaded nanocarriers: An image-based computational framework, Front. Oncol., 11 (2021), 655781. https://doi.org/10.3389/fonc.2021.655781 doi: 10.3389/fonc.2021.655781
|
| [8] |
D. Fukumura, R. K. Jain, Tumor microvasculature and microenvironment: Targets for anti-angiogenesis and normalization, Microvasc. Res., 74 (2007), 72–84. https://doi.org/10.1016/j.mvr.2007.05.003 doi: 10.1016/j.mvr.2007.05.003
|
| [9] |
K. Eriksson, P. Magnusson, J. Dixelius, L. Claesson-Welsh, M. J. Cross, Angiostatin and endostatin inhibit endothelial cell migration in response to FGF and VEGF without interfering with specific intracellular signal transduction pathways, FEBS Lett., 536 (2003), 19–24. https://doi.org/10.1016/S0014-5793(03)00003-6 doi: 10.1016/S0014-5793(03)00003-6
|
| [10] |
C. O. Madu, S. Wang, C. O. Madu, Y. Lu, Angiogenesis in breast cancer progression, diagnosis, and treatment, J. Cancer, 11 (2020), 4474–4494. https://doi.org/10.7150/jca.44313 doi: 10.7150/jca.44313
|
| [11] |
M. K. Oehler, R. Bicknell, The promise of anti-angiogenic cancer therapy, Br. J. Cancer, 82 (2000), 749–752. https://doi.org/10.1054/bjoc.1999.0991 doi: 10.1054/bjoc.1999.0991
|
| [12] |
M. S. O'Reilly, L. Holmgren, Y. Shing, C. Chen, R. A. Rosenthal, M. Moses, et al., Angiostatin: A novel angiogenesis inhibitor that mediates the suppression of metastases by a Lewis lung carcinoma, Cell, 79 (1994), 315–328. https://doi.org/10.1016/0092-8674(94)90200-3 doi: 10.1016/0092-8674(94)90200-3
|
| [13] |
K. Hiramoto, Y. Yamate, Tranexamic acid reduces endometrial cancer effects through the production of angiostatin, J. Cancer, 13 (2022), 1603–1610. https://doi.org/10.7150/jca.68169 doi: 10.7150/jca.68169
|
| [14] |
F. Peng, Z. Xu, J. Wang, Y. Chen, Q. Li, Y. Zuo, et al., Recombinant human endostatin normalizes tumor vasculature and enhances radiation response in xenografted human nasopharyngeal carcinoma models, PLoS One., 7 (2012), e34646. https://doi.org/10.1371/journal.pone.0034646 doi: 10.1371/journal.pone.0034646
|
| [15] | T. H. Adair, J. -P. Montani, Angiogenesis, Morgan and Claypool Life Sciences, San Rafael, CA, 2010. https: //doi.org/10.4199/C00017ED1V01Y201009ISP010 |
| [16] | M. Soltani, Numerical Modeling of Drug Delivery to Solid Tumor Microvasculature, Ph.D. thesis, University of Waterloo, 2013. Retrieved from https: //uwspace.uwaterloo.ca |
| [17] | S. Laranjeira, R. Coy, R. J. Shipley, Mathematical Modeling for Nerve Repair Research, in: J. B. Phillips, D. Hercher, T. Hausner (Eds.) Peripheral Nerve Tissue Engineering and Regeneration Springer, Cham, (2022), 189–241. https: //doi.org/10.1007/978-3-030-21052-6_10 |
| [18] |
H. A. Harrington, M. Maier, L. Naidoo, N. Whitaker, P. G. Kevrekidis, A hybrid model for tumor-induced angiogenesis in the cornea in the presence of inhibitors, Math. Comput. Model., 46 (2007), 513–524. https://doi.org/10.1016/j.mcm.2006.11.034 doi: 10.1016/j.mcm.2006.11.034
|
| [19] |
A. R. A. Anderson, M. A. J. Chaplain, Continuous and discrete mathematical models of tumor-induced angiogenesis, Bull. Math. Biol., 60 (1998), 857–899. https://doi.org/10.1006/bulm.1998.0042 doi: 10.1006/bulm.1998.0042
|
| [20] | A. R. A. Anderson, M. A. J. Chaplain, S. R. McDougall, A Hybrid Discrete-Continuum Model of Tumour Induced Angiogenesis, in: T. L. Jackson (Ed.) Modeling Tumor Vasculature, Springer, New York, NY, (2012), 105–133. https: //doi.org/10.1007/978-1-4614-0052-3_5 |
| [21] |
M. A. J. Chaplain, A. M. Stuart, A model mechanism for the chemotactic response of endothelial cells to tumour angiogenesis factor, Math. Med. Biol., 10 (1993), 149–168. https://doi.org/10.1093/imammb/10.3.149 doi: 10.1093/imammb/10.3.149
|
| [22] |
S. R. McDougall, A. R. A. Anderson, M. A. J. Chaplain, J. A. Sherratt, Mathematical modelling of flow through vascular networks: implications for tumour-induced angiogenesis and chemotherapy strategies, Bull. Math. Biol., 64 (2002), 673–702. https://doi.org/10.1006/bulm.2002.0293 doi: 10.1006/bulm.2002.0293
|
| [23] |
M. Soltani, P. Chen, Numerical modeling of interstitial fluid flow coupled with blood flow through a remodeled solid tumor microvascular network, PLoS One, 8 (2013), e67025. https://doi.org/10.1371/journal.pone.0067025 doi: 10.1371/journal.pone.0067025
|
| [24] |
M. Sefidgar, M. Soltani, K. Raahemifar, M. Sadeghi, H. Bazmara, M. Bazargan, et al., Numerical modeling of drug delivery in a dynamic solid tumor microvasculature, Microvasc. Res., 99 (2015), 43–56. https://doi.org/10.1016/j.mvr.2015.02.007 doi: 10.1016/j.mvr.2015.02.007
|
| [25] |
J. Lyu, J. Cao, P. Zhang, Y. Liu, H. Cheng, Coupled hybrid continuum-discrete model of tumor angiogenesis and growth, PLoS One, 11 (2016), e0163173. https://doi.org/10.1371/journal.pone.0163173 doi: 10.1371/journal.pone.0163173
|
| [26] |
J. Wu, Q. Long, S. Xu, A. R. Padhani, Study of tumor blood perfusion and its variation due to vascular normalization by anti-angiogenic therapy based on 3D angiogenic microvasculature, J. Biomech., 42 (2009), 712–721. https://doi.org/10.1016/j.jbiomech.2009.01.009 doi: 10.1016/j.jbiomech.2009.01.009
|
| [27] |
A. Stéphanou, S. R. McDougall, A. R. A. Anderson, M. A. J. Chaplain, Mathematical modelling of the influence of blood rheological properties upon adaptative tumour-induced angiogenesis, Math. Comput. Model., 44 (2006), 96–123. https://doi.org/10.1016/j.mcm.2004.07.021 doi: 10.1016/j.mcm.2004.07.021
|
| [28] |
S. R. McDougall, A. R. A. Anderson, M. A. J. Chaplain, Mathematical modelling of dynamic adaptive tumour-induced angiogenesis: clinical implications and therapeutic targeting strategies, J. Theor. Biol., 241 (2006), 564–589. https://doi.org/10.1016/j.jtbi.2005.12.022 doi: 10.1016/j.jtbi.2005.12.022
|
| [29] |
M. Soltani, Capillary network formation and structure in a modified discrete mathematical model of angiogenesis, Biomed. Phys. Eng. Express, 8 (2022), 015023. https://doi.org/10.1088/2057-1976/ac4175 doi: 10.1088/2057-1976/ac4175
|
| [30] |
J. Ciccolini, S. Benzekry, B. Lacarelle, F. Barlési, Improving efficacy of the combination between antiangiogenic and chemotherapy: time for mathematical modeling support, Proc. Natl. Acad. Sci., 112 (2015), E3453. https://doi.org/10.1073/pnas.1506689112 doi: 10.1073/pnas.1506689112
|
| [31] |
M. E. Orme, M. A. J. Chaplain, Two-dimensional models of tumour angiogenesis and anti-angiogenesis strategies, Math. Med. Biol., 14 (1997), 189–205. https://doi.org/10.1093/imammb/14.3.189 doi: 10.1093/imammb/14.3.189
|
| [32] |
A. Stéphanou, S. R. McDougall, A. R. A. Anderson, M. A. J. Chaplain, Mathematical modelling of flow in 2D and 3D vascular networks: applications to anti-angiogenic and chemotherapeutic drug strategies, Math. Comput. Model., 41 (2005), 1137–1156. https://doi.org/10.1016/j.mcm.2005.05.008 doi: 10.1016/j.mcm.2005.05.008
|
| [33] |
A. Moath, Y. X. Xiao, The influence of tumour vasculature on fluid flow in solid tumours: a mathematical modelling study, Biophys. Rep., 7 (2021), 35–54. https://doi.org/10.52601/bpr.2021.200041 doi: 10.52601/bpr.2021.200041
|
| [34] |
R. K. Jain, R. T. Tong, L. L. Munn, Effect of vascular normalization by antiangiogenic therapy on interstitial hypertension, peritumor edema, and lymphatic metastasis: Insights from a mathematical model, Cancer Res., 67 (2007), 2729–2735. https://doi.org/10.1158/0008-5472.CAN-06-4102 doi: 10.1158/0008-5472.CAN-06-4102
|
| [35] | M. Mohammadi, C. Aghanajafi, M. Soltani, Numerical Modelling of Drug Delivery in an Isolated Solid Tumor under the Influence of Vascular Normalization. In: D. M. Kilgour, H. Kunze, R. Makarov, R. Melnik, X. Wang (eds) Recent Developments in Mathematical, Statistical, and Computational Sciences in: AMMCS 2019, Springer Proceedings in Mathematics & Statistics, vol 343. Springer, Cham, (2021), 565–577. https: //doi.org/10.1007/978-3-030-63591-6_52 |
| [36] |
M. Mohammadi, C. Aghanajafi, M. Soltani, K. Raahemifar, Numerical investigation on the anti-angiogenic therapy-induced normalization in solid tumors, Pharmaceutics, 14 (2022), 363. https://doi.org/10.3390/pharmaceutics14020363 doi: 10.3390/pharmaceutics14020363
|
| [37] |
P. W. Sweeney, A. d'Esposito, S. Walker-Samuel, R. J. Shipley, Modelling the transport of fluid through heterogeneous, whole tumours in silico, PLoS Comput. Biol., 15 (2019), e1006751. https://doi.org/10.1371/journal.pcbi.1006751 doi: 10.1371/journal.pcbi.1006751
|
| [38] |
F. Moradi Kashkooli, M. Soltani, M. Rezaeian, C. Meaney, M. H. Hamedi, M. Kohandel, Effect of vascular normalization on drug delivery to different stages of tumor progression: In-silico analysis, J. Drug. Deliv. Sci. Technol., 60 (2020), 101989. https://doi.org/10.1016/j.jddst.2020.101989 doi: 10.1016/j.jddst.2020.101989
|
| [39] |
D. Tee, J. DiStefano Ⅲ, Simulation of tumor-induced angiogenesis and its response to anti-angiogenic drug treatment: Mode of drug delivery and clearance rate dependencies, J. Cancer Res. Clin. Oncol., 130 (2004), 15–24. https://doi.org/10.1007/s00432-003-0491-1 doi: 10.1007/s00432-003-0491-1
|
| [40] |
G. Zhao, W. Yan, E. Chen, X. Yu, W. Cai, Numerical simulation of the inhibitory effect of angiostatin on metastatic tumor angiogenesis and microenvironment, Bull. Math. Biol., 75 (2013), 274–287. https://doi.org/10.1007/s11538-012-9805-2 doi: 10.1007/s11538-012-9805-2
|
| [41] |
Y. Cai, J. Zhang, Z. Li, Multi-scale mathematical modelling of tumour growth and microenvironments in anti-angiogenic therapy, Biomed. Eng. Online, 15 (2016), 685–700. https://doi.org/10.1186/s12938-016-0275-x doi: 10.1186/s12938-016-0275-x
|
| [42] |
G. Zhao, E. Chen, X. Yu, H. Cui, J. LV, J. Wu, Three-dimensional model of metastatic tumor angiogenesis in response to anti-angiogenic factor angiostatin, J. Mech. Med. Biol., 17 (2017), 1750094. https://doi.org/10.1142/S0219519417500944 doi: 10.1142/S0219519417500944
|
| [43] |
J. Wu, Z. R. DING, Y. Cai, S. Xu, G. Zhao, Q. Long, Simulation of tumor microvasculature and microenvironment response to anti-angiogenic treatment by angiostatin and endostatin, Appl. Math. Mech. (English Edition), 32 (2011), 437–448. https://doi.org/10.1007/s10483-011-1428-7 doi: 10.1007/s10483-011-1428-7
|
| [44] |
J. W. Baish, T. Stylianopoulos, R. M. Lanning, R. K. Jain, Scaling rules for diffusive drug delivery in tumor and normal tissues, Proc. Natl. Acad. Sci., 108 (2011), 1799–1803. https://doi.org/10.1073/pnas.1018154108 doi: 10.1073/pnas.1018154108
|
| [45] |
A. L. Bauer, T. L. Jackson, Y. Jiang, A cell-based model exhibiting branching and anastomosis during tumor-induced angiogenesis, Biophys. J., 92 (2007), 3105–3121. https://doi.org/10.1529/biophysj.106.101501 doi: 10.1529/biophysj.106.101501
|
| [46] |
A. R. A. Anderson, M. A. J. Chaplain, C. García-Reimbert, C. A. Vargas, A gradient-driven mathematical model of antiangiogenesis, Math. Comput. Model., 32 (2000), 1141–1152. https://doi.org/10.1016/S0895-7177(00)00196-5 doi: 10.1016/S0895-7177(00)00196-5
|
| [47] |
D. Hanahan, J. Folkman, Patterns and emerging mechanisms of the angiogenic switch during tumorigenesis, Cell, 86 (1996) 353–364. https://doi.org/10.1016/S0092-8674(00)80108-7 doi: 10.1016/S0092-8674(00)80108-7
|
| [48] |
P. Carmeliet, R. K. Jain, Angiogenesis in cancer and other diseases, Nature, 407 (2000), 249–257. https://doi.org/10.1038/35025220 doi: 10.1038/35025220
|
| [49] |
N. Paweletz, M. Knierim, Tumor-related angiogenesis, Crit. Rev. Oncol. Hematol., 9 (1989), 197–242. https://doi.org/10.1016/S1040-8428(89)80002-2 doi: 10.1016/S1040-8428(89)80002-2
|
| [50] |
M. A. J. Chaplain, S. R. McDougall, A. R. A. Anderson, Mathematical modeling of tumor-induced angiogenesis, Annu. Rev. Biomed. Eng., 8 (2006) 233–257. https://doi.org/10.1146/annurev.bioeng.8.061505.095807 doi: 10.1146/annurev.bioeng.8.061505.095807
|
| [51] | M. A. J. Chaplain, S. R. McDougall, A. R. A. Anderson, Blood Flow and Tumour-Induced Angiogenesis: Dynamically Adapting Vascular Networks, in: T.L. Jackson (Ed.) Modeling Tumor Vasculature, Springer, New York, NY, (2012), 167–212. https: //doi.org/10.1007/978-1-4614-0052-3_8 |
| [52] |
M. A. Ghazani, M. Soltani, P. Jalali, R. Hassannejad, A novel numerical and artificial intelligence based approach to study anti-angiogenic drugs: endostatin, Appl. Math. Model., 105 (2022), 258–283. https://doi.org/10.1016/j.apm.2021.12.033 doi: 10.1016/j.apm.2021.12.033
|
| [53] |
J. Folkman, The vascularization of tumors, Sci. Am., 234 (1976), 58–73. http://dx.doi.org/10.1038/scientificamerican0576-58 doi: 10.1038/scientificamerican0576-58
|
| [54] |
A. Stevens, H. G. Othmer, Aggregation, blowup, and collapse: The ABC's of taxis in reinforced random walks, SIAM J. Appl. Math., 57 (1997), 1044–1081. https://doi.org/10.1137/S0036139995288976 doi: 10.1137/S0036139995288976
|
| [55] |
M. A. Gimbrone, R. S. Cotran, S. B. Leapman, J. Folkman, Tumor growth and neovascularization: an experimental model using the rabbit cornea, J. Natl. Cancer Inst., 52 (1974), 413–427. https://doi.org/10.1093/jnci/52.2.413 doi: 10.1093/jnci/52.2.413
|
| [56] |
V. R. Muthukkaruppan, L. Kubai, R. Auerbach, Tumor-induced neovascularization in the mouse eye, J. Natl. Cancer Inst., 69 (1982), 699–708. https://doi.org/10.1093/jnci/69.3.699 doi: 10.1093/jnci/69.3.699
|
| [57] |
A. L. Bauer, T. L. Jackson, Y. Jiang, Topography of extracellular matrix mediates vascular morphogenesis and migration speeds in angiogenesis, PLoS Comput. Biol., 5 (2009), e1000445. https://doi.org/10.1371/journal.pcbi.1000445 doi: 10.1371/journal.pcbi.1000445
|
| [58] |
A. Shamloo, S. C. Heilshorn, Matrix density mediates polarization and lumen formation of endothelial sprouts in VEGF gradients, Lab. Chip., 10 (2010), 3061–3068. https://doi.org/10.1039/C005069E doi: 10.1039/C005069E
|
| [59] | T. Browder, C. E. Butterfield, B. M. Kräling, B. Shi, B. Marshall, M. S. O'Reilly, et al., Antiangiogenic scheduling of chemotherapy improves efficacy against experimental drug-resistant cancer, Cancer Res., 60 (2000), 1878–1886. Retrieved from https://aacrjournals.org/cancerres |
| [60] |
B. A. Teicher, A systems approach to cancer therapy, Cancer Metastasis Rev., 15 (1996), 247–272. https://doi.org/10.1007/BF00437479 doi: 10.1007/BF00437479
|
| [61] |
L. Hlatky, P. Hahnfeldt, J. Folkman, Clinical application of antiangiogenic therapy: Microvessel density, what it does and doesn't tell us, J. Natl. Cancer Inst., 94 (2002), 883–893. https://doi.org/10.1093/jnci/94.12.883 doi: 10.1093/jnci/94.12.883
|
| [62] |
D. R. Soto-Pantoja, J. Menon, P. E. Gallagher, E. A. Tallant, Angiotensin-(1-7) inhibits tumor angiogenesis in human lung cancer xenografts with a reduction in vascular endothelial growth factor, Mol. Cancer Ther., 8 (2009), 1676–1683. https://doi.org/10.1158/1535-7163.MCT-09-0161 doi: 10.1158/1535-7163.MCT-09-0161
|
| [63] | Y. Yokoyama, M. Dhanabal, A. W. Griffioen, V. P. Sukhatme, S. Ramakrishnan, Synergy between angiostatin and endostatin: inhibition of ovarian cancer growth, Cancer Res., 60 (2000) 2190–2196. Retrieved from https: //aacrjournals.org/cancerres |
| [64] |
D. Ozturk, S. Yonucu, D. Yilmaz, M. B. Unlu, Influence of vascular normalization on interstitial flow and delivery of liposomes in tumors, Phys. Med. Biol., 60 (2015), 1477–1496. https://doi.org/10.1088/0031-9155/60/4/1477 doi: 10.1088/0031-9155/60/4/1477
|


Figures(19) / Tables(2)

Mahya Mohammadi, M. Soltani, Cyrus Aghanajafi, Mohammad Kohandel. Investigation of the evolution of tumor-induced microvascular network under the inhibitory effect of anti-angiogenic factor, angiostatin: A mathematical study[J]. Mathematical Biosciences and Engineering, 2023, 20(3): 5448-5480. doi: 10.3934/mbe.2023252


 DownLoad: