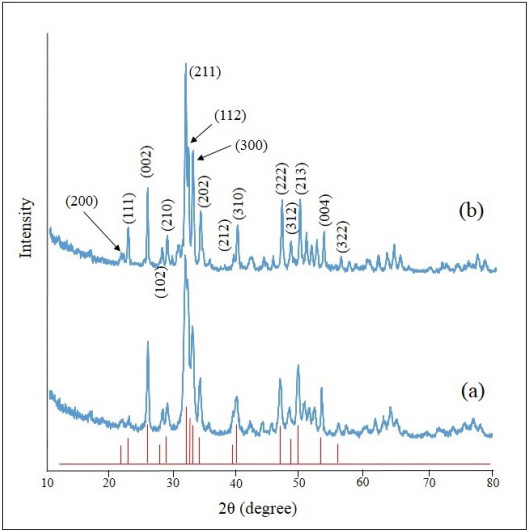
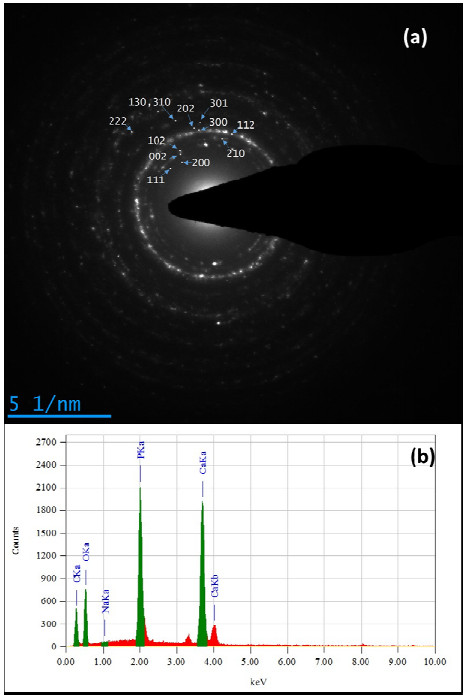
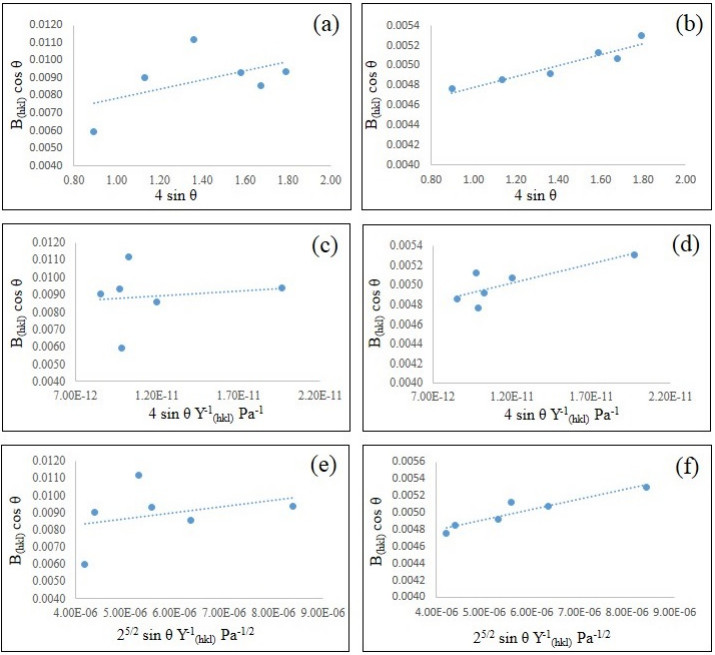
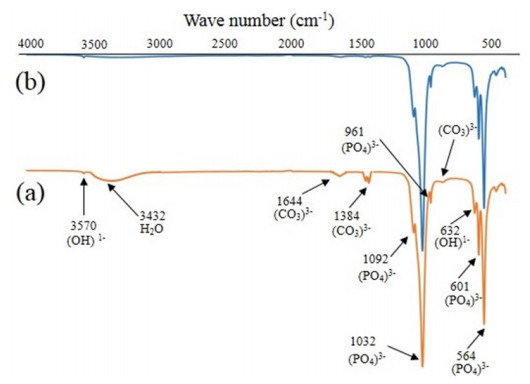
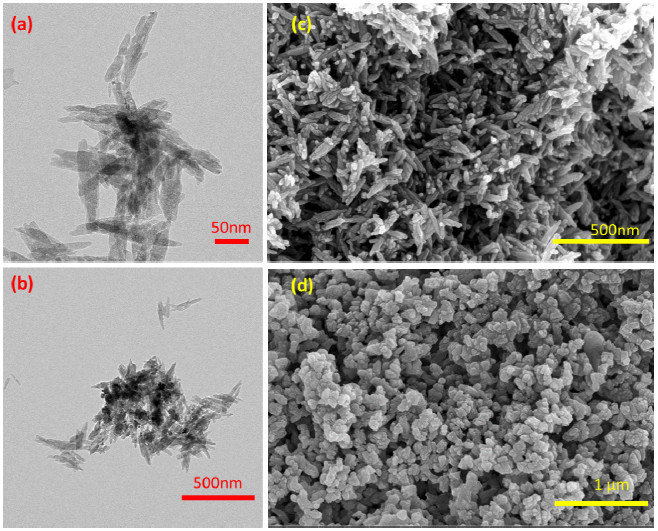
In the present paper, nanometer scale hydroxyapatite powders with a rod-like shape, were prepared using a combined ultrasonic and microwave heating-based method. Subsequent annealing of as-synthesized powders at 800 ℃ for 2 h produced nanoparticles with a rectangular and granular morphology. The hydroxyapatite particles were characterized using X-ray diffraction and Fourier transform infrared spectroscopy methods. Also, nanoparticle size and morphology were investigated using transmission electron microscopy and field emission scanning electron microscopy. A comparable selected area electron diffraction (SAED) analysis also showed results in line with X-ray powder diffraction patterns. The resulting X-ray diffraction peaks indicated that the powders were highly crystalline in nature and no impure phases were present. The X-ray diffraction data, was also used to study the effects of peak broadening by using the Williamson–Hall (W–H) analysis technique. The analysis used the uniform deformation model (UDM), uniform stress deformation model (USDM) and uniform deformation energy density model (UDEDM) to determine physical parameters like crystallite size, lattice strain, stress and energy density. The results of the W-H analysis were found to be comparable to the results obtained from microscopy studies. Importantly, the studies confirmed the synthesized nano- hydroxyapatite powders had morphologies similar to those found in dental hard tissues.
Citation: Supriya Rattan, Derek Fawcett, Gerrard Eddy Jai Poinern. Williamson-Hall based X-ray peak profile evaluation and nano-structural characterization of rod-shaped hydroxyapatite powder for potential dental restorative procedures[J]. AIMS Materials Science, 2021, 8(3): 359-372. doi: 10.3934/matersci.2021023
In the present paper, nanometer scale hydroxyapatite powders with a rod-like shape, were prepared using a combined ultrasonic and microwave heating-based method. Subsequent annealing of as-synthesized powders at 800 ℃ for 2 h produced nanoparticles with a rectangular and granular morphology. The hydroxyapatite particles were characterized using X-ray diffraction and Fourier transform infrared spectroscopy methods. Also, nanoparticle size and morphology were investigated using transmission electron microscopy and field emission scanning electron microscopy. A comparable selected area electron diffraction (SAED) analysis also showed results in line with X-ray powder diffraction patterns. The resulting X-ray diffraction peaks indicated that the powders were highly crystalline in nature and no impure phases were present. The X-ray diffraction data, was also used to study the effects of peak broadening by using the Williamson–Hall (W–H) analysis technique. The analysis used the uniform deformation model (UDM), uniform stress deformation model (USDM) and uniform deformation energy density model (UDEDM) to determine physical parameters like crystallite size, lattice strain, stress and energy density. The results of the W-H analysis were found to be comparable to the results obtained from microscopy studies. Importantly, the studies confirmed the synthesized nano- hydroxyapatite powders had morphologies similar to those found in dental hard tissues.

| [1] |
Kerebel B, Daculsi G, Kerebel LM (1979) Ultrastructural studies of enamel crystallites. Dent Res 58: 844-851. doi: 10.1177/00220345790580023701

|
| [2] |
Imbeni V, Kruzic JJ, Marshall GW, et al. (2005) The dentin-enamel junction and the fracture of human teeth. Nature Mater 4: 229-232. doi: 10.1038/nmat1323
|
| [3] |
Kalita SJ, Bhardwaj A, Bhatt HA (2007) Nanocrystalline calcium phosphate ceramics in biomedical engineering. Mater Sci Eng C-Mater 27: 441-449. doi: 10.1016/j.msec.2006.05.018
|
| [4] |
Cai Y, Tang R (2008) Calcium phosphate nanoparticles in biomineralization and biomaterials. J Mater Chem 18: 3775-3787. doi: 10.1039/b805407j
|
| [5] |
Blom A (2007) Which scaffold for which application? Curr Orthopaed 21: 280-287. doi: 10.1016/j.cuor.2007.06.005
|
| [6] |
Habibovic P, de Groot K (2007) Osteoinductive biomaterials—properties and relevance in bone repair. J Tissue Eng Regen M 1: 25-32. doi: 10.1002/term.5
|
| [7] |
Li L, Pan H, Tao J, et al. (2008) Repair of enamel by usinghydroxyapatite nanoparticles as the building blocks. J Mater Chem 18: 4079-4084. doi: 10.1039/b806090h
|
| [8] |
Tschoppe P, Zandim D, Martus P, et al. (2011) Enamel and dentine remineralization by nano-hydroxyapatite toothpastes. J Dent 39: 430-437. doi: 10.1016/j.jdent.2011.03.008
|
| [9] |
Meffert RM, Thomas JR, Hamilton KM, et al. (1985) Hydroxylapatite as an alloplastic graft in the treatment of human periodontal osseous defects. J Periodontol 56: 63-73. doi: 10.1902/jop.1985.56.2.63
|
| [10] | Piecuch JF (1986) Augmentation of the atrophic edentulous ridge with porous replamine form hydroxyapatite (Interpore-200). Dent Clin North Am 30: 291-305. |
| [11] |
Jean A, Kerebel B, Kerebel LM, et al. (1988) Effects of various calcium phosphate biomaterials on reparative dentin bridge formation. J Endodont 14: 83-87. doi: 10.1016/S0099-2399(88)80006-2
|
| [12] |
Pissiotis E, Spangberg LS (1990) Biological evaluation of collagen gels containing calcium hydroxide and hydroxyapatite. J Endodont 16: 468-473. doi: 10.1016/S0099-2399(07)80175-0
|
| [13] |
Rigo EC, Boschi AO, Yoshimoto M, et al. (2004) Evaluation in vitro and in vivo of biomimetic hydroxyapatite coated on titanium dental implants. Mater Sci Eng C-Mater 24: 647-651. doi: 10.1016/j.msec.2004.08.044
|
| [14] |
Okada M, Furuzono T (2012) Hydroxylapatite nanoparticles: Fabrication methods and medical applications. Sci Technol Adv Mater 13: 064103. doi: 10.1088/1468-6996/13/6/064103
|
| [15] |
Zhou H, Lee J (2011) Nanoscale hydroxyapatite particles for bone tissue engineering. Acta Biomater 7: 2769-2781. doi: 10.1016/j.actbio.2011.03.019
|
| [16] |
Prabhu YT, Rao KV, Kumar VSS, et al. (2014) X-ray analysis by Williamson-Hall and size-strain plot methods of ZnO nanoparticles with fuel variation. WJNSE 4: 43743. doi: 10.4236/wjnse.2014.41004
|
| [17] |
Venkateswarlu K, Bose AC, Rameshbabu N (2010) X-ray peak broadening studies of nanocrystalline hydroxyapatite by Williamson-Hall analysis. Physica B 405: 4256-4261. doi: 10.1016/j.physb.2010.07.020
|
| [18] | Gray DE (1972) American Institute of Physics Handbook, New York: McGraw-Hill Book Company. |
| [19] | Venkateswarlu K, Sreekanth D, Sandhyarani M, et al. (2012) X-ray peak profile analysis of nanostructured hydroxyapatite and fluorapatite. Int J Biosci Biochem Bioinform 2: 389-393. |
| [20] |
Liangzhi G, Weibin Z, Yuhui S (2016) Magnesium substituted hydroxyapatite whiskers: synthesis, characterization and bioactivity evaluation. RSC Adv 6: 114707-114707. doi: 10.1039/C6RA24469F
|
| [21] | Chaikina MV, Bulina NV, Prosanov IYU, et al. (2012) Mechanochemical synthesis of hydroxyapatite with SiO4 substitutions. Chem Sustain Dev 20: 431-443. |
| [22] |
Wang YJ, Chen JD, Wei K, et al. (2006) Surfactant-assisted synthesis of hydroxyapatite particles. Mater Lett 60: 3227-3231. doi: 10.1016/j.matlet.2006.02.077
|
| [23] |
Beckett EL, Lawrence NS, Tsai YC, et al. (2001) Bioanalytical utility of sonovoltammetry. J Pharmaceut Biomed 26: 995-1001. doi: 10.1016/S0731-7085(01)00494-0
|
| [24] |
Panda RN, Hsieh MF, Chung RJ, et al. (2003) FTIR, XRD, SEM and solid state NMR investigations of carbonate-containing hydroxyapatite nano-particles synthesised byhydroxide-gel technique. J Phys Chem Solids 64: 193-199. doi: 10.1016/S0022-3697(02)00257-3
|
| [25] |
Kannan S, Rocha JHG, Ventura JMG, et al. (2005) Effect of Ca/P ratio of precursors on the formation of different calcium apatite ceramics—an X-ray diffraction study. Scripta Mater 53: 1259-1262. doi: 10.1016/j.scriptamat.2005.07.037
|
Figures(6) / Tables(2)

Supriya Rattan, Derek Fawcett, Gerrard Eddy Jai Poinern. Williamson-Hall based X-ray peak profile evaluation and nano-structural characterization of rod-shaped hydroxyapatite powder for potential dental restorative procedures[J]. AIMS Materials Science, 2021, 8(3): 359-372. doi: 10.3934/matersci.2021023


 DownLoad: