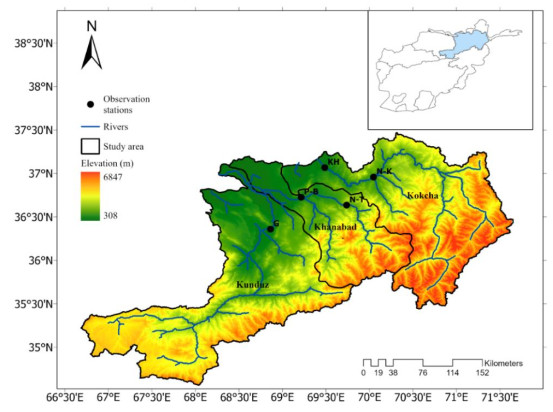
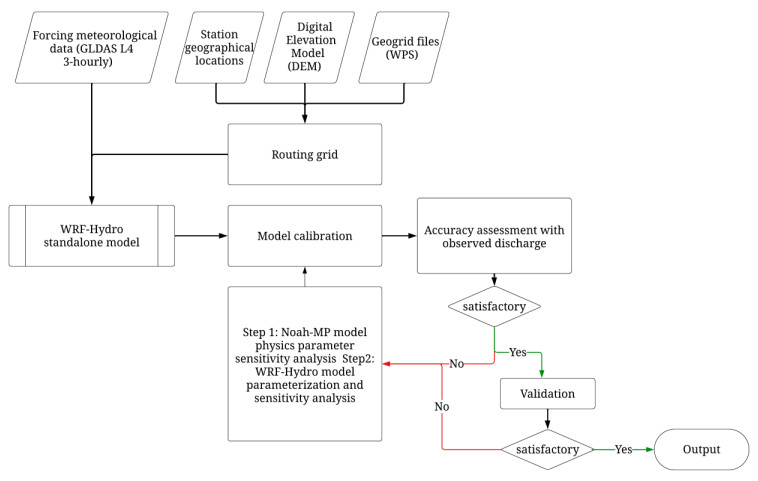
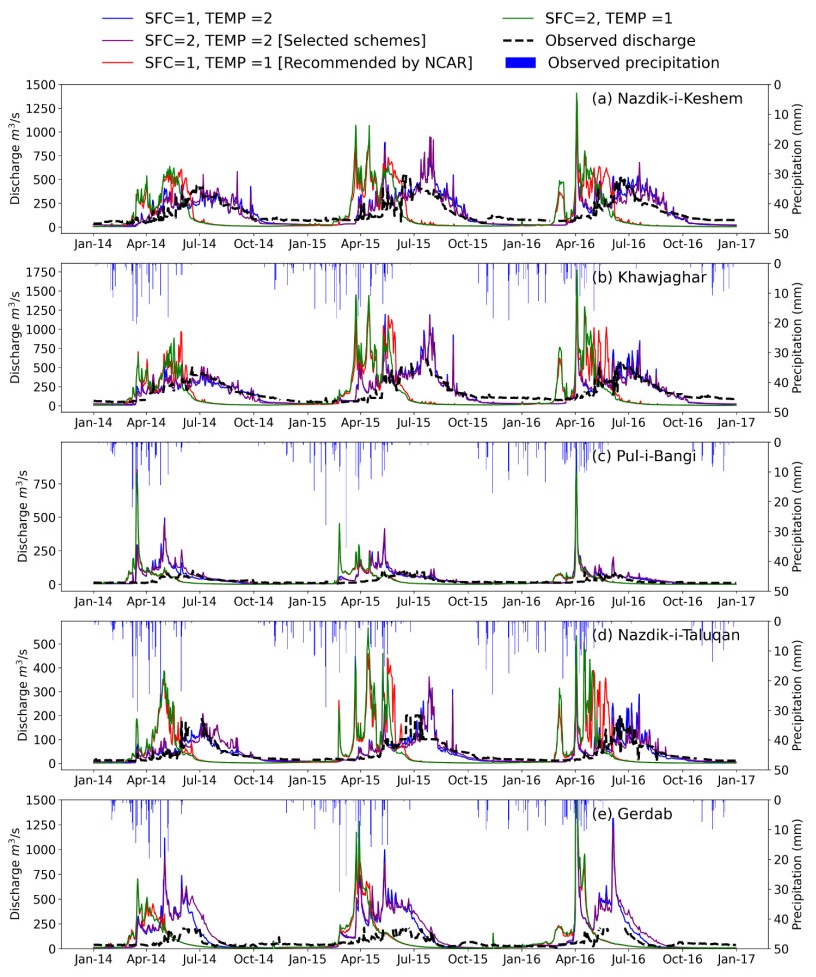
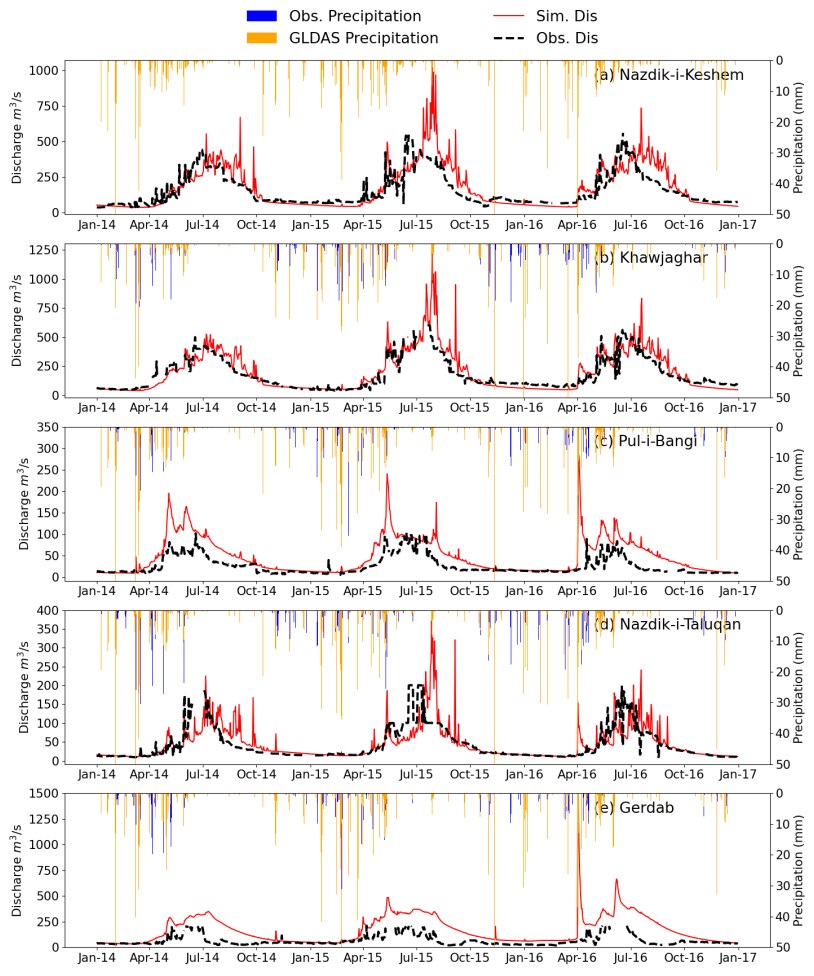
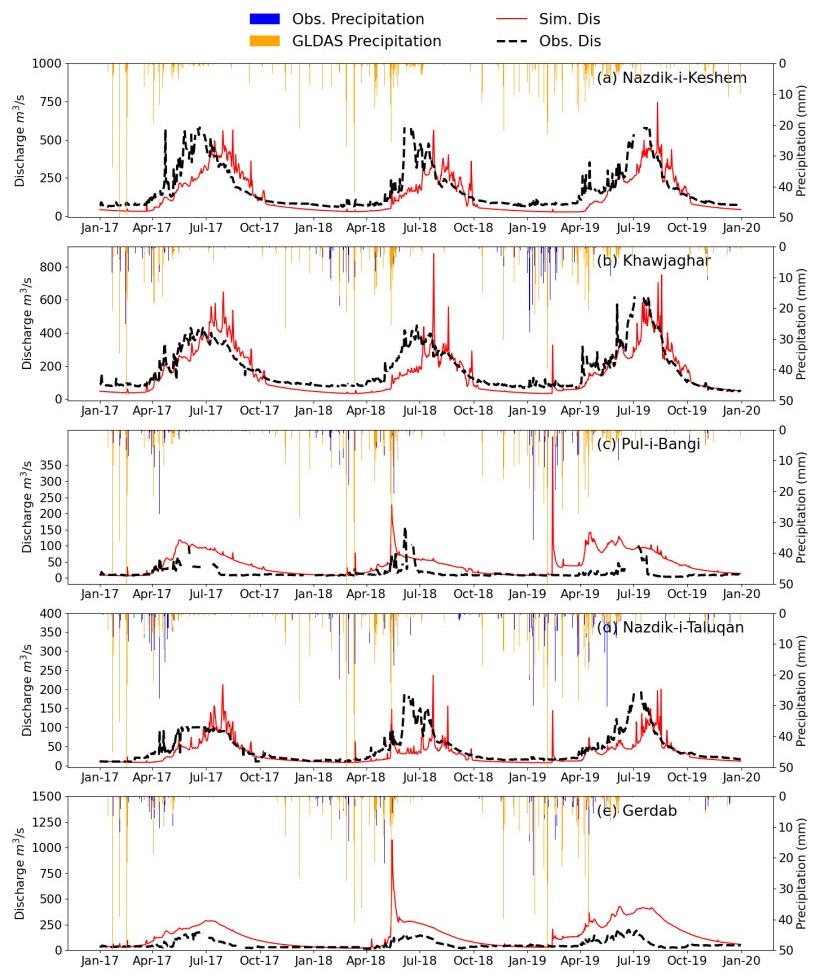
In the past century, water demand increased extensively due to the rapid growth of the human population. Ground observations can reveal hydrological dynamics but are expensive in the long term. Alternatively, hydrological models could be utilized for assessing streamflow with historical observations as the control point. Despite the advancements in hydrological modeling systems, watershed modeling over mountainous regions with complex terrain remains challenging. This study utilized the multi-physical Weather Research and Forecasting Hydrological enhancement model (WRF-Hydro), fully distributed over the Amu River Basin (ARB) in Afghanistan. The calibration process focused on land surface model (LSM) physics options and hydrological parameters within the model. The findings emphasize the importance of LSM for accurate simulation of snowmelt–runoff processes over mountainous regions. Correlation coefficient (R), coefficient of determination (R2), Nash-Sutcliff efficiency (NSE), and Kling-Gupta efficiency (KGE) were adopted for accuracy assessment over five discharge observation stations at a daily time scale; overall performance results were as follows: R was 0.85–0.42, R2 was 0.73–0.17, NSE was 0.52 to −8.64, and KGE was 0.74 to −0.56. The findings of the current study can support snowmelt process simulation within the WRF-Hydro model.
Citation: Wahidullah Hussainzada, Han Soo Lee. Impact of land surface model schemes in snow-dominated arid and semiarid watersheds using the WRF-hydro modeling systems[J]. AIMS Geosciences, 2024, 10(2): 312-332. doi: 10.3934/geosci.2024018
In the past century, water demand increased extensively due to the rapid growth of the human population. Ground observations can reveal hydrological dynamics but are expensive in the long term. Alternatively, hydrological models could be utilized for assessing streamflow with historical observations as the control point. Despite the advancements in hydrological modeling systems, watershed modeling over mountainous regions with complex terrain remains challenging. This study utilized the multi-physical Weather Research and Forecasting Hydrological enhancement model (WRF-Hydro), fully distributed over the Amu River Basin (ARB) in Afghanistan. The calibration process focused on land surface model (LSM) physics options and hydrological parameters within the model. The findings emphasize the importance of LSM for accurate simulation of snowmelt–runoff processes over mountainous regions. Correlation coefficient (R), coefficient of determination (R2), Nash-Sutcliff efficiency (NSE), and Kling-Gupta efficiency (KGE) were adopted for accuracy assessment over five discharge observation stations at a daily time scale; overall performance results were as follows: R was 0.85–0.42, R2 was 0.73–0.17, NSE was 0.52 to −8.64, and KGE was 0.74 to −0.56. The findings of the current study can support snowmelt process simulation within the WRF-Hydro model.

| [1] | FAO (2020) The State of Food and Agriculture (SOFA). Rome. Available from: http://www.fao.org/documents/card/en/c/cb1447en |
| [2] |
Qutbudin I, Shiru MS, Sharafati A, et al. (2019) Seasonal drought pattern changes due to climate variability: Case study in Afghanistan. Water 11: 1096. https://doi.org/10.3390/w11051096 doi: 10.3390/w11051096

|
| [3] |
Zoljoodi M, Didevarasl A (2013) Evaluation of Spatial-Temporal Variability of Drought Events in Iran Using Palmer Drought Severity Index and Its Principal Factors (through 1951–2005). Atmos Clim Sci 3: 193–207. https://doi.org/10.4236/acs.2013.32021 doi: 10.4236/acs.2013.32021
|
| [4] |
Ta Z, Yu R, Chen X, et al. (2018) Analysis of the spatio-temporal patterns of dry and wet conditions in Central Asia. Atmosphere 9: 7. https://doi.org/10.3390/atmos9010007 doi: 10.3390/atmos9010007
|
| [5] |
Li Z, Chen Y, Fang G, et al. (2017) Multivariate assessment and attribution of droughts in Central Asia. Sci Rep 7: 1316. https://doi.org/10.1038/s41598-017-01473-1 doi: 10.1038/s41598-017-01473-1
|
| [6] | Wheater H, Sorooshian S, Sharma KD (2007) Hydrological modelling in arid and semi-arid areas, Cambridge University Press. |
| [7] | Singh A (2018) A Concise Review on Introduction to Hydrological Models. Glob Res Dev J Eng 3: 14–19. |
| [8] |
Singh VP (2018) Hydrologic modeling: progress and future directions. Geosci Lett 5: 15. https://doi.org/10.1186/s40562-018-0113-z doi: 10.1186/s40562-018-0113-z
|
| [9] |
Yu E, Liu X, Li J, et al. (2023) Calibration and Evaluation of the WRF-Hydro Model in Simulating the Streamflow over the Arid Regions of Northwest China: A Case Study in Kaidu River Basin. Sustainability 15: 6175. https://doi.org/10.3390/su15076175 doi: 10.3390/su15076175
|
| [10] | Gochis DJ, Barlage M, Dugger A, et al. (2018) WRF-Hydro Technical Description, (version 5.0). NCAR Tech Note, 107. Available from: https://ral.ucar.edu/sites/default/files/public/WRF-HydroV5TechnicalDescription_update512019.pdf |
| [11] |
Lee J, Kim Y, Wang D (2022) Assessing the characteristics of recent drought events in South Korea using WRF-Hydro. J Hydrol 607: 127459. https://doi.org/10.1016/j.jhydrol.2022.127459 doi: 10.1016/j.jhydrol.2022.127459
|
| [12] |
Quenum GMLD, Arnault J, Klutse NAB, et al. (2022) Potential of the Coupled WRF/WRF-Hydro Modeling System for Flood Forecasting in the Ouémé River (West Africa). Water 14: 1192. https://doi.org/10.3390/w14081192 doi: 10.3390/w14081192
|
| [13] |
Naabil E, Lamptey BL, Arnault J, et al. (2017) Water resources management using the WRF-Hydro modelling system: Case-study of the Tono dam in West Africa. J Hydrol Reg Stud 12: 196–209. https://doi.org/10.1016/j.ejrh.2017.05.010 doi: 10.1016/j.ejrh.2017.05.010
|
| [14] |
Noor H, Vafakhah M, Taheriyoun M, et al. (2014) Hydrology modelling in Taleghan mountainous watershed using SWAT. J Water Land Dev 20: 11–18. https://doi.org/10.2478/jwld-2014-0003 doi: 10.2478/jwld-2014-0003
|
| [15] |
Kang K, Lee JH (2014) Hydrologic modelling of the effect of snowmelt and temperature on a mountainous watershed. J Earth Syst Sci 123: 705–713. https://doi.org/10.1007/s12040-014-0423-2 doi: 10.1007/s12040-014-0423-2
|
| [16] |
Hussainzada W, Lee HS (2021) Hydrological modelling for water resource management in a semi-arid mountainous region using the soil and water assessment tool: A case study in northern Afghanistan. Hydrology 8: 16. https://doi.org/10.3390/hydrology8010016 doi: 10.3390/hydrology8010016
|
| [17] |
Hussainzada W, Lee HS, Bahanga V, et al. (2021) Sensitivity of snowmelt runoff modelling to the level of cloud coverage in snow cover extent. J Hydrol Reg Stud 36: 100835. https://doi.org/10.1016/j.ejrh.2021.100835 doi: 10.1016/j.ejrh.2021.100835
|
| [18] | MAIL (2023) Management Information System, Ministry of Agriculture, Irrigation and Livestock (MAIL), Management Information System (MIS), 2023. Available from: https://www.mail.gov.af/en. |
| [19] |
Hussainzada W, Lee HS (2022) Effect of an improved agricultural irrigation scheme with a hydraulic structure for crop cultivation in arid northern Afghanistan using the Soil and Water Assessment Tool (SWAT). Sci Rep 12: 5186. https://doi.org/10.1038/s41598-022-09318-2 doi: 10.1038/s41598-022-09318-2
|
| [20] |
Hussainzada W, Cabrera JS, Samim AT, et al. (2023) Water resource management for improved crop cultivation and productivity with hydraulic engineering solution in arid northern Afghanistan. Appl Water Sci 13: 41. https://doi.org/10.1007/s13201-022-01850-w doi: 10.1007/s13201-022-01850-w
|
| [21] |
Tani H, Tayfur G (2023) Modelling Rainfall-Runoff Process of Kabul River Basin in Afghanistan Using ArcSWAT Model. J Civ Eng Constr 12: 1–18. https://doi.org/10.32732/jcec.2023.12.1.1 doi: 10.32732/jcec.2023.12.1.1
|
| [22] |
Ougahi JH, Karim S, Mahmood SA (2022) Application of the SWAT model to assess climate and land use/cover change impacts on water balance components of the Kabul River Basin, Afghanistan. J Water Clim Change 13: 3977–3999. https://doi.org/10.2166/wcc.2022.261 doi: 10.2166/wcc.2022.261
|
| [23] | Ayoubi T, Dongshik K (2016) Panjshir Watershed Hydrologic Model Using Integrated Gis and ArcSWAT interface. J Earth Environ Sci 6: 145–161. |
| [24] |
Aawar T, Khare D (2020) Assessment of climate change impacts on streamflow through hydrological model using SWAT model: a case study of Afghanistan. Model Earth Syst Environ 6: 1427–1437. https://doi.org/10.1007/s40808-020-00759-0 doi: 10.1007/s40808-020-00759-0
|
| [25] |
Akhtar F, Awan UK, Borgemeister C, et al. (2021) Coupling Remote Sensing and Hydrological Model for Evaluating the Impacts of Climate Change on Streamflow in Data-Scarce Environment. Sustainability 13: 14025. https://doi.org/10.3390/su132414025 doi: 10.3390/su132414025
|
| [26] |
John A, Fowler K, Nathan R, et al. (2021) Disaggregated monthly hydrological models can outperform daily models in providing daily flow statistics and extrapolate well to a drying climate. J Hydrol 598: 126471. https://doi.org/10.1016/j.jhydrol.2021.126471 doi: 10.1016/j.jhydrol.2021.126471
|
| [27] |
Dechmi F, Burguete J, Skhiri A (2012) SWAT application in intensive irrigation systems: Model modification, calibration and validation. J Hydrol 470–471: 227–238. https://doi.org/10.1016/j.jhydrol.2012.08.055 doi: 10.1016/j.jhydrol.2012.08.055
|
| [28] |
Santhi C, Srinivasan R, Arnold JG, et al. (2006) A modeling approach to evaluate the impacts of water quality management plans implemented in a watershed in Texas. Environ Model Softw 21: 1141–1157. https://doi.org/10.1016/j.envsoft.2005.05.013 doi: 10.1016/j.envsoft.2005.05.013
|
| [29] | NSIA (2023) Afghanistan Statistical Yearbook 2022–23, Kabul, Afghanistan. Available from: http://nsia.gov.af: 8080/wp-content/uploads/2023/. |
| [30] |
Sherzad S, Chennappa TN (2022) Sustainability for the Watershed Management in Afghanistan: Example from Amu River Basin. Grassroots J Nat Resour 5: 44–58. https://doi.org/10.33002/nr2581.6853.050204 doi: 10.33002/nr2581.6853.050204
|
| [31] | Ran L, Pleim J, Gilliam R (2010) Impact of high resolution land-use data in meteorology and air quality modeling systems. Air Pollut Model Its Appl XX: 3–7. |
| [32] | FAO/UNESCO, FAO/UNESCO Soil Map of the World, 1971. Available from: https://www.fao.org/soils-portal/data-hub/soil-maps-and-databases/faounesco-soil-map-of-the-world/en/. |
| [33] |
Onogi K (1998) A data quality control method using forecasted horizontal gradient and tendency in a NWP system: Dynamic QC. J Meteorol Soc Japan 76: 497–516. https://doi.org/10.2151/jmsj1965.76.4_497 doi: 10.2151/jmsj1965.76.4_497
|
| [34] |
Gudmundsson L, Do HX, Leonard M, et al. (2018) The Global Streamflow Indices and Metadata Archive (GSIM)—Part 2: Quality control, time-series indices and homogeneity assessment. Earth Syst Sci Data 10: 787–804. https://doi.org/10.5194/essd-10-787-2018 doi: 10.5194/essd-10-787-2018
|
| [35] |
Díaz Muñ iz C, García Nieto PJ, Alonso Fernández JR, et al. (2012) Detection of outliers in water quality monitoring samples using functional data analysis in San Esteban estuary (Northern Spain). Sci Total Environ 439: 54–61. https://doi.org/10.1016/j.scitotenv.2012.08.083 doi: 10.1016/j.scitotenv.2012.08.083
|
| [36] |
Liu S, Wang J, Wei J, et al. (2021) Hydrological simulation evaluation with WRF-Hydro in a large and highly complicated watershed: The Xijiang River basin. J Hydrol Reg Stud 38: 100943. https://doi.org/10.1016/j.ejrh.2021.100943 doi: 10.1016/j.ejrh.2021.100943
|
| [37] |
Koren V, Schaake J, Mitchell K, et al. (1999) A parameterization of snowpack and frozen ground intended for NCEP weather and climate models. J Geophys Res Atmos 104: 19569–19585. https://doi.org/10.1029/1999JD900232 doi: 10.1029/1999JD900232
|
| [38] |
Niu GY, Yang ZL, Mitchell KE, et al. (2011) The community Noah land surface model with multiparameterization options (Noah-MP): 1. Model description and evaluation with local-scale measurements. J Geophys Res Atmos 116: 1–19. https://doi.org/10.1029/2010JD015139 doi: 10.1029/2010JD015139
|
| [39] | Gochis DJ, Barlage M, Cabell R, et al. (2020) The WRF-Hydro modeling system technical description, (Version 5.1.1). NCAR Tech Note 107. |
| [40] | Sampson K, Gochis D (2018) WRF Hydro GIS Pre-Processing Tools, Version 5.0, Documentation. Boulder CO Natl Cent Atmos Res Res Appl Lab. |
| [41] |
Shafqat Mehboob M, Kim Y, Lee J, et al. (2022) Quantifying the sources of uncertainty for hydrological predictions with WRF-Hydro over the snow-covered region in the Upper Indus Basin, Pakistan. J Hydrol 614: 128500. https://doi.org/10.1016/j.jhydrol.2022.128500 doi: 10.1016/j.jhydrol.2022.128500
|
| [42] |
Liu Y, Liu J, Li C, et al. (2021) Parameter Sensitivity Analysis of the WRF-Hydro Modeling System for Streamflow Simulation: a Case Study in Semi-Humid and Semi-Arid Catchments of Northern China. Asia-Pacific J Atmos Sci 57: 451–466. https://doi.org/10.1007/s13143-020-00205-2 doi: 10.1007/s13143-020-00205-2
|
| [43] |
Mascaro G, Hussein A, Dugger A, et al. (2023) Process-based calibration of WRF-Hydro in a mountainous basin in southwestern U.S. J Am Water Resour Assoc 59: 49–70. https://doi.org/10.1111/1752-1688.13076 doi: 10.1111/1752-1688.13076
|
| [44] |
Kling H, Fuchs M, Paulin M (2012) Runoff conditions in the upper Danube basin under an ensemble of climate change scenarios. J Hydrol 424–425: 264–277. https://doi.org/10.1016/j.jhydrol.2012.01.011 doi: 10.1016/j.jhydrol.2012.01.011
|
| [45] |
You Y, Huang C, Yang Z, et al. (2020) Assessing Noah-MP Parameterization Sensitivity and Uncertainty Interval Across Snow Climates. J Geophys Res Atmos 125: 1–20. https://doi.org/10.1029/2019JD030417 doi: 10.1029/2019JD030417
|
| [46] |
You Y, Huang C, Gu J, et al. (2020) Assessing snow simulation performance of typical combination schemes within Noah-MP in northern Xinjiang, China. J Hydrol 581: 124380. https://doi.org/10.1016/j.jhydrol.2019.124380 doi: 10.1016/j.jhydrol.2019.124380
|
| [47] |
Moriasi DN, Gitau MW, Pai N, et al. (2015) Hydrologic and water quality models: Performance measures and evaluation criteria. Trans ASABE 58: 1763–1785. https://doi.org/10.13031/trans.58.10715 doi: 10.13031/trans.58.10715
|
| [48] |
Legates DR, McCabe GJ (1999) Evaluating the use of "goodness-of-fit" measures in hydrologic and hydroclimatic model validation. Water Resour Res 35: 233–241. https://doi.org/10.1029/1998WR900018 doi: 10.1029/1998WR900018
|
| [49] |
Legates DR, Davis RE (1997) The continuing search for an anthropogenic climate change signal: Limitations of correlation‐based approaches. Geophys Res Lett 24: 2319–2322. https://doi.org/10.1029/97GL02207 doi: 10.1029/97GL02207
|
| [50] |
Krause P, Boyle DP, Bäse F (2005) Comparison of different efficiency criteria for hydrological model assessment. Adv Geosci 5: 89–97. https://doi.org/10.5194/adgeo-5-89-2005 doi: 10.5194/adgeo-5-89-2005
|
| [51] |
Chen Z, Lucianetti G, Hartmann A (2023) Understanding groundwater storage and drainage dynamics of a high mountain catchment with complex geology using a semi-distributed process-based modelling approach. J Hydrol 625: 130067. https://doi.org/10.1016/j.jhydrol.2023.130067 doi: 10.1016/j.jhydrol.2023.130067
|
Figures(5) / Tables(6)

Wahidullah Hussainzada, Han Soo Lee. Impact of land surface model schemes in snow-dominated arid and semiarid watersheds using the WRF-hydro modeling systems[J]. AIMS Geosciences, 2024, 10(2): 312-332. doi: 10.3934/geosci.2024018


 DownLoad: