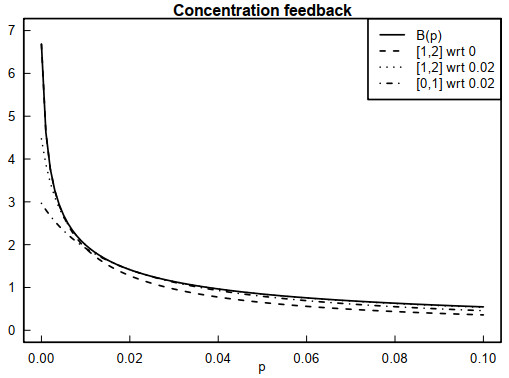
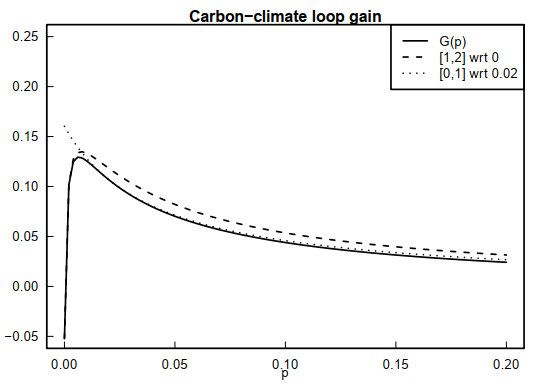
The Padé-Laplace technique consists of approximating impulse response relations by fitting the Laplace transforms of such relations as ratios of polynomials in the transform variable. This can be used to define "reduced models" that capture the dominant behaviour of more complex systems. This approach is illustrated by analysing various aspects of the carbon cycle and its connection to climate, providing a way to capture how the interactions depend on the timescales involved. The Padé-Laplace technique is used to relate descriptions of the carbon cycle in terms of impulse response functions versus descriptions in terms of feedbacks. It is also used to discuss the concept of CO$ _2 $-emission equivalence. A further example analyses the gain of the climate-carbon feedback loop. This is approximated with a simple parameterization that captures the results of more complex model results and shows that the gain on timescales of centuries is as much as 3 times the gain on decadal timescales. The scope for extensions to more general aspects of the carbon system, such as the distribution of radiocarbon, is noted along with other potential extensions of this approach.
Citation: Ian G Enting. Response function analysis of carbon dioxide and climate using the Padé-Laplace technique[J]. AIMS Geosciences, 2022, 8(3): 346-365. doi: 10.3934/geosci.2022020
The Padé-Laplace technique consists of approximating impulse response relations by fitting the Laplace transforms of such relations as ratios of polynomials in the transform variable. This can be used to define "reduced models" that capture the dominant behaviour of more complex systems. This approach is illustrated by analysing various aspects of the carbon cycle and its connection to climate, providing a way to capture how the interactions depend on the timescales involved. The Padé-Laplace technique is used to relate descriptions of the carbon cycle in terms of impulse response functions versus descriptions in terms of feedbacks. It is also used to discuss the concept of CO$ _2 $-emission equivalence. A further example analyses the gain of the climate-carbon feedback loop. This is approximated with a simple parameterization that captures the results of more complex model results and shows that the gain on timescales of centuries is as much as 3 times the gain on decadal timescales. The scope for extensions to more general aspects of the carbon system, such as the distribution of radiocarbon, is noted along with other potential extensions of this approach.

| [1] |
Joos F, Roth R, Fuglestvedt JS, et al. (2013) Carbon dioxide and climate impulse response functions for the computation of greenhouse gas metrics: a multi-model analysis. Atmos Chem Phys 13: 2793–2825. https://doi.org/10.5194/acp-13-2793-2013 doi: 10.5194/acp-13-2793-2013

|
| [2] |
Meinshausen M, Raper SCB, Wigley TML (2011) Emulating coupled atmosphere-ocean and carbon cycle models with a simpler model, part 1: model description and calibration. Atmos Chem Phys 11: 1417–1456. https://doi.org/10.5194/acp-11-1417-2011 doi: 10.5194/acp-11-1417-2011
|
| [3] |
Joos F, Bruno M, Fink R, et al. (1996) An efficient and accurate representation of complex oceanic and biospheric models of anthropogenic carbon uptake. Tellus B 48: 397–417. https://doi.org/10.3402/tellusb.v48i3.15921 doi: 10.3402/tellusb.v48i3.15921
|
| [4] | Enting IG, Mansbridge JV (1987) Inversion relations for the deconvolution of CO$_2$ data from ice cores. Inverse Probl 3: L63–L69. |
| [5] | Enting IG (1990) Ambiguities in the calibration of carbon cycle models. Inverse Probl 6: L39–L46. |
| [6] | Enting IG, Wigley TML, Heimann M (1994) Future emissions and concentrations of carbon dioxide: Key ocean/atmosphere/land analyses. Tech Rep. Available from: http://www.cmar.csiro.au/e-print/open/enting_2001a0.htm. |
| [7] | Enting IG (2010) Inverse problems and complexity in earth system science. In: Dewar RL, Detering F, Editors, Complex Physical, Biophysical and Econophysical Systems. World Scientific, Singapore. |
| [8] | Yeramian E, Claverie P (1987) Analysis of multiexponential functions without a hypothesis as to the number of components. Nature 326: 169–174. |
| [9] |
Claverie P, Denis A, Yeramian E (1989) The representation of functions through the combined use of integral transforms and Padé approximants: Padé-Laplace analysis of functions as sums of exponentials. Comput Phys Rep 9: 247–299. https://doi.org/10.1016/0167-7977(89)90025-7 doi: 10.1016/0167-7977(89)90025-7
|
| [10] |
Feldman P, Freund RW (1995) Efficient linear circuit analysis by Padé approximation via the Lanczos process. IEEE Trans Comput Aided Des Integr Circuits Syst 14: 639–649. https://doi.org/10.1109/43.384428 doi: 10.1109/43.384428
|
| [11] |
Enting IG (2022) R code for 'Response function analysis of carbon dioxide and climate using the Padé-Laplace technique'. FigShare. https://doi.org/10.6084/m9.figshare.19688688 doi: 10.6084/m9.figshare.19688688
|
| [12] |
Enting IG, Clisby N (2021) R code for acp-2020-996. Technical note on comparing greenhouse gas emission metrics. FigShare. https://doi.org/10.6084/m9.figshare.13667657 doi: 10.6084/m9.figshare.13667657
|
| [13] |
Enting IG, Clisby N (2021) Technical note: On comparing greenhouse gas emission metrics. Atmos Chem Phys 21: 4699–4708. https://doi.org/10.5194/acp-21-4699-2021 doi: 10.5194/acp-21-4699-2021
|
| [14] |
Oeschger H, Heimann M (1983) Uncertainties of predictions of future atmospheric CO$_2$ concentrations. J Geophys Res 88: 1258–1262. https://doi.org/10.1029/JC088iC02p01258 doi: 10.1029/JC088iC02p01258
|
| [15] |
Enting IG (2011) Seeking carbon-consistency in the climate-science-to-policy interface. Biogeochemistry 104: 59–67. https://doi.org/10.1007/s10533-009-9351-7 doi: 10.1007/s10533-009-9351-7
|
| [16] |
Enting IG (2007) Laplace transform analysis of the carbon cycle. EnvironvModell Softw 22: 1488–1497. https://doi.org/10.1016/j.envsoft.2006.06.018 doi: 10.1016/j.envsoft.2006.06.018
|
| [17] | Abramowitz M, Stegun I (1964) Handbook of Matahematical Functions. National Bureau of Standards (US). |
| [18] |
Rubino M, Etheridge DM, Trudinger CM, et al. (2016) Low atmospheric CO$_2$ levels during the Little Ice Age due to cooling-induced terrestrial uptake. Nature Geosci 9: 691–694. https://doi.org/10.1038/ngeo2769 doi: 10.1038/ngeo2769
|
| [19] |
Enting IG, Clisby N (2019) Estimating climatic influence on the carbon cycle. Earth Syst Dynam Discuss. https://doi.org/10.5194/esd-2019-41 doi: 10.5194/esd-2019-41
|
| [20] |
Wigley TML (1991) A simple inverse carbon cycle model. Global Biogeochem Cycles 5: 373–382. https://doi.org/10.1029/91GB02279 doi: 10.1029/91GB02279
|
| [21] |
Enting IG (2021) The Padé-Laplace formalism for carbon and climate responses. 24th Int Conf Modell Simul. https://doi.org/10.36334/modsim.2021.A3.enting doi: 10.36334/modsim.2021.A3.enting
|
| [22] |
Oeschger H, Siegenthaler U, Schotterer Y, et al. (1975) A box diffusion model to study the carbon dioxide exchange in nature. Tellus 27: 168–192. https://doi.org/10.3402/tellusa.v27i2.9900 doi: 10.3402/tellusa.v27i2.9900
|
| [23] |
Wigley TML (1998) The Kyoto Protocol: CO$_2$, CH$_4$ and climate implications. Geophys Res Lett, 25: 2285–2288. https://doi.org/10.1029/98GL01855 doi: 10.1029/98GL01855
|
| [24] |
Friedlingstein P, Dufresne JL Cox PM, et al. (2003) How positive is the feedback between climate change and the carbon cycle? Tellus B 55: 692–700. https://doi.org/10.3402/tellusb.v55i2.16765 doi: 10.3402/tellusb.v55i2.16765
|
| [25] | Oeschger H, Siegenthaler U, Heimann M (1980) The carbon cycle and its perturbations by man. In: Bach W, Pankrath J, Williams J, Editors, Interactions of Energy and Climate, 107–127. Reidel, Dordrecht. |
| [26] |
Wigley TML, Raper SCB (1990) Natural variability of the climate system and detection of the greenhouse effect. Nature 344: 324–327. https://doi.org/10.1038/344324a0 doi: 10.1038/344324a0
|
| [27] |
Gregory JM, Jones CD, Cadule P, et al. (2009) Quantifying carbon cycle feedbacks. J Climate 22: 5232–5250. https://doi.org/10.1175/2009JCLI2949.1 doi: 10.1175/2009JCLI2949.1
|
| [28] |
Friedlingstein P, Cox P, Betts R, et al. (2006) Climate-carbon cycle feedback analysis: Results from the C4MIP model intercomparison. J Climate 19: 3337–3353. https://doi.org/10.1175/JCLI3800.1 doi: 10.1175/JCLI3800.1
|
| [29] |
Arora VK, Boer GJ, Friedlingstein P, et al. (2013) Carbon–concentration and carbon–climate feedbacks in CMIP5 Earth system models. J Climate 26: 5289–5314. https://doi.org/10.1175/JCLI-D-12-00494.1 doi: 10.1175/JCLI-D-12-00494.1
|
| [30] | Myhre G, Shindell D, Bréon FM, et al. (2013) Anthropogenic and natural radiative forcing: Supplementary material. In: Stocker TF, Qin D, Plattner GK, et al., Editors, Climate Change 2013: The Physical Science Basis. Contribution of Working Group I to the Fifth Assessment Report of the Intergovernmental Panel on Climate Change, Cambridge University Press, Cambridge, United Kingdom and New York, NY, USA. |
| [31] |
Leach NJ, Jenkins S, Nicholls Z, et al. (2021) Fairv2.0.0: a generalized impulse response model for climate uncertainty and future scenario exploration. Geosci Model Dev 14 : 3007–3036. https://doi.org/10.5194/gmd-14-3007-2021 doi: 10.5194/gmd-14-3007-2021
|
| [32] |
Varotsos C, Mazei Y, Efstathiou M (2020) Paleoecological and recent data show a steady temporal evolution of carbon dioxide and temperature. Atmos Pollut Res 11: 714–722. https://doi.org/10.1016/j.apr.2019.12.022 doi: 10.1016/j.apr.2019.12.022
|
| [33] |
Neukom R, Steiger N, Gómez-Navarro JJ, et al. (2019) No evidence for globally coherent warm and cold periods over the preindustrial common era. Nature 571: 550–554. https://doi.org/10.1038/s41586-019-1401-2 doi: 10.1038/s41586-019-1401-2
|
| [34] |
Joos F, Roth R, Fuglestvedt JS, et al. (2013) Carbon dioxide and climate impulse response functions for the computation of greenhouse gas metrics: a multi-model analysis. supplementary information. Atmos Chem Phys. https://doi.org/10.5194/acp-13-2793-2013 doi: 10.5194/acp-13-2793-2013
|
| [35] |
Laurmann JA, Spreiter JR (1983) The effects of carbon cycle model error in calculating future atmospheric carbon dioxide levels. Climatic Change 5: 145–181. https://doi.org/10.1007/BF00141268 doi: 10.1007/BF00141268
|
| [36] |
Enting I (2018) Estimation and inversion across the spectrum of carbon cycle modeling. AIMS Geosci 4: 126–143. https://doi.org/10.3934/geosci.2018.2.126 doi: 10.3934/geosci.2018.2.126
|
| [37] |
Raupach MR, Gloor M, Sarmiento JL, et al. (2014) The declining uptake rate of atmospheric CO$_2$ by land and ocean sinks. Biogeosciences 11: 3453–3475. https://doi.org/10.5194/bg-11-3453-2014 doi: 10.5194/bg-11-3453-2014
|
| [38] |
Woodwell GM, MacKenzie FT, Houghton RA, et al. (1998) Biotic feedbacks in the warming of the Earth. Climatic Change 40: 495–518. https://doi.org/10.1023/A:1005345429236 doi: 10.1023/A:1005345429236
|
| [39] |
Bauska TK, Joos F, Mix AC, et al. (2015) Links between atmospheric carbon dioxide, the land reservoir and climate over the last millennium. Nature Geosci 8: 383–387. https://doi.org/10.1038/ngeo2422 doi: 10.1038/ngeo2422
|
| [40] |
Wang W, Nemani R (2014) Dynamics of global atmospheric CO$_2$ concentration from 1850 to 2010: a linear approximation. Biogeosci Discuss 11: 13957–13983. https://doi.org/10.5194/bgd-11-13957-2014 doi: 10.5194/bgd-11-13957-2014
|
| [41] | Bauska TK (2013) Carbon Cycle Variability During the Last Milennium and Last Deglaciation. Oregon State University. |
| [42] |
Broecker WS, Peng TH, Engh R (1980) Modeling the carbon system. Radiocarbon 22: 565–598. https://doi.org/10.1017/S0033822200009966 doi: 10.1017/S0033822200009966
|
Figures(3) / Tables(1)

Ian G Enting. Response function analysis of carbon dioxide and climate using the Padé-Laplace technique[J]. AIMS Geosciences, 2022, 8(3): 346-365. doi: 10.3934/geosci.2022020


 DownLoad: