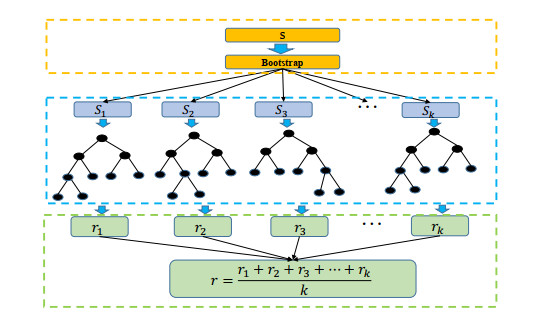
Xinjiang is a typical arid and semi-arid Mountain basin system, which make the regional ecosystem extremely fragile. Studying the influence of climate on vegetation is conducive to qualitatively analyze the change trend of vegetation coverage in this region. Therefore, utilizing vegetation coverage and main meteorological elements (temperature, precipitation, relative humidity, sunshine hours) data in Xinjiang province, this paper carried out the influence of multiple meteorological elements on vegetation coverage changes, and constructed a model of the impact of multiple meteorological elements on the growing season vegetation coverage based on random forest. The model can better simulate the vegetation coverage in 2017 and 2018, with an average error of 0.027, in consequence it can well forecast whether the vegetation is high-density or low-density in this area. Correlation analysis and variable importance show that the critical meteorological factors affecting vegetation cover change are relative humidity and sunshine hours, accounting for 73% of the vegetation coverage area. The results are helpful to understand how meteorological factors affect the vegetation coverage, and then provide a theoretical reference for the construction of ecological security in Xinjiang.
Citation: Huimin Bai, Li Li, Yongping Wu, Chen Liu, Zhiqiang Gong, Guolin Feng, Gui-Quan Sun. Study on the influence of meteorological elements on growing season vegetation coverage in Xinjiang, China[J]. Electronic Research Archive, 2022, 30(9): 3463-3480. doi: 10.3934/era.2022177
Xinjiang is a typical arid and semi-arid Mountain basin system, which make the regional ecosystem extremely fragile. Studying the influence of climate on vegetation is conducive to qualitatively analyze the change trend of vegetation coverage in this region. Therefore, utilizing vegetation coverage and main meteorological elements (temperature, precipitation, relative humidity, sunshine hours) data in Xinjiang province, this paper carried out the influence of multiple meteorological elements on vegetation coverage changes, and constructed a model of the impact of multiple meteorological elements on the growing season vegetation coverage based on random forest. The model can better simulate the vegetation coverage in 2017 and 2018, with an average error of 0.027, in consequence it can well forecast whether the vegetation is high-density or low-density in this area. Correlation analysis and variable importance show that the critical meteorological factors affecting vegetation cover change are relative humidity and sunshine hours, accounting for 73% of the vegetation coverage area. The results are helpful to understand how meteorological factors affect the vegetation coverage, and then provide a theoretical reference for the construction of ecological security in Xinjiang.

| [1] |
N. Skiter, A. F. Rogachev, T. I. Mazaeva, Modeling ecological security of a state, Mediter. J. Soc. Sci., 6 (2015), 185–192. https://doi.org/10.5901/mjss.2015.v6n3s6p185 doi: 10.5901/mjss.2015.v6n3s6p185

|
| [2] |
R. J. Nicholls, A. Cazenave, Sea-level rise and its impact on coastal zones, Science, 328 (2010), 1517–1520. https://doi.org/10.1126/science.1185782 doi: 10.1126/science.1185782
|
| [3] |
L. Javaid, Climate change: Melting glaciers bring energy uncertainty, Nature, 502 (2013), 617–618. https://doi.org/10.1038/502617a doi: 10.1038/502617a
|
| [4] |
K. E. Trenberth, A. Dai, G. V. Schrier, P. D. Jones, J. Barichivich, K. R. Briffa, et al., Global warming and changes in drought, Nat. Clim. Change, 4 (2014), 17–22. https://doi.org/10.1038/NCLIMATE2067 doi: 10.1038/NCLIMATE2067
|
| [5] |
A. Dai, Drought under global warming: a review, Wiley Interdiscip. Rev. Clim. Change, 2 (2011), 45–65. https://doi.org/10.1002/wcc.81 doi: 10.1002/wcc.81
|
| [6] |
A. Dai, Increasing drought under global warming in observations and models, Nat. Clim. Change, 3 (2013), 52–58. https://doi.org/10.1038/NCLIMATE1633 doi: 10.1038/NCLIMATE1633
|
| [7] |
S. Piao, X. Wang, T. Park, C. Chen, X. Lian, Y. He, et al., Characteristics, drivers and feedbacks of global greening, Nat. Rev. Earth. Env., 1 (2020), 14–27. https://doi.org/10.1038/s43017-019-0001-x doi: 10.1038/s43017-019-0001-x
|
| [8] |
R. M. Deans, T. J. Brodribb, F. A. Busch, G. D. Farquhar., Optimization can provide the fundamental link between leaf photosynthesis, gas exchange and water relations, Nat. Plants, 6 (2020), 1116–1125. https://doi.org/10.1038/s41477-020-00760-6 doi: 10.1038/s41477-020-00760-6
|
| [9] |
D. A. Way, Just the right temperature, Nat. Ecol. Evol., 3 (2019), 718–719. https://doi.org/10.1038/s41559-019-0877-3 doi: 10.1038/s41559-019-0877-3
|
| [10] |
S. Levis, J. A. Foley, D. Pollard, Large-scale vegetation feedbacks on a doubled CO2 climate, J. Clim., 13 (2000), 1313–1325. https://doi.org/10.1175/1520-0442 doi: 10.1175/1520-0442
|
| [11] |
T. G. Yun, J. Bae, A. Rothschild, I. Kim, Transpiration driven electrokinetic power generator, ACS Nano, 13 (2019), 12703–12709. https://doi.org/10.1021/acsnano.9b04375 doi: 10.1021/acsnano.9b04375
|
| [12] |
S. Jasechko, Z. D. Sharp, J. J. Gibson, S. J. Birks, Y. Yi, P. J. Fawcett, Terrestrial water fluxes dominated by transpiration, Nature, 496 (2013), 347–350. https://doi.org/10.1038/nature11983 doi: 10.1038/nature11983
|
| [13] |
O. K. Atkin, D. Bruhn, V. Hurry, M. G. Tjoelker, The hot and the cold: unravelling the variable response of plant respiration to temperature, Funct. Plant Biol., 32 (2005), 87–105. https://doi.org/10.1071/FP03176 doi: 10.1071/FP03176
|
| [14] |
R. Nemani, C. Keeling, H. Hashimoto, W. Jolly, S. Piper, C. Tucker, et al., Climate-driven increases in global terrestrial net primary production from 1982 to 1999, Science, 300 (2003), 1560–1563. https://doi.org/10.1126/science.1082750 doi: 10.1126/science.1082750
|
| [15] |
L. Zhao, A. Dai, B. Dong, Changes in global vegetation activity and its driving factors during 1982–2013, Agric. For. Meteorol., 249 (2018), 198–209. https://doi.org/10.1016/j.agrformet.2017.11.013 doi: 10.1016/j.agrformet.2017.11.013
|
| [16] |
L. Zhou, C. J. Tucker, R. K. Kaufmann, D. Slayback, N. V. Shabanov, R. B. Myneni, Variations in northern vegetation activity inferred from satellite data of vegetation index during 1981 to 1999, J. Geophys. Res. Atmos., 106 (2001), 20069–20083. https://doi.org/10.1029/2000JD000115 doi: 10.1029/2000JD000115
|
| [17] |
Y. Shi, N. Jin, X. Ma, B. Wu, Q. He, C. Yue et al., Attribution of climate and human activities to vegetation change in China using machine learning techniques, Agr. For. Meteorol., 294 (2020), 108146. https://doi.org/10.1016/j.agrformet.2020.108146 doi: 10.1016/j.agrformet.2020.108146
|
| [18] |
A. Kawabata, K. Ichii, Y. Yamaguchi, Global monitoring of interannual changes in vegetation activities using NDVI and its relationships to temperature and precipitation, Int. J. Remote Sens., 22 (2001), 1377–1382. https://doi.org/10.1080/01431160119381 doi: 10.1080/01431160119381
|
| [19] |
Y. Zheng, J. Han, Y. Huang, S. R. Fassnacht, S. Xie, E. Lv, et al., Vegetation response to climate conditions based on NDVI simulations using stepwise cluster analysis for the three-river headwaters region of China, Ecol. Indic., 92 (2018), 18–29. https://doi.org/10.1016/j.ecolind.2017.06.040 doi: 10.1016/j.ecolind.2017.06.040
|
| [20] | H. E. Beck, N. E. Zimmermann, T. R. McVicar, N. Vergopolan, A. Berg, E. F. Wood, Present and future koppen-geiger climate classification maps at 1-km resolution, Sci. Data, 5 (2018). https://doi.org/10.1038/sdata.2018.214 |
| [21] |
X. Wang, S. Piao, P. Ciais, J. Li, P. Friedlingstein, C. D. Koven, et al., Spring temperature change and its implication in the change of vegetation growth in North America from 1982 to 2006, Proc. Natl. Acad. Sci. U. S. A., 108 (2011), 1240–1245. https://doi.org/10.1073/pnas.1014425108 doi: 10.1073/pnas.1014425108
|
| [22] |
M. Li, J. Du, W. Li, R. Li, S. Wu, S. Wang, Global vegetation change and its relationship with precipitation and temperature based on glass-LAI in 1982-2015, Sci. Geogr. Sin., 40 (2020), 823–832. https://doi.org/10.13249/j.cnki.sgs.2020.05.017 doi: 10.13249/j.cnki.sgs.2020.05.017
|
| [23] |
R. Fensholt, T. Langanke, K. Rasmussen, A. Reenberg, S. D. Prince, C. Tucker, et al., Greenness in semi-arid areas across the globe 1981–2007–-an Earth Observing Satellite based analysis of trends and drivers, Remote Sens. Environ., 121 (2012), 144–158. https://doi.org/10.1016/j.rse.2012.01.017 doi: 10.1016/j.rse.2012.01.017
|
| [24] |
X. Chuai, X. Huang, W. Wang, G. Bao, NDVI, temperature and precipitation changes and their relationships with different vegetation types during 1998–2007 in Inner Mongolia, China, Int. J. Climatol., 33 (2013), 1696–1706. https://doi.org/10.1002/joc.3543 doi: 10.1002/joc.3543
|
| [25] |
J. L. Weiss, D. S. Gutzler, J. E. A. Coonrod, C.N. Dahm, Seasonal and inter-annual relationships between vegetation and climate in central New Mexico, USA, J. Arid Environ., 57 (2004), 507–534. https://doi.org/10.1016/S0140-1963(03)00113-7 doi: 10.1016/S0140-1963(03)00113-7
|
| [26] |
T. Hickler, L. Eklundh, J. W. Seaquist, B. Smith, J. Ard |
| [27] |
X. Zhao, K. Tan, S. Zhao, J. Feng, Changing climate affects vegetation growth in the arid region of the northwestern China, J. Arid Environ., 75 (2011), 946–952. https://doi.org/10.1016/j.jaridenv.2011.05.007 doi: 10.1016/j.jaridenv.2011.05.007
|
| [28] |
H. Bai, Z. Gong, G. Q. Sun, L. Li, L. Zhou, Influence of meteorological elements on summer vegetation coverage in North China, Chin. J. Atmos. Sci., 46 (2022), 1–13. https://doi.org/10.3878/j.issn.1006-9895.2102.20233 doi: 10.3878/j.issn.1006-9895.2102.20233
|
| [29] |
H. Bai, Z. Gong, G. Q. Sun, L. Li, Data-driven artificial intelligence model of meteorological elements influence on vegetation coverage in North China, Remote Sens., 14 (2022), 1307. https://doi.org/10.3390/rs14061307 doi: 10.3390/rs14061307
|
| [30] |
M. Hulme, Recent climatic change in the world's drylands, Geophys. Res. Lett., 23 (1996), 61–64. https://doi.org/10.1029/95GL03586 doi: 10.1029/95GL03586
|
| [31] |
M. Ji, J. Huang, Y. Xie, J. Liu, Comparison of dryland climate change in observations and CMIP5 simulations, Adv. Atmos. Sci., 32 (2015), 1565–1574. https://doi.org/10.1007/s00376-015-4267-8 doi: 10.1007/s00376-015-4267-8
|
| [32] |
S. Feng, Q. Fu, Expansion of global drylands under a warming climate, Atmos. Chem. Phys., 13 (2013), 10081–10094. https://doi.org/10.5194/acp-13-10081-2013 doi: 10.5194/acp-13-10081-2013
|
| [33] |
J. Huang, Y. Li, C. Fu, F. Chen, Q. Fu, A. Dai, et al., Dryland climate change: Recent progress and challenges, Rev. Geophys., 55 (2017), 719–778. https://doi.org/10.1002/2016RG000550 doi: 10.1002/2016RG000550
|
| [34] |
F. T. Maestre, C. Escolar, M. L. de Guevara, J. L. Quero, R. Lázaro, M. Delgado‐Baquerizo, et al., Changes in biocrust cover drive carbon cycle responses to climate change in drylands, Global Change Biol., 19 (2013), 3835–3847. https://doi.org/10.1111/gcb.12306 doi: 10.1111/gcb.12306
|
| [35] |
R. P. Motha, W. Baier, Impacts of present and future climate change and climate variability on agriculture in the temperate regions: North America, Clim. Change, 70 (2005), 137–164. https://doi.org/10.1007/s10584-005-5940-1 doi: 10.1007/s10584-005-5940-1
|
| [36] |
M. Rietkerk, S. C. Dekker, P. C. de Ruiter, J. van de Koppel, Self-organized patchiness and catastrophic shifts in ecosystems, Science, 305 (2004), 1926–1929. https://doi.org/10.1126/science.1101867 doi: 10.1126/science.1101867
|
| [37] |
C. Ryan, P. Elsner, The potential for sand dams to increase the adaptive capacity of East African drylands to climate change, Reg. Environ. Change, 16 (2016), 2087–2096. https://doi.org/10.1007/s10113-016-0938-y doi: 10.1007/s10113-016-0938-y
|
| [38] | G. Lischeid, A decision support system for mountain basin management using sparse data, Geophys. Res. Abstr., 8 (2006), 04223. https://doi.org/10.1007/s11269-008-9339-4 |
| [39] | R. Wang, Y. Ma, Coupling relation among substance and energy as well as information in mountain-basin system in arid zone, J. Mt. Sci. Engl., 19 (2001), 5. |
| [40] |
Z. Wu, H. Zhang, C. M. Krause, N. S. Cobb, Climate change and human activities: a case study in Xinjiang, China, Clim. Change, 99 (2010), 457–472. https://doi.org/10.1007/s10584-009-9760-6 doi: 10.1007/s10584-009-9760-6
|
| [41] | Z. Gong, S. Zhao, J. Gu, Correlation analysis between vegetation coverage and climate drought conditions in North China during 2001–2013, J. Geogr. Sci., 27 (2016), 143–160. https://doi.org/0.1007/s11442-017-1369-5 |
| [42] |
C. Chen, B. He, L. Guo, Y. Zhang, X. Xie, Z. Chen, Identifying critical climate periods for vegetation growth in the Northern Hemisphere, J. Geophys. Res.-Biogeo., 123 (2018), 2541–2552. https://doi.org/10.1029/2018JG004443 doi: 10.1029/2018JG004443
|
| [43] | Z. Zhou, Ensemble methods: Foundations and algorithms, 2012. |
| [44] | L. Breiman, Random forests, Mach. Learn., 45 (2004), 5–32. https://doi.org/10.1023/A:1010933404324 |
| [45] |
Q. Zhuang, S. Wu, X. Y. Feng, Y. Niu, Analysis and prediction of vegetation dynamics under the background of climate change in Xinjiang, China, PeerJ, 8 (2020), e8282. https://doi.org/10.7717/peerj.8282 doi: 10.7717/peerj.8282
|
| [46] |
Z. Zhu, S. Piao, R. B. Myneni, M. Huang, Z. Zeng, J. G. Canadell, et al., Greening of the earth and its drivers, Nat. Clim. Change, 6 (2016), 791–795. https://doi.org/10.1038/nclimate3004 doi: 10.1038/nclimate3004
|
| [47] | J. Li, G. Q. Sun, Z. Jin, Interactions of time delay and spatial diffusion induce the periodic oscillation of the vegetation system, Discrete Cont. Dyn.-B., 2147–2172. https://doi.org/10.3934/dcdsb.2021127 |
| [48] |
J. Li, G. Q. Sun, Z. G. Guo, Bifurcation analysis of an extended klausmeier–gray–scott model with infiltration delay, Stud. Appl. Math., 148 (2022), 1519–1542. https://doi.org/10.1111/sapm.12482 doi: 10.1111/sapm.12482
|
| [49] |
G. Q. Sun, H. T. Zhang, Y. L. Song, L. Li, Z. Jin, Dynamic analysis of a plant-water model with spatial diffusion, J. Differ. Equations, 329 (2022), 395–430. https://doi.org/10.1016/j.jde.2022.05.009 doi: 10.1016/j.jde.2022.05.009
|


Figures(9) / Tables(2)
Huimin Bai, Li Li, Yongping Wu, Chen Liu, Zhiqiang Gong, Guolin Feng, Gui-Quan Sun. Study on the influence of meteorological elements on growing season vegetation coverage in Xinjiang, China[J]. Electronic Research Archive, 2022, 30(9): 3463-3480. doi: 10.3934/era.2022177


 DownLoad: