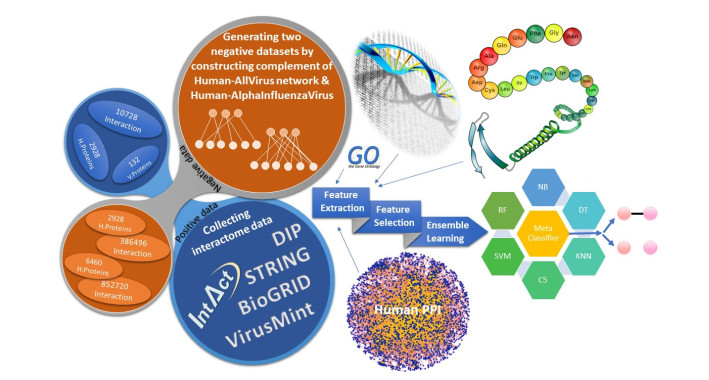
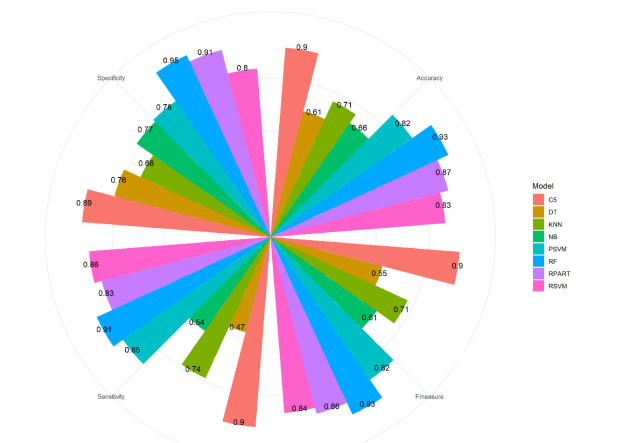
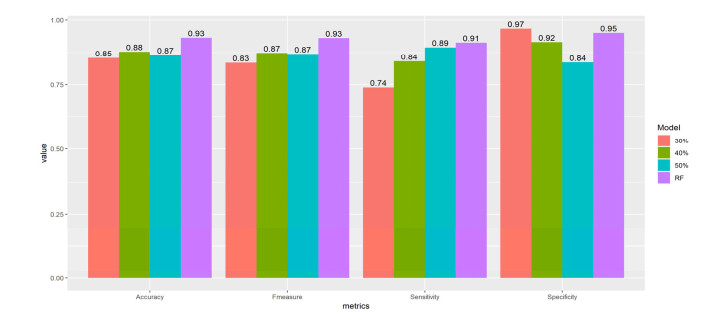
More than ten million deaths make influenza virus one of the deadliest of history. About half a million sever illnesses are annually reported consequent of influenza. Influenza is a parasite which needs the host cellular machinery to replicate its genome. To reach the host, viral proteins need to interact with the host proteins. Therefore, identification of host-virus protein interaction network (HVIN) is one of the crucial steps in treating viral diseases. Being expensive, time-consuming and laborious of HVIN experimental identification, force the researches to use computational methods instead of experimental ones to obtain a better understanding of HVIN. In this study, several features are extracted from physicochemical properties of amino acids, combined with different centralities of human protein-protein interaction network (HPPIN) to predict protein-protein interactions between human proteins and Alphainfluenzavirus proteins (HI-PPIs). Ensemble learning methods were used to predict such PPIs. Our model reached 0.93 accuracy, 0.91 sensitivity and 0.95 specificity. Moreover, a database including 694522 new PPIs was constructed by prediction results of the model. Further analysis showed that HPPIN centralities, gene ontology semantic similarity and conjoint triad of virus proteins are the most important features to predict HI-PPIs.
Citation: Babak Khorsand, Abdorreza Savadi, Javad Zahiri, Mahmoud Naghibzadeh. Alpha influenza virus infiltration prediction using virus-human protein-protein interaction network[J]. Mathematical Biosciences and Engineering, 2020, 17(4): 3109-3129. doi: 10.3934/mbe.2020176
More than ten million deaths make influenza virus one of the deadliest of history. About half a million sever illnesses are annually reported consequent of influenza. Influenza is a parasite which needs the host cellular machinery to replicate its genome. To reach the host, viral proteins need to interact with the host proteins. Therefore, identification of host-virus protein interaction network (HVIN) is one of the crucial steps in treating viral diseases. Being expensive, time-consuming and laborious of HVIN experimental identification, force the researches to use computational methods instead of experimental ones to obtain a better understanding of HVIN. In this study, several features are extracted from physicochemical properties of amino acids, combined with different centralities of human protein-protein interaction network (HPPIN) to predict protein-protein interactions between human proteins and Alphainfluenzavirus proteins (HI-PPIs). Ensemble learning methods were used to predict such PPIs. Our model reached 0.93 accuracy, 0.91 sensitivity and 0.95 specificity. Moreover, a database including 694522 new PPIs was constructed by prediction results of the model. Further analysis showed that HPPIN centralities, gene ontology semantic similarity and conjoint triad of virus proteins are the most important features to predict HI-PPIs.

| [1] |
J. M. Langley, M. E. Faughnan, Prevention of influenza in the general population, Can. Med. Assoc. J., 171 (2004), 1213-1222. doi: 10.1503/cmaj.1031737

|
| [2] |
W. W. Thompson, D. K. Shay, E. Weintraub, L. Brammer, C. B. Bridges, et al., Influenza-associated hospitalizations in the United States, J. Am. Med. Assoc., 292 (2004), 1333-1340. doi: 10.1001/jama.292.11.1333
|
| [3] |
J. K. Taubenberger, D. M. Morens, The pathology of influenza virus infections, Annu. Rev. Pathol. Mech. Dis., 3 (2008), 499-522. doi: 10.1146/annurev.pathmechdis.3.121806.154316
|
| [4] |
A. Nagy, L. Černíková, V. Křivda, J. Horníčková, Digital genotyping of avian influenza viruses of H7 subtype detected in central Europe in 2007-2011, Virus Res., 165 (2012), 126-133. doi: 10.1016/j.virusres.2012.02.005
|
| [5] | Q Li, L Zhou, M Zhou, Z Chen, F Li, H Wu, et al., Preliminary report: Epidemiology of the avian influenza A (H7N9) outbreak in China, N. Engl. J. Med., 24 (2013), xi-xii. |
| [6] |
Y. Hu, S. Lu, Z. Song, W. Wang, P. Hao, J. Li, et al., Association between adverse clinical outcome in human disease caused by novel influenza A H7N9 virus and sustained viral shedding and emergence of antiviral resistance, Lancet, 381 (2013), 2273-2279. doi: 10.1016/S0140-6736(13)61125-3
|
| [7] |
G. Neumann, T. Noda, Y. Kawaoka, Emergence and pandemic potential of swine-origin H1N1 influenza virus, Nature, 459 (2009), 931-939. doi: 10.1038/nature08157
|
| [8] | G. Lu, K. Buyyani, N. Goty, R. Donis, Z. Chen, Influenza a virus informatics: Genotype-centered database and genotype annotation, Second International Multi-Symposiums on Computer and Computational Sciences (IMSCCS 2007), 2007. Available from: https://ieeexplore.ieee.org/abstract/document/4392583. |
| [9] |
A. Melidou, G. Gioula, M. Exindari, D. Chatzidimitriou, E. Diza, N. Malisiovas, Molecular and phylogenetic analysis of the haemagglutinin gene of pandemic influenza H1N1 2009 viruses associated with severe and fatal infections, Virus Res., 151 (2010), 192-199. doi: 10.1016/j.virusres.2010.05.005
|
| [10] |
E. D. Kilbourne, Influenza pandemics of the 20th century, Emerg. Infect. Dis., 12 (2006), 9. doi: 10.3201/eid1201.051254
|
| [11] | W. H. Organization, Ten things you need to know about pandemic influenza (update of 14 October 2005), Wkly. Epidemiol. Rec., 80 (2005), 428-431. |
| [12] |
D. J. Smith, A. S. Lapedes, J. C. de Jong, T. M. Bestebrore, G. F. Rimmelzwaan, A. D. Osterhaus, et al., Mapping the antigenic and genetic evolution of influenza virus, Science, 305 (2004), 371-376. doi: 10.1126/science.1097211
|
| [13] |
J. K. Taubenberger, D. M. Morens, 1918 Influenza: the mother of all pandemics, Rev. Biomed., 17 (2006), 69-79. doi: 10.32776/revbiomed.v17i1.440
|
| [14] | A Patient, Swine influenza A (H1N1) infection in two children-Southern California, March-April 2009, Morb. Mortal. Wkly. Rep., 58 (2009), 400-402. |
| [15] |
M. P. Girard, J. S. Tam, O. M. Assossou, M. P. Kieny, The 2009 A (H1N1) influenza virus pandemic: A review, Vaccine, 28 (2010), 4895-4902. doi: 10.1016/j.vaccine.2010.05.031
|
| [16] | E. Golemis, Protein-protein interactions: A molecular cloning manual, CSHL Press, (2005). |
| [17] |
C. D. Hu, Y. Chinenov, T. K. Kerppola, Visualization of interactions among bZIP and Rel family proteins in living cells using bimolecular fluorescence complementation, Mol. Cell, 9 (2002), 789-798. doi: 10.1016/S1097-2765(02)00496-3
|
| [18] |
E. Sprinzak, H. Margalit, Correlated sequence-signatures as markers of protein-protein interaction11Edited by G. von Heijne, J. Mol. Biol., 311 (2001), 681-692. doi: 10.1006/jmbi.2001.4920
|
| [19] | W. K. Kim, J. Park, J. K. Suh, Large scale statistical prediction of protein-protein interaction by potentially interacting domain (PID) pair., Genome Inform., 13 (2002) 42-50. |
| [20] |
S. K. Ng, Z. Zhang, S. H. Tan, Integrative approach for computationally inferring protein domain interactions, Bioinformatics, 19 (2003), 923-929. doi: 10.1093/bioinformatics/btg118
|
| [21] |
H. Yu, N. M. Luscombe, H. X. Lu, X. Zhu, Y. Xia, J. D. Han, et al., Annotation transfer between genomes: protein-protein interologs and protein-DNA regulogs, Genome Res., 14 (2004), 1107-1118. doi: 10.1101/gr.1774904
|
| [22] |
L. V Zhang, S. L. Wong, O. D. King, F. P. Roth, Predicting co-complexed protein pairs using genomic and proteomic data integration, BMC Bioinformatics, 5 (2004), 38. doi: 10.1186/1471-2105-5-38
|
| [23] |
R. Jansen, H. Yu, D. Greenbaum, Y. Kluger, N. J. Krogan, S. Chung, et al., A Bayesian networks approach for predicting protein-protein interactions from genomic data, Science, 302 (2003), 449-453. doi: 10.1126/science.1087361
|
| [24] |
Y. Qi, Z. Bar‐Joseph, J. Klein‐Seetharaman, Evaluation of different biological data and computational classification methods for use in protein interaction prediction, Proteins Struct. Funct. Bioinforma., 63 (2006), 490-500. doi: 10.1002/prot.20865
|
| [25] |
M. D. Dyer, T. M. Murali, B. W. Sobral, Computational prediction of host-pathogen protein-protein interactions, Bioinformatics, 23 (2007), 159-166. doi: 10.1093/bioinformatics/btm208
|
| [26] |
A. Emamjomeh, B. Goliaei, J. Zahiri, R. Ebrahimpour, Predicting protein-protein interactions between human and hepatitis C virus via an ensemble learning method, Mol Biosyst, 10 (2014), 3147-3154. doi: 10.1039/C4MB00410H
|
| [27] | O. Tastan, Y. Qi, J. G. Carbonell, J. Klein-Seetharaman, Prediction of interactions between HIV-1 and human proteins by information integration, in Biocomputing, World Scientific, (2009), 516-527. |
| [28] |
Y. Qi, O. Tastan, J. G. Carbonell, J. Klein-Seetharaman, J. Weston, Semi-supervised multi-task learning for predicting interactions between HIV-1 and human proteins, Bioinformatics, 26 (2010), i645-i652. doi: 10.1093/bioinformatics/btq394
|
| [29] | B. Barnes, M. Karimloo, A. Schoenrock, D. Burnside, E. Cassol, A. Wong, et al., Predicting novel protein-protein interactions between the HIV-1 virus and homo sapiens, 2016 IEEE EMBS International Student Conference (ISC), 2016. Available from: https://ieeexplore.ieee.org/abstract/document/7508598/. |
| [30] | S. Alguwaizani, B. Park, X. Zhou, D. S. Huang, K. Han, Predicting Interactions between Virus and Host Proteins Using Repeat Patterns and Composition of Amino Acids, J. Healthc. Eng., 2018 (2018). |
| [31] | N. Zhang, M. Jiang, T. Huang, Y. D. Cai, Identification of Influenza A/H7N9 virus infection-related human genes based on shortest paths in a virus-human protein interaction network, Biomed. Res. Int., 2014 (2014). |
| [32] |
Gene Ontology Consortium, The Gene Ontology (GO) database and informatics resource, Nucleic Acids Res., 32 (2004), D258-D261. doi: 10.1093/nar/gkh036
|
| [33] | C. L. P. Eng, J. C. Tong, T. W. Tan, Predicting host tropism of influenza A virus proteins using random forest, BMC Med. Genomics, 7 (2014), S1. |
| [34] | L. Nanni, A. Lumini, S. Brahnam, An Empirical Study of Different Approaches for Protein Classification, Sci. World J., 2014 (2014), 236717. |
| [35] |
E. I. Zacharaki, Prediction of protein function using a deep convolutional neural network ensemble, PeerJ Comput. Sci., 3 (2017), e124. doi: 10.7717/peerj-cs.124
|
| [36] |
I. Saha, J. Zubek, T. Klingstrom, S. Forsberg, J. Wikander, M. Kierczak, et al., Ensemble learning prediction of protein-protein interactions using proteins functional annotations, Mol. Biosyst., 10 (2014), 820-830. doi: 10.1039/c3mb70486f
|
| [37] | L. Nanni, S. Brahnam, S. Ghidoni, A. Lumini, Toward a general-purpose heterogeneous ensemble for pattern classification, Comput. Intell. Neurosci., 2015 (2015). |
| [38] | S. Kerrien, B. Aranda, L. Breuza, A. Bridge, F. Broackes-Carter, C. Chen, et al., The IntAct molecular interaction database in 2012, Nucleic Acids Res., 40 (2011), D841-D846. |
| [39] |
A. Chatr-aryamontri, A. Ceol, D. Peluso, A. Nardozza, S. Panni, F. Sacco, et al., VirusMINT: A viral protein interaction database, Nucleic Acids Res., 37 (2009), D669-D673. doi: 10.1093/nar/gkn739
|
| [40] |
I. Xenarios, L. Salwinski, X. J. Duan, P. Higney, S. M. Kim, D. Eisenberg, DIP, the Database of Interacting Proteins: a research tool for studying cellular networks of protein interactions, Nucleic Acids Res., 30 (2002), 303-305. doi: 10.1093/nar/30.1.303
|
| [41] | D. Szklarczyk, A. Franceschini, S. Wyder, K. Forslund, D. Heller, J. Huerta-Cepas, et al., STRING v10: protein-protein interaction networks, integrated over the tree of life, Nucleic Acids Res., 43 (2014), D447-D452. |
| [42] |
C. Stark, B. J. Breitkreutz, T. Reguly, L. Boucher, A. Breitkreutz, M. Tyers, BioGRID: A general repository for interaction datasets, Nucleic Acids Res., 34 (2006), D535-D539. doi: 10.1093/nar/gkj109
|
| [43] |
J. Yu, M. Guo, C. J. Needham, Y. Huang, L. Cai, D. R. Westhead, Simple sequence-based kernels do not predict protein-protein interactions, Bioinformatics, 26 (2010), 2610-2614. doi: 10.1093/bioinformatics/btq483
|
| [44] |
Y. Huang, B. Niu, Y. Gao, L. Fu, W. Li, CD-HIT Suite: A web server for clustering and comparing biological sequences, Bioinformatics, 26 (2010), 680-682. doi: 10.1093/bioinformatics/btq003
|
| [45] |
M. A. Tahir, J. Kittler, F. Yan, Inverse random under sampling for class imbalance problem and its application to multi-label classification, Pattern Recognit., 45 (2012), 3738-3750. doi: 10.1016/j.patcog.2012.03.014
|
| [46] |
S. Kawashima, P. Pokarowski, M. Pokarowska, A. Kolinski, T. Katayama, M. Kanehisa, AAindex: Amino acid index database, progress report 2008, Nucleic Acids Res, 36 (2008) D202-205. doi: 10.1093/nar/gkn255
|
| [47] | R. Bellman, R. Corporation, Dynamic Programming, Princeton University Press, (1957). |
| [48] |
A. Wagner, Energy constraints on the evolution of gene expression, Mol. Biol. Evol., 22 (2005), 1365-1374. doi: 10.1093/molbev/msi126
|
| [49] |
P. M. Sharp, T. M. Tuohy, K. R. Mosurski, Codon usage in yeast: Cluster analysis clearly differentiates highly and lowly expressed genes., Nucleic Acids Res., 14 (1986), 5125-5143. doi: 10.1093/nar/14.13.5125
|
| [50] |
P. M. Sharp, W. H. Li, The codon Adaptation Index--a measure of directional synonymous codon usage bias, and its potential applications, Nucleic Acids Res., 15 (1987), 1281-1295. doi: 10.1093/nar/15.3.1281
|
| [51] |
J. SantaLucia, A unified view of polymer, dumbbell, and oligonucleotide DNA nearest-neighbor thermodynamics, Proc. Natl. Acad. Sci., 95 (1998), 1460-1465. doi: 10.1073/pnas.95.4.1460
|
| [52] |
P. Claverie, Calculation of interaction energy between triplets in the RNA 11 configuration, J. Mol. Biol., 56 (1971), 75-82. doi: 10.1016/0022-2836(71)90085-4
|
| [53] |
B. Lee, F. M. Richards, The interpretation of protein structures: estimation of static accessibility, J. Mol. Biol., 55 (1971), 379-IN4. doi: 10.1016/0022-2836(71)90324-X
|
| [54] |
P. Klein, M. Kanehisa, C. DeLisi, Prediction of protein function from sequence properties: Discriminant analysis of a data base, Biochim. Biophys. Acta, Protein Struct. Mol. Enzymol., 787 (1984) 221-226. doi: 10.1016/0167-4838(84)90312-1
|
| [55] |
Y. Guo, L. Yu, Z. Wen, M. Li, Using support vector machine combined with auto covariance to predict protein-protein interactions from protein sequences, Nucleic Acids Res., 36 (2008), 3025-3030. doi: 10.1093/nar/gkn159
|
| [56] |
X. Wu, E. Pang, K. Lin, Z. M. Pei, Improving the Measurement of Semantic Similarity between Gene Ontology Terms and Gene Products: Insights from an Edge- and IC-Based Hybrid Method, PLoS One, 8 (2013), e66745. doi: 10.1371/journal.pone.0066745
|
| [57] |
Y. R. Cho, W. Hwang, M. Ramanathan, A. Zhang, Semantic integration to identify overlapping functional modules in protein interaction networks, BMC Bioinformatics, 8 (2007) 265. doi: 10.1186/1471-2105-8-265
|
| [58] | P. Resnik, Using information content to evaluate semantic similarity in a taxonomy, arXiv Prepr. C., 1995 (1995). |
| [59] | J. J. Jiang, D. W. Conrath, Semantic similarity based on corpus statistics and lexical taxonomy, arXiv Prepr. C., 1997 (1997). |
| [60] | D. Lin, An information-theoretic definition of similarity, Icml, 98 (1998) 296-304. |
| [61] |
D. H. Wolpert, Stacked Generalization, Neural Networks, 5 (1992), 241-259. doi: 10.1016/S0893-6080(05)80023-1
|
| [62] | B. Khorsand, EvaluationMeasures: Collection of Model Evaluation Measure Functions, CRAN, 2016 (2016). |
| [63] |
D. W. Huang, B. T. Sherman, R. A. Lempicki, Systematic and integrative analysis of large gene lists using DAVID bioinformatics resources, Nat. Protoc., 4 (2009), 44-57. doi: 10.1038/nprot.2008.211
|
| [64] |
F. Supek, M. Bošnjak, N. Škunca, T. Šmuc, REVIGO summarizes and visualizes long lists of gene ontology terms, PLoS One, 6 (2011), e21800. doi: 10.1371/journal.pone.0021800
|
| [65] |
H. Hotelling, Analysis of a complex of statistical variables into principal components, J. Educ. Psychol., 24 (1933), 417. doi: 10.1037/h0071325
|
| [66] |
R. Leardi, A. L. Gonzalez, Genetic algorithms applied to feature selection in PLS regression: how and when to use them, Chemom. Intell. Lab. Syst., 41 (1998), 195-207. doi: 10.1016/S0169-7439(98)00051-3
|
Figures(9) / Tables(1)

Babak Khorsand, Abdorreza Savadi, Javad Zahiri, Mahmoud Naghibzadeh. Alpha influenza virus infiltration prediction using virus-human protein-protein interaction network[J]. Mathematical Biosciences and Engineering, 2020, 17(4): 3109-3129. doi: 10.3934/mbe.2020176


 DownLoad: