Research article Special Issues

Effects of urban green areas on air temperature in a medium-sized Argentinian city

  • Urban climate is the result of both atmospheric and geographic factors affecting a region, as well as the morphology, structures and human activities in a city. Urban vegetation in particular affects this climate at a local scale and provides many other social, economic and ecological benefits. Thus, it is important to explore the effects of different green areas used for urban and periurban agriculture and forestry activities (UPAF) on daily atmospheric temperature and the required degrees of cooling or refrigerating temperature. Comfort temperatures were defined using a range 18-24°C and analyzed using actual measured as well as forecasted temperatures using a future scenario. Actual temperatures were recorded from September 2013 to August 2014 using digital sensors across eight sites in Rosario, Argentina: three in the central core with no vegetation, one in the central core with street trees, one in an urban agriculture site, one in a public park and two in periurban agricultural areas. Results show that air temperature in the central core with no vegetation were higher than those in other sites with vegetation during day and night, with the exception of the temperatures measured at the central core site with street trees. Findings also show that temperature effects in urban agricultural gardens of approximately 0.2 ha were similar to those of gardens and public parks 2-3 ha in size. Three UPAF types were classified according to cooling degree days, which decreased in order from (1) central core with no trees; (2) central core with street trees and public parks; and (3) urban and periurban agriculture areas. Conversely, the opposite trends for heating degree days were found. Results from this study can be used for integrating UPAF measures into climate change mitigation and urban planning policies in medium-sized cities in the developing world.

    Citation: Alejandra S. Coronel, Susana R. Feldman, Emliano Jozami, Kehoe Facundo, Rubén D. Piacentini, Marielle Dubbeling, Francisco J. Escobedo. Effects of urban green areas on air temperature in a medium-sized Argentinian city[J]. AIMS Environmental Science, 2015, 2(3): 803-826. doi: 10.3934/environsci.2015.3.803

    Related Papers:

    [1] Alessio Russo, Francisco J Escobedo, Stefan Zerbe . Quantifying the local-scale ecosystem services provided by urban treed streetscapes in Bolzano, Italy. AIMS Environmental Science, 2016, 3(1): 58-76. doi: 10.3934/environsci.2016.1.58
    [2] Mary Thornbush . Urban greening for low carbon cities—introduction to the special issue. AIMS Environmental Science, 2016, 3(1): 133-139. doi: 10.3934/environsci.2016.1.133
    [3] Mary Thornbush . Urban agriculture in the transition to low carbon cities through urban greening. AIMS Environmental Science, 2015, 2(3): 852-867. doi: 10.3934/environsci.2015.3.852
    [4] Dominic Bowd, Campbell McKay, Wendy S. Shaw . Urban greening: environmentalism or marketable aesthetics. AIMS Environmental Science, 2015, 2(4): 935-949. doi: 10.3934/environsci.2015.4.935
    [5] Jian Zhang, Zhonghua Gou, Leigh Shutter . Effects of internal and external planning factors on park cooling intensity: field measurement of urban parks in Gold Coast, Australia. AIMS Environmental Science, 2019, 6(6): 417-434. doi: 10.3934/environsci.2019.6.417
    [6] Dong Chen, Marcus Thatcher, Xiaoming Wang, Guy Barnett, Anthony Kachenko, Robert Prince . Summer cooling potential of urban vegetation—a modeling study for Melbourne, Australia. AIMS Environmental Science, 2015, 2(3): 648-667. doi: 10.3934/environsci.2015.3.648
    [7] Ian C. Mell . Establishing the rationale for green infrastructure investment in Indian cities: is the mainstreaming of urban greening an expanding or diminishing reality?. AIMS Environmental Science, 2015, 2(2): 134-153. doi: 10.3934/environsci.2015.2.134
    [8] Vanessa Duarte Pinto, Catarina Martins, José Rodrigues, Manuela Pires Rosa . Improving access to greenspaces in the Mediterranean city of Faro. AIMS Environmental Science, 2020, 7(3): 226-246. doi: 10.3934/environsci.2020014
    [9] Luke Drake, Beth Ravit, Iana Dikidjieva, Laura J. Lawson . Urban greening supported by GIS: from data collection to policy implementation. AIMS Environmental Science, 2015, 2(4): 910-934. doi: 10.3934/environsci.2015.4.910
    [10] Jana Söderlund, Peter Newman . Biophilic architecture: a review of the rationale and outcomes. AIMS Environmental Science, 2015, 2(4): 950-969. doi: 10.3934/environsci.2015.4.950
  • Urban climate is the result of both atmospheric and geographic factors affecting a region, as well as the morphology, structures and human activities in a city. Urban vegetation in particular affects this climate at a local scale and provides many other social, economic and ecological benefits. Thus, it is important to explore the effects of different green areas used for urban and periurban agriculture and forestry activities (UPAF) on daily atmospheric temperature and the required degrees of cooling or refrigerating temperature. Comfort temperatures were defined using a range 18-24°C and analyzed using actual measured as well as forecasted temperatures using a future scenario. Actual temperatures were recorded from September 2013 to August 2014 using digital sensors across eight sites in Rosario, Argentina: three in the central core with no vegetation, one in the central core with street trees, one in an urban agriculture site, one in a public park and two in periurban agricultural areas. Results show that air temperature in the central core with no vegetation were higher than those in other sites with vegetation during day and night, with the exception of the temperatures measured at the central core site with street trees. Findings also show that temperature effects in urban agricultural gardens of approximately 0.2 ha were similar to those of gardens and public parks 2-3 ha in size. Three UPAF types were classified according to cooling degree days, which decreased in order from (1) central core with no trees; (2) central core with street trees and public parks; and (3) urban and periurban agriculture areas. Conversely, the opposite trends for heating degree days were found. Results from this study can be used for integrating UPAF measures into climate change mitigation and urban planning policies in medium-sized cities in the developing world.


    1. Introduction

    Climatic conditions across large areas of the Earth's surface are influenced by atmospheric factors such as solar energy and the Earth's rotation, shape and dimensions. Geographic factors can also affect these dynamics that lead to existing climate variability [1]. At the local scale, the influences of these geographical factors are often more influential, generating microclimates with specific characteristics that differentiate them from overall regional climates. Urban climates can thus be considered a microclimate that results from the combined effect of buildings and human activities that can cause a noticeable effect on the thermal energy dynamics of a city [2]. Considering that approximately 70% of the world population will be living in cities by 2050 [3], and that cities currently consume approximately 75% of the total energy demand [4]; urban climate has been receiving much recent attention by the scientific community. Climate modeling based studies [5] have documented the effect of an increase in extreme events on increases in extreme high temperatures as well as decreases in extreme low temperatures.

    The urban heat island (UHI) effect can be defined as the development of higher temperatures in the city core compared to adjacent rural areas [6], and is considered a unique climatic modification that has resulted as urban areas expand into the adjacent rural countryside. Urban morphology such as impervious area, building height [7] and distances among them [6,8], type of construction materials [9], heat released by human activities per se [6], and topography [10] are the main influences that shape the UHI effect. Given the importance of global warming effects on human well-being [11], awareness of UHI is increasing and is focused on developing local strategies to minimize its effects [12]. Measurement of the UHI is however not trivial since by definition, the meteorological stations are placed mainly in rural areas and few cities in developing countries have available high quality spatial-temporal data required for such studies. Additionally, the higher temperatures within cities increase building cooling energy demand, resulting in higher anthropogenic gas emissions that the most recent Intergovernmental Panel in Climate Change (IPCC) Report containing relevant data for Argentina [11] considers a leading cause of climate change.

    Local urban climate models have been developed by interdisciplinary research teams of meteorologists, built environment and energy scientist, public health specialists, planners, urban and building designers [13], and are becoming useful tools for cities trying to adapt to global warming. In urban subtropical and temperate areas, Fisher et al. [14] described that the UHI effect is most pronounced at night. Possible and unprecedented increases in energy demand in developing countries from the sole use of air conditioning systems have also been reported by Sivak [15]. Elsewhere, analyzing energy consumption and related carbon dioxide (CO2) emissions for heating and cooling of a London UK office building, Kolokotroni et al. [16] concluded that energy cooling demands will cause a five-fold increase by 2050. These temperature effects are not trivial as increased urbanization and temperatures can affect human well-being and periurban ecosystems particularly in developing countries [13,14,17].

    In Argentina, a developing Latin American country, urban climate has been analyzed in several cities. A preliminary analysis conducted in Rosario [18] showed that the UHI effect reached a maximum of 7.3 °C between 07:00 and 08:00 hours in February 1991, with the highest values being related to clear sky conditions and south-southeast winds. Urban heat islands were identified for two contrasting Argentine cities: highly populated Buenos Aires (34°35′S 58°22′W) and less populated Río Gallegos (51°38′S 69°14′W) [19]. Despite being characterized by high vegetation and tree cover in an arid area, the existence of UHI conditions in the medium-sized city of Mendoza (32°53′S; 68°49′W, approximately 115, 000 inhabitants) has been determined [20] as well as in Córdoba, a city of 1.3 million inhabitants and surrounded by small mountains (31°25′S 64°11′W) [21]. In Santa Rosa (36°37′S 64°17′W), a study showed that inhabitants could not live during the summer months with acceptable thermal comfort conditions without some type of energy-based refrigeration [22].

    It is well known that vegetation can mitigate increased urban temperatures in several ways such as: evaporative cooling or the energy used for transpiration instead of heating the air, through shading by trees and tall vegetation that directly shadow and intercept solar radiation and by albedo effects that alter the reflection and absorption of solar radiation [23,24,25]. Although improved urban planning approaches and highly reflective construction materials can be used in building roof and walls to reduce the UHI effect, vegetation management can also reduce the negative effects of increased urban temperatures in cities [24,25]. The physical mechanisms and thermal balances behind these effects are well explained in several studies [7,8,14]. Specifically, vegetation such as agricultural areas, green areas, gardens, parks and grass, shrub and tree cover can reduce the UHI effect [17,24,25].

    The interest in urban agriculture, defined as production of crop and livestock goods within a city's boundaries [26], is growing as a way of addressing urban food security problems [17]. In addition, urban and periurban agriculture and forestry (UPAF), or the management of trees and woody plants in and around cities, are two documented strategies for mitigating climate change effects and for providing other social, economic and environmental co-benefits to society that are referred to as ecosystem services [17,27,28]. But, further research is needed on the role UPAF strategies in developing countries can have on reducing climate change effects and yet provide other co-benefits and ecosystem services. Given the existing and projected effects of urban temperatures and the documented mitigating effects of UPAF on these temperatures; information on this effect is particularly pressing in Latin America. Therefore, the objectives of this study were to use Rosario, Argentina as a case study to: (i) assess the influence of different UPAF types on atmospheric temperature and its role in determining the heating and cooling energy demand and human comfort and (ii) determine increase in heating and cooling energy demand according to future climate projections in the city.

    2. Materials and Methods

    Rosario is Argentina's third most populous city located in a plain along the Paraná River (32°52′18″-33°02′22″S; 60°36′44″-60°47′46″W; 22.5-24.6 m above sea level). There are about 1 million inhabitants within the city limits that encompass 178.69 km2 and another 200, 000 people reside in the periurban areas that together comprise its metropolitan area. The northeast, east and southeast of Rosario's limits (approximately 17 km) are delimited by the Parana River (Figure 1), one of the largest rivers in South America. The river with approximately 60-km wide islands and wetlands along the city, belongs to the Paraná Delta. Rosario's central core area is characterized by narrow streets 7-9 m wide and mostly 4-10 multistory buildings that are likely a major influence on the area's climate characteristics. The modern building construction in the downtown central core area began in the 1960s. This process, which was reduced significantly during the 1970s and 1980s, had new impetus during the last decades, and currently Rosario has an urban area of approximately 120.37 km2, with only 11.27 km2 devoted to green spaces [29].

    Figure 1. Argentina and the location of temperature sensor/ dataloggers within Rosario, Argentina’s 179 km2 city limits.

    Mean, maximum and minimum temperatures and precipitations per season in Rosario are presented in Table 1. Data averages are over 30 years average and were provided by the Servicio Meteorológico Nacional, the Argentinean Meteorological Office [30].

    Table 1. Mean, mean maximum and mean minimum temperatures and mean precipitation of Rosario, Argentina.
    Season Temperature (°C) Precipitation (mm)
    Mean Mean maximum Mean minimum
    Summer 23.8 30.0 17.7 315.7
    Autumn 17.2 23.2 11.9 273.1
    Winter 10.7 16.8 5.5 80.0
    Spring 17.5 23.6 11.4 264.4
     | Show Table
    DownLoad: CSV

    Besides parks, plazas and squares typical of South American cities, Rosario is unique in that some of its parks have been dedicated to urban agriculture activities since 10 years ago and has along tradition of treed streets and parks. These areas are referred to hereafter as UPAF areas. These urban agriculture parks were established and are maintained by technical specialists in the municipality as well as by unemployed citizenry using agro-ecological farming techniques as both sources of food and additional income [31]. Governmental policy support for urban agriculture initiatives were a response to Argentina's 2001 economic crisis, when gross domestic product shrunk and unemployment reached levels of 25%, the rate of inflation climbed to unprecedented levels and the peso, Argentina's currency, lost 75% of its value [32].

    Atmospheric temperatures were measured using Hobo outdoor temperature sensor/ dataloggers (five model #U23-001 and three model #U23-003 units) that were installed in different UPAF types (U1; U2; U3; U4; U5; U6; and U7) as well as in non-UPAF sites (nU1; nU2; and nU3) across Rosario (Figure 1 and Table 2). The sensor/ dataloggers were protected from rain and direct solar radiation by a double wooden structure and located 5 m above the ground that were designed for improving the protection of the instruments against solar radiation, precipitation and strong winds. The U2 and U3 sites as well as U6 and U7 were at the same site. Some sensor/ dataloggers were located beneath tree crowns in direct shade (U3 and U7), while others were outside tree crown in open sunlight (U2 and U6) (Table 2). Measurements were recorded every hour for a full year from September 2013 to August 2014. Instruments were tested and calibrated, and were determined to have a mean error of ± 0.2 °C. Similar approaches have been used in other urban climate studies [33,34], but it is noted that all sensors had the same north-facing direction. Non-UPAF sites were selected in highly populated areas with a heavy traffic flow (mainly cars and buses). Also, in Argentina, the local hour equals Universal Time minus 3 hours.

    Table 2. Details and locations of the analyzed sites in Rosario, Argentina (see Figure 1).
    Site Description
    U1 Periurban agriculture park
    U2 Periurban agriculture park, under a tree
    U3 Periurban agriculture park, 2 m outside tree dripline
    U4 Urban agriculture park
    U5 Under a street tree
    U6 Urban park, under a tree
    U7 Urban park, 2 m outside tree dripline
    nU1 Non-UPAF
    nU2 Non-UPAF
    nU3 Non-UPAF
     | Show Table
    DownLoad: CSV

    The mean, mean maximum and mean minimum temperatures were calculated from the instruments data set on an hourly basis according to the Southern Hemisphere's seasons: spring (September, October and November); summer (January, February and March), autumn (April, May and June) and winter (June, July and August). Temperature range was obtained for each season considering mean maximum and mean minimum data. A t-test was used to determine if there were significant differences between the temperatures under the shaded tree crown at a midway point between tree stem and crown dripline and 2 m outside the tree crown's dripline (U2-U3; U6-U7; p < 5%). Differences among all measured sites temperatures were established using analysis of variance (ANOVA) and Duncan's range test (p = 0.05).

    Hourly data for all measured stations were grouped according to season and mean hourly temperatures were obtained. Mean hourly differences among non-UPAF (nU2 and nU3) and UPAF types were determined for each season and were depicted in scatter plots. Temperature differences of each season were grouped into classes, and the percentage of thermal differences in each class was then calculated.

    A full mean hourly temperatures × recording sites matrix was constructed for each season and analyzed. A principal component analysis (PCA) was performed using a covariance matrix, and results were depicted using scatter plots (one per season). A nonparametric multiple response permutation procedure (MRPP) was performed to test for temperature differences between UPAF and non-UPAF sites. All multivariate analysis were done using the PCOrd program [35].

    Effect of temperatures on energy requirements for cooling and heating

    To estimate the effect of UPAF on energy requirements for inner ambient cooling or heating, the cooling or heating requirements (CR or HR, respectively) were considered based on [36]:

    CR = CDH × q (Equation 1)

    HR = HDH × q (Equation 2)

    where:

    CDH: cooling degree hours

    HDH: heating degree hours

    CDH/HDH: the requirements for cooling or heating (°C or K) necessary to achieve the comfort zone, were obtained using [36]:

    CDH = Σ (Thourly - Tcomfort) for all the hours of the analyzed season

    HDH = Σ (Tcomfort - Thourly) for all the hours of the analyzed season

    q: building conductance (specific heat loss rate W/K)

    Degree Days measure the difference among actual temperature data and a set base or thermal comfort temperature [36]. Thermal comfort zone temperature is defined as a condition in which human expresses satisfaction with the thermal environment is achieved and thus 18 °C for autumn and winter, and 24 °C for spring and summer were used.

    Heating and cooling requirements were represented by CDH and HDH in order to be independent of the q specificity for every type of building. Once CDH and HDH were obtained, they were used to calculate cooling degree days (CDD) and heating degree days (HDD), where CDD=CDH/24 and HDD= HDH/24. All analyses were for one full year of actual measured data and an additional analysis using projected or forecasted temperature from a future scenario. For the future scenario HDD and CDD were calculated for each season by considering a 1-°C increase. Differences among CDD and HDD for UPAF and non-UPAF conditions (considering these sites as replicates of UPAF or non-UPAF conditions) were determined using ANOVAs and Duncan tests (p = 0.05). Except for multivariate analyses, all statistical analysis were done using the Infostat program [37].

    A 1-°C increase in the future scenario analysis was assumed based on [38] who report a mean annual warming between 0.1-1 °C between 1960-2010 for Rosario and regional climate modeling for Argentina that reports mean annual temperatures increase of 2.5 °C for IPCC emissions scenario B2 [39], and 3.5 °C for the IPCC emissions scenario A2 [39] for the period 2081-2090 relative to the 1981-1990 decade [40]. For the A2 scenario, warming can reach up to 4 °C during the spring months. Based on this, a 1 °C increase can be considered representative of future climatic conditions in Rosario, Argentina over the next 25 years (i.e. present to 2038) assuming: extreme greenhouse gas (GHG) emissions or over the next 50 years (i.e. present to 2063), and moderate GHG emissions and no substantial annual seasonality changes during both time periods [38,40]. To better assess the effect of UPAFs on HDD and CDD in the future, it was assumed that the effect of green areas will remain consistent in future warming climates. Such assumptions should be tenable given the complexity of urban areas and climate change dynamics. Indeed the IPCC regularly uses these types of assumptions in their climate change scenarios [11,17,39].

    3. Results and Discussion

    Mean temperatures of UPAF sites were not statistically different (p < 0.05) in every season of the year, except U5, which showed a lack of variability despite being at a suburban area (U1, U2 and U3) or within the city (U4, U6 and U7). Non-UPAF sites showed a different pattern where: nU3 means were statistically different than nU1 and nU2 ones, probably due to high building density and particular urban morphologies, specifically urban street-building canyons [6] (Table 3).

    Table 3. Mean (Tm), maximum (Tmax) and minimum temperature (Tmin), and temperature range (ΔT) recorded in the different sites in Rosario, Argentina (U1-U7: UPAF sites; nU1-3: non-UPAF sites; for each variable, values followed by the same letter show no statistical differences).
    Site Spring Summer
    Tm Tmax Tmin ΔT Tm Tmax Tmin ΔT
    U1 20.8 a 26.6 a 15.7 ab 10.9 c 25.1 a 30.6 a 19.9 ab 10.7 c
    U2 20.9 a 26.4 a 15.6 ab 10.8 c 25.2 a 30.6 a 20.1 ab 10.5 c
    U3 20.8 a 26.5 a 15.4 a 11.1 c 25.1 a 30.6 a 19.9 a 10.7 c
    U4 21.3 a 26.8 ab 16.0 ab 10.3 c 25.7 a 30.8 a 20.6 ab 10.2 c
    U5 23.8 b 26.4 a 19.7 e 6.62 a 25.1 c 30.3 a 24.3 d 6.05 a
    U6 21.5 a 27.0 ab 16.2 ab 10.8 c 26.8 ab 31.1 a 20.7 ab 10.5 c
    U7 21.5 a 26.9 ab 16.4 c 10.5 bc 25.7 ab 31.1 a 21.0 b 10.1 c
    nU1 22.6 b 28.1 b 17.5 c 10.7 c 27.0 c 32.6 b 22.a c 10.6 c
    nU2 22.6 b 25.5 ab 18.1 cd 9.4 b 26.7 bc 30.2 a 22.6 c 8.6 b
    nU3 22.7 b 28.4 b 18.9 de 9.3 b 28.4 d 34.1 c 24.3 d 9.7 a
    Site Autumn Winter
    Tm Tmax Tmin ΔT Tm Tmax Tmin ΔT
    U1 17.5 a 22.2 b 13.3 ab 8.9 cd 13.2 a 18.4 b 8.4 a 10,1 cd
    U2 17.6 a 22.4 b 13.2 ab 9.2 cd 13.2 a 18.8 b 8.0 a 10.9 de
    U3 17.6 a 22.7 b 13.0 a 9.7 d 13.1 a 19.4 b 7.6 a 11.8 e
    U4 17.9 a 22.1 b 14.4 c 7.7 b 14.0 a 18.9 b 10.0 c 8.8 b
    U5 20.1 b 22.9 b 18.0 e 4.9 a 15.8 b 22.0 e 11.4 d 10.6 de
    U6 18.0 a 22.9 b 13.8 abc 9.11 cd 13.5 a 19.1 b 8.8 ab 10.3 cd
    U7 18.1 a 22.7 b 14.3 bc 8.4 bc 13.7 a 18.6 b 9.6 ab 9.0 b
    nU1 19.5 b 24.5 c 15.6 d 8.9 cd 15.1 b 20.6 cd 11.38 d 9.3 bc
    nU2 20.0 b 25.6 c 16.3 d 9.3 cd 15.6 b 21.5 de 12.0 d 9.6 bc
    nU3 18.0 a 20.2 a 16.1 d 4.1 a 13.3 a 15.1 a 11.6 d 3.6 e
     | Show Table
    DownLoad: CSV

    Non-UPAF urban sites had higher mean temperatures than UPAF sites during both spring and summer, a similar trend presented as in smaller Mediterranean cities [34]. The low ΔT in nU3 site during autumn could be the result of an increase in shading of high buildings in the area and the lower height of the sun angle. U5 had a very low temperature range during autumn and winter, probably because trees receive and absorb energy from the buildings, producing long wave irradiation and reflected radiation, and preventing temperature drop, i.e. producing a natural greenhouse effect [34], as will be evident in the figures presented in later analyses.

    Temperature differences among sites directly under the tree crowns or 2 m outside the tree's crown were negligible in UPAF sites (U2 and U3; U6 and U7) (t Test, p > 0.05), probably because air is heated by irradiation from the ground and not by solar energy. This could also be a result of soil-water and vegetation conditions under and outside the tree crown being similar, and thus not presenting different vegetation (i.e. park soils are mostly wet year round from irrigation) irradiative balances as would be observed in impervious covers with concrete or asphalt.

    In spring and summer, minimum temperatures in UPAF sites were at 06:00 hours with the exception of U5 which had a 2-hour delay, while in non-UPAF sites minimum temperatures were 1 or 2 hours later (Figure 2). The opposite trend was depicted by the maximum temperature values: they were earlier in the day in non-UPAF than in UPAF sites.

    Figure 2. Mean temperature values during the day in the different locations in Rosario, Argentina in spring (a), summer (b), autumn (c) and winter (d).

    In spring, non-UPAF sites reached higher temperatures than UPAF ones (Figure 2a). During evening hours, U5 remained with higher temperatures than the other UPAF and non-UPAF sites. U3 showed the lowest temperatures in evenings with a minimum value at 06:00 hours during spring and summer and 1 or 2 hours later during autumn and winter, respectively. All UPAF sites showed similar trend during summer (Figure 2b), with U5 and nU3 denoting the highest evening values.

    A delay in minimum and an advance in maximum temperatures was still evident along the cold seasons in non-UPAF sites with respect UPAF ones, with the exception of nU3. The high thermal capacity of the building materials likely caused heat inertia that delayed minimum temperatures [34] and in the afternoon, long shadows determined earlier maximum temperatures, when the sun continues warming UPAF sites. Except U5, all UPAF sites were almost coincident along autumn (Figure 2c); nU1 and nU2 had the highest maximum temperatures and nU3 the lowest, at midday hours. During winter (Figure 2d), U5 maintained the temperature at night, while all other UPAF sites had the same pattern and nU1 and nU2 had the highest temperatures.

    Peaks of highest temperatures were registered at 15:00 hours during spring and summer and 1 hour before in autumn and winter (Figure 2). Spring and summer highest temperatures were recorded in nU3 while during autumn and winter nU2 reached the highest temperature values. Therefore, nU2 and nU3 were considered non-UPAF reference temperature stations in order to compare with UPAF locations during the cold and the hot seasons, respectively.

    Mean hourly air temperature differences, with respect to nU2 and nU3, exhibited wave-like behavior and during spring presented two daily minimums, the first between 09:00 and 12:00 hours, and the second between 15:00 and 18:00 hours. The two minima of nU3 and UPAF sites occurred also in summer, and besides some differences with nU2, the same behavior was repeated throughout the year. During the initial morning hours, non-UPAF environment reacted slowly to the solar radiation compared to UPAF environment [31]. The second minimum could be due to earlier shadows of the high buildings in non-UPAF sites than UPAF.

    Air temperature in nU2 and nU3 was always higher than in UPAF sites, regardless of day and night and season (Figures 3a-d), except in U5 during early in the morning and late night, as it was previously shown in Figure 2, and sometimes during the two daily minimums. One explanation for this particular U5 behavior is tree transpiration where relative humidity reacts with and absorbs heat released by the buildings resulting in an increase in air temperature beneath them. On the contrary, UPAF sites have cooling effects during day and night as well, except at U5.

    Figure 3. Mean temperature differences between non-UPAF sites (nU2 and nU3) and UPAF sites during the day in spring (a), summer (b), autumn (c) and winter (d) in Rosario, Argentina.

    Both non-UPAF sites had a different behavior during the cold seasons, with nU2 showing an autumn pattern very much like the warm period while nU3 had lower temperatures during daylight hours which can be a results of its placement under complete shade during most of the day due to high buildings surrounding it. Seasonal analyses show that the mean hourly air temperature differences intensity is strongest during summer (4.3 °C comparing nU3 with U3).

    Temperature differences between non-UPAF and UPAF sites reached maximum values of 8.1, 8.1, 9.7 and 10.6 °C in spring, summer, autumn and winter, respectively (Figure 4). The increase of these differences in autumn and winter is evident and coincident with other Argentine cities such as Buenos Aires [41]. However, the population in Buenos Aires and its metropolitan area is one order of magnitude greater. Higher frequencies of negative values were registered mainly in the hours of minimum differences shown in Figure 3 and ranged from -2 to -4 °C.

    Figure 4. Frequency distribution percentage of thermal differences between nU2 or nU3 and all other UPAF sites and types during the year in the spring (a), summer (b), autumn (c) and winter (d) in Rosario, Argentina.

    Overall, the UHI effect was evident during the warm seasons, showing the higher frequencies of positive non-UPAF/ UPAF differences (in nU2 as well as in nU3), while along the cold period non-UPAF sites showed different patterns: nU2 kept the heat and nU3 clearly resembled an urban cold island (UCI) during the day (Figures 3c-d) [42] because the oblique solar elevation angle results in interactions with taller buildings and reduces the intercepted and stored solar energy. The highest percentage of differences between nU2, nU3 and U5 was close to zero and often fell into the range of negative values.

    The UPAF and non-UPAF sites were consistently segregated in the PCA's scatterplot axis 1 according to whether they were UPAF or non-UPAF and distance from the city core except for U5, which despite being a treed site was well within a highly built area (Figure 5). In all seasons, the first two axes accounted for very high percentages of the total variance (93.77, 95.02, 96.39 and 98.25% for spring, summer, autumn and winter, respectively). Differences between UPAF and non-UPAF sites were detected by the MRPP in each season (spring, p = 0.0151; summer, p = 0.0152; autumn, p = 0.0239; and winter, p = 0.0369).

    Figure 5. Principle component analysis plots of the first and second component of UPAF and non-UPAF sites during the (a) spring; (b) summer; (c) autumn; and (d) winter in Rosario, Argentina.

    In summer the three non-UPAF sites showed different CDD; nU3 had the highest value due to its condition of being the site with the highest temperatures (Table 4). The UPAF sites in general had lower CDD, except U5 due to its high nighttime temperatures, although differences among UPAF versus non-UPAF sites were significant (p < 0.001). Considering the analysis period, the non-UPAF site with highest CDD (nU3) would need 1.77 times more energy to cool than U3, the site that presented the least amount of CDD.

    Table 4. Cooling degree days (CDD, a) and heating degree days (HDD, b) per season for each measured site in Rosario, Argentina.
    (a)
    UPAF non-UPAF
    U1 U2 U3 U4 U5 U6 U7 nU1 nU2 nU3
    Spring 49 45 45 49 58 56 52 76 67 72
    Summer 240 240 238 247 329 267 262 349 315 443
    Autumn 15 17 21 11 20 25 20 41 55 6
    Winter 6 5 7 6 2 7 6 8 14 0
    TOTAL 310 306 310 313 409 354 340 474 451 521
    (b)
    UPAF non-UPAF
    U1 U2 U3 U4 U5 U6 U7 nU1 nU2 nU3
    Spring 41 40 43 32 6 32 30 18 15 12
    Summer 13 11 13 7 0 7 6 2 2 1
    Autumn 197 187 199 158 52 172 158 104 86 133
    Winter 423 433 437 362 211 400 383 291 266 372
    TOTAL 674 671 691 558 270 611 577 415 369 518
     | Show Table
    DownLoad: CSV

    Heat emitted by construction materials in the non-UPAF sites decreased heating demand in these areas at all times of the year relative to UPAF sites, by 163% less than UPAF during the winter period and by 185% less than the analyzed year. The U5 site had the lowest HDD due to its low temperature range, while all other UPAF sites had high HDD figures, mainly due to higher night-time temperature in relation to other measured sites. Heating demand of non-UPAF sites decreased with respect to UPAF sites all times of the year due to the heat emitted by construction materials, but differences among UPAF/ non-UPAF were not statistically significant (p < 0.05), with U1 having the highest HDD demand.

    Increases in the demand for cooling and decreases in the demand for heating in each measured site using actual and a projected future climate scenario are presented in Table 5. At all UPAF sites, with the exception of U5, the increased demand for cooling along summer period is offset by decreasing winter demand for heating.

    Table 5. Total CDD and HDD considering present conditions and a future scenario (Future Scenario; Δ%: percentage of increase or decrease) in Rosario, Argentina.
    UPAF non-UPAF
    U1 U2 U3 U4 U5 U6 U7 nU1 nU2 nU3
    CDD
    Spring
    Present 49 45 45 49 58 56 52 76 76 72
    Future scenario 66 62 63 65 84 76 71 99 91 94
    Δ % 35 38 38 33 45 35 35 31 35 30
    Summer
    Present 240 240 238 247 329 267 262 349 315 443
    Future scenario 292 289 289 302 404 324 320 414 382 513
    Δ % 22 21 22 23 23 21 22 19 21 16
    total
    Present 289 285 283 296 387 323 314 425 391 515
    Future scenario 358 351 352 367 488 400 391 513 473 607
    Δ % 24 23 24 24 26 24 25 21 21 18
    HDD
    Autumn
    Present 197 187 199 158 52 172 158 104 86 133
    Future scenario 149 141 151 115 32 128 116 71 58 91
    Δ % -24 -25 -24 -27 -38 -26 -27 -32 -33 -32
    Winter
    Present 423 433 437 362 211 400 383 291 266 372
    Future scenario 335 335 349 279 145 311 295 209 194 298
    Δ % -21 -23 -20 -23 -31 -22 -23 -28 -27 -20
    Total
    Present 620 620 636 520 263 572 541 395 352 505
    Future scenario 484 476 500 394 177 439 411 280 252 389
    Δ % -22 -23 -21 -24 -33 -23 -24 -29 -28 -23
     | Show Table
    DownLoad: CSV

    Overall, the results show an evident variability and heterogeneity in atmospheric temperatures across Rosario, with higher temperatures found in the urbanized core's built-up area and the presence of an UHI in UPAF sites as compared to non-UPAF areas. Therefore, differences in energy requirements required to achieve a thermal comfort zone will generates variations in energy demand for heating in the cold months and for refrigeration during warmer periods. Findings show that the use and presence of UPAF areas statistically lowered the UHI in summer with corresponding projected decrease in energy demand for cooling. The study also showed that in areas with street trees, parks and urban agriculture, temperatures were 8-10 °C lower on average throughout the year. It should be noted however that tree cover from evergreen trees in winter blocks solar radiation that warms surface and building walls, and results in increased energy demands for heating. But, an overall reduction in cooling demand was higher than increase in heating demand.

    An interesting finding was that temperature effects in small urban agricultural gardens (approximately 1620 m2) were similar to those of larger gardens and public parks 2-3 ha in size. This would imply that including small UPAF areas in new or upgraded housing and neighbor settlements could have a desired effect on human comfort levels. Larger UPAF areas may however have temperature impacts on building areas located at further distances from the UPAF areas, as compared to smaller UPAF areas. However, further research in needed; temperature data and effects need to be collected and analyzed in various distances and spatial arrangements away from UPAF areas. This should provide information as to what extent (distance) temperature effects expand outside specific green areas of different size.

    In addition, in middle latitude cities such as Rosario in the developing world, CDD can be considered an appropriate indicator for energy demand, while HDD were found to be less reliable as they tend to over-estimate energy heating requirements. During a typical winter day, air temperature can exceed 18 °C (i.e. the locally relevant comfort temperature). However, during these hours with a temperature above comfort temperatures heat is stored within buildings, thus delaying heating requirements in the evening and night when air temperatures fall below 18 °C. Hence, and as is typical of these types of cities, CDD are a good indicator of energy demand, but the HDD are not because they over estimate energy heating requirements. Therefore the findings conclude that UPAF can be considered a useful approach and policy for high temperatures mitigation in Latin American cities such as Rosario [43].

    4. Conclusions

    Our results highlight the importance of preserving existing UPAF areas and promoting the incorporation of new UPAF areas within cities. Temperature findings show that UPAF can be considered a useful approach for high temperatures mitigation within the city. Recently, for example in 2013 during Rosario's summer months, electrical outages due to extreme cooling energy use were found to be related to high temperatures; therefore the findings of this study are of immediate relevance to municipal decision-makers. Rosario also has an established urban planning tradition that includes measures such as strategic plans for the city and its metropolitan area that include food security and environmental quality; therefore, UPAF measures could easily be incorporated into existing policies to make the city more resilient to climate change. Incorporation of such planning ordinances or urban design concepts will promote green infrastructure projects instead of urban in-fill, protect valuable ecosystems and biodiversity hotspots and preserve natural corridors. Designating flood plains in the Parana Delta for agriculture can protect low-lying areas from flood damages as well.

    Rosario's municipality is also now determining the choice of urban tree species to be planted in terms of their temperature impacts. Rosario will not only continue to promote urban forestry and urban agriculture activities in parks, but also the inclusion of smaller urban agriculture gardens in new housing settlements. It is expected that next to social benefits, such urban greening will also help reduce energy demand for cooling. With increasing urbanization, climate change and growing urban demand for food, cities need to address the triple challenge of climate change mitigation, adaptation and improving urban food security. This study in Rosario shows that UPAF may be a viable strategy to address this triple challenge. Local and Regional governments can play a further proactive and coordinating role by: (1) integrating urban agriculture and food security into climate change adaptation strategies; (2) maintaining and managing agriculture as part of the urban and periurban green infrastructure; (3) identifying open urban spaces prone to floods and landslides, and protecting or developing these as permanent agricultural and multifunctional areas; (4) integrating urban agriculture and forestry into comprehensive city water(shed) management plans, development plans, building codes and housing programs; (5) recognizing urban agriculture as an accepted, permitted and encouraged land use; and (6) developing a municipal urban agriculture and food security policy and program.

    Acknowledgments

    We would like to especially thank the residents that work and live in and near the sites where temperature instruments were placed for their important contribution to their care during this 1 year study. This research was funded by the UK's Department for International Development (DFID) and the Netherlands Directorate-General for International Cooperation (DGIS). It was coordinated by the RUAF Foundation-International network of Resource Centres on Urban agriculture and Food security as part of the Monitoring the impacts of urban and periurban agriculture and forestry on climate change mitigation, adaptation and (co)development international program. The views expressed and information contained in it are not necessarily those of or endorsed by DFID, DGIS or the entities managing the delivery of the Climate and Development Knowledge Network, which can accept no responsibility or liability for such views, completeness or accuracy of the information or for any reliance placed on them.

    [1] Fernández García F (1996) Manual de climatología aplicada. Clima, medio ambiente y planificación. Madrid. Ed. Síntesis.
    [2] Cuadrat J, Pita MF (2000) Climatología. Madrid. Ediciones Cátedra, Grupo Amaya S.A.
    [3] Population Reference Bureau (2015) Human Population: Urbanization. Available from: http://www.prb.org/Publications/Lesson-Plans/HumanPopulation/Urbanization.aspx
    [4] Gago A, Hanemann M, Labandeira X, et al. (2013) Climate change, buildings and energy prices, In Fouquet, R. Author, Handbook of Energy and Climate Change. Cheltenham: Edward Elgar, p 434-452.
    [5] Easterling DR, Meehl GA, Parmesan C, et al. (2000). Climate extremes: observations, modeling, and impacts. Science 289: 2068-2074. doi: 10.1126/science.289.5487.2068
    [6] Fernández F, Montávez JP, González-Rouco JF, et al. (2004) Relación entre la estructura espacial de la isla térmica y la morfología urbana de Madrid. In: García Cordón J C, Liaño D, Fernándes de Arróyabe P, Garmendia C, Rasilla D (eds.) El clima entre el Mar y la Montaña. Santander, Asoc. Española de Climatología y Universidad de Cantabria. Serie A, 4:641-649.
    [7] Oke TR (1973) City size and the urban heat island. Atmos Env 7: 769-779. doi: 10.1016/0004-6981(73)90140-6
    [8] Szegedi S, Kircsi A (2003) The development of the urban heat island under various weather conditions in Debrecen, Hungary. Debrecen .University of Debrecen, Hungary.
    [9] Correa EN, Flores Larsen S, Lesino G (2003) Isla de Calor Urbana: Efecto de los Pavimentos. Informe de Avance. Avances Energ Renov Medio Ambient 7: 11.25-11.30.
    [10] Maristany A, Abadía L, Angiolini S, et al. (2008) Estudio del fenómeno de la isla de calor en la ciudad de Córdoba-Resultados preliminares. Avances Energ Renov Medio Ambient 12: 11.69-11.75.
    [11] IPCC (2013) Summary for Policymakers. In: Climate Change 2013: The Physical Science Basis. Contribution of Working Group I to the Fifth Assessment Report of the Intergovernmental Panel on Climate Change Stocker TF, Qin D, Plattner G-K, et al. (eds.). Cambridge, Cambridge University Press, United Kingdom and New York, NY, USA. Available from: http://www.climatechange2013.org/images/report/WG1AR5_TS_FINAL.pdf.
    [12] Sanchez-Rodriguez R (2009) Learning to adapt to climate change in urban areas. A review of recent contributions. Curr Opin Env Sust 1: 201-206. doi: 10.1016/j.cosust.2009.10.005
    [13] Mavrogianni A, Davies M, Batty M, et al. (2011) The comfort, energy and health implications of London's urban heat island. Build Serv Eng Res Technol 0143624410394530.
    [14] Fischer EM, Oleson KW, Lawrence DM (2012) Contrasting urban and rural heat stress responses to climate change. Geophys Res Lett 39: 3.
    [15] Sivak M (2009) Potential energy demand for cooling in the 50 largest metropolitan areas of the world: Implications for developing countries. Energ Policy 37: 1382-1384. doi: 10.1016/j.enpol.2008.11.031
    [16] Kolokotroni M, Ren X, Davies M, et al. (2012) London’s urban heat island: Impact on current and future energy consumption in office buildings. Energ Buildings 47: 302-311. doi: 10.1016/j.enbuild.2011.12.019
    [17] Di Leo N, Escobedo FJ, Dubbeling M. (2015) The role of urban green infrastructure in mitigating land surface temperatures in Bobo-Dioulasso, Burkina Faso. Environ Dev Sust 1-20.
    [18] Coronel AS, Piacentini R (1991) Comportamiento higrotérmico de la ciudad de Rosario (Pampa húmeda argentina) en período estival. Anal Sexto Cong Argent Meteo.
    [19] Schiller S, Martin Evans J, Katzschner L (2001) Isla de calor, microclima urbano y variables de diseño Estudios en Buenos Aires y Río Gallegos. Avances Energ Renov Medio Ambient 5: 46-50.
    [20] Mesa NA, Polimeni CM (2003) La isla de calor urbana en zonas áridas andinas de clima mesotermal seco. Caso Área Metropolitana de Mendoza (AMM). Avances Energ Renov Medio Ambient 7: 11-37-11.42.
    [21] Maristany A, Abadía L, Angiolini S, et al. (2008) Estudio del fenómeno de la isla de calor en la ciudad de Córdoba - Resultados preliminares. Avances Energ Renov Medio Ambient 12: 11.69-11.75.
    [22] Filippín C, Flores Larsen S (2012) Summer thermal behaviour of compact single family housing in a temperate climate in Argentina. Renew Sust Energ Rev 16: 3439-3455. doi: 10.1016/j.rser.2012.01.060
    [23] Souch CA, Souch C (1993) The effect of trees on summertime below canopy urban climates: a case study Bloomington, Indiana. J Arbor 19: 303-312.
    [24] Bowler DE, Buyung-Ali L, Knight TM, et al. (2010) Urban greening to cool towns and cities: A systematic review of the empirical evidence. Landscape Urban Plan 97: 147-155 doi: 10.1016/j.landurbplan.2010.05.006
    [25] Norton BA, Coutts AM, Livesley SJ, et al. (2015) Planning for cooler cities: A framework to prioritise green infrastructure to mitigate high temperatures in urban landscapes. Landscape Urban Plan 134:127-138. doi: 10.1016/j.landurbplan.2014.10.018
    [26] Zezza A, Tasciotti L (2010) Urban agriculture, poverty, and food security: Empirical evidence from a sample of developing countries. Food Policy 35: 265-273. doi: 10.1016/j.foodpol.2010.04.007
    [27] IPCC (2014) Summary for policymakers. In: Climate Change 2014: Impacts, Adaptation, and Vulnerability. Part A: Global and Sectoral Aspects. Contribution of Working Group II to the Fifth Assessment Report of the Intergovernmental Panel on Climate Change Field CB, Barros VR, Dokken DJ et al. (eds.).. Cambridge, Cambridge University Press, United Kingdom and New York, NY, USA. Available from: http://www.ipcc.ch/pdf/assessment-report/ar5/wg2/ar5_wgII_spm_en.pdf.
    [28] Revi A, Satterthwaite D, Aragón-Durand F, et al. (2014) Towards transformative adaptation in cities: the IPCC's Fifth Assessment. Environ Urban 26: 11-28. doi: 10.1177/0956247814523539
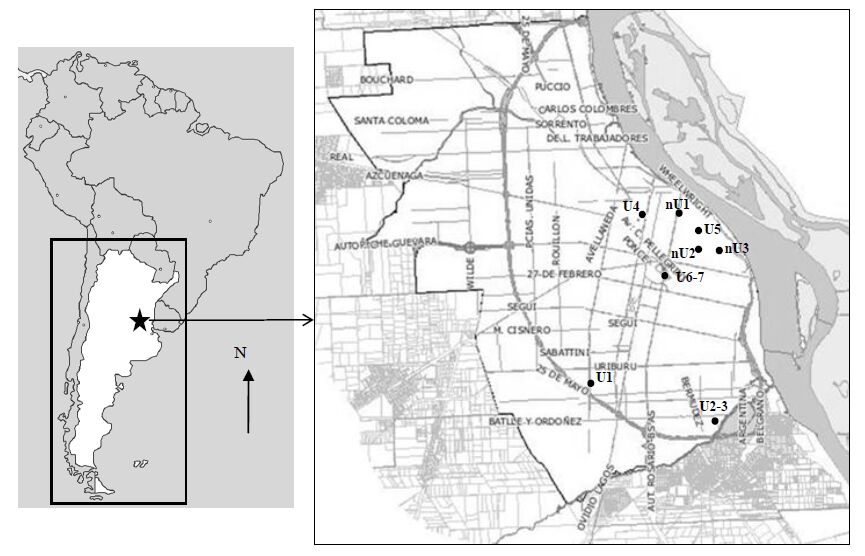
    [29] Municipalidad de Rosario (2014) Available from: http://www.rosario.gov.ar/sitio/caracteristicas/geografica_limites.jsp.
    [30] Servicio Meteorológico Nacional (2014) Available from: http://www.smn.gov.ar/serviciosclimaticos/?mod=turismo&id=7&provincia=Santa%20Fe&ciudad=Rosario.
    [31] Municipalidad de Rosario (2015) Available from: http://www.rosario.gov.ar/sitio/desarrollo_social/empleo/programa_au.jsp.
    [32] Castellani A, Skolnik M (2011) “Devaluacionistas” y “dolarizadores”. La construcción social de las alternativas propuestas por los sectores dominantes ante la crisis de la Convertibilidad. Argentina 1999-2001. Doc Invest Soc 18: 1-21.
    [33] Potchter O, Cohen P, Bitan A (2006) Climatic behaviour of various urban parks during hot and humid summer in the Mediterranean city of Tel Aviv, Israel. Int J Climatol 26: 1695-1711. doi: 10.1002/joc.1330
    [34] Vardoulakis E, Karamanis D, Fotiadi D, et al. (2013) The urban heat island effect in a small Mediterranean city of high summer temperatures and cooling energy demands. Solar Energy 94:128-144. doi: 10.1016/j.solener.2013.04.016
    [35] Peck JE (2010) Multivariate analysis for community ecologists: step-by-step using PC-ORD. MjM Software Design, US.
    [36] Szokolay SV (2004) Introduction to architectural science the basis of sustainable design. Oxford. Elsevier, pp 360.
    [37] Di Rienzo JA, Casanoves F, Balzarini MG, et al. (2008) InfoStat, versión 2008. Córdoba. Universidad Nacional de Córdoba, Argentina.
    [38] Barros V, Vera C, Agosta E, et al. (2015) Cambio climático en Argentina; tendencias y proyecciones. Tercera Comunicación Nacional a la Convención Marco de las Naciones Unidas sobre el Cambio Climático. Available from: http://www.ambiente.gov.ar/?idarticulo=13291
    [39] IPCC (2000) Emission scenarios, a special report of working group III of the intergovernmental on climate change. Nakicenovic N. Coordinating Lead Author. Cambridge University Press, Cambridge, pp 570.
    [40] Núñez M, Solman S, Cabré MF (2009) Regional climate change experiments over southern South America. II: Climate change scenarios in the late twenty-first century. Clim Dynam 32: 1081-1095.
    [41] Camilloni I (2014) Isla urbana de calor. Atlas ambiental de Buenos Aires. Available from: http://www.atlasdebuenosaires.gov.ar/aaba/index.php?option=com_content&task=view&id=416&Itemid=207&lang=es.
    [42] Oke TR (1982) The energetic basis of the urban heal island. Q J Roy Meteor Soc 108: 1-24.
    [43] Hardoy J, Ruete R (2013) Incorporating climate change adaptation into planning for a liveable city in Rosario, Argentina. Environ Urban 25: 339-360. doi: 10.1177/0956247813493232
  • This article has been cited by:

    1. Evan Mallen, Joshua Bakin, Brian Stone, Ramachandra Sivakumar, Kevin Lanza, Thermal impacts of built and vegetated environments on local microclimates in an Urban University campus, 2020, 32, 22120955, 100640, 10.1016/j.uclim.2020.100640
    2. Alessio Russo, Francisco J. Escobedo, Giuseppe T. Cirella, Stefan Zerbe, Edible green infrastructure: An approach and review of provisioning ecosystem services and disservices in urban environments, 2017, 242, 01678809, 53, 10.1016/j.agee.2017.03.026
    3. Mary Thornbush, Urban greening for low carbon cities—introduction to the special issue, 2016, 3, 2372-0352, 133, 10.3934/environsci.2016.1.133
    4. Cynnamon Dobbs, Francisco J. Escobedo, Nicola Clerici, Francisco de la Barrera, Ana Alice Eleuterio, Ian MacGregor-Fors, Sonia Reyes-Paecke, Alexis Vásquez, Jorge Danilo Zea Camaño, H. Jaime Hernández, Urban ecosystem Services in Latin America: mismatch between global concepts and regional realities?, 2019, 22, 1083-8155, 173, 10.1007/s11252-018-0805-3
    5. Zander S. Venter, Norun Hjertager Krog, David N. Barton, Linking green infrastructure to urban heat and human health risk mitigation in Oslo, Norway, 2020, 709, 00489697, 136193, 10.1016/j.scitotenv.2019.136193
    6. Bastian Winkler, Anika Maier, Iris Lewandowski, Urban Gardening in Germany: Cultivating a Sustainable Lifestyle for the Societal Transition to a Bioeconomy, 2019, 11, 2071-1050, 801, 10.3390/su11030801
    7. Federica Marando, Elisabetta Salvatori, Lina Fusaro, Fausto Manes, Removal of PM10 by Forests as a Nature-Based Solution for Air Quality Improvement in the Metropolitan City of Rome, 2016, 7, 1999-4907, 150, 10.3390/f7070150
    8. Changsoon Choi, Pam Berry, Alison Smith, The climate benefits, co-benefits, and trade-offs of green infrastructure: A systematic literature review, 2021, 291, 03014797, 112583, 10.1016/j.jenvman.2021.112583
    9. Laura Silvia Valente de Macedo, Marc Eric Barda Picavet, José Antonio Puppim de Oliveira, Wan-Yu Shih, Urban green and blue infrastructure: A critical analysis of research on developing countries, 2021, 313, 09596526, 127898, 10.1016/j.jclepro.2021.127898
    10. Virginia Venturini, 2022, Thermal condition of Santa Fe city- Argentina during the period 2013-2022, 978-1-6654-8014-7, 1, 10.1109/ARGENCON55245.2022.9940145
    11. O. Illarionova, O. Klimanova, Yu. Kolbovsky, 2021, Chapter 6, 978-3-030-75284-2, 51, 10.1007/978-3-030-75285-9_6
    12. Shuv Dey, Yogendra Joshi, Recent Progress and Challenges in Microscale Urban Heat Modeling and Measurement for Urban Engineering Applications, 2023, 15, 1948-5085, 10.1115/1.4056054
    13. Jana Šiftová, Shaping the urban home garden: Socio-ecological forces in the management of private green spaces, 2021, 111, 02648377, 105784, 10.1016/j.landusepol.2021.105784
    14. Mary J. Thornbush, Introducing the Special Issue on Urban Sustainability Futures, 2022, 14, 2071-1050, 11964, 10.3390/su141911964
    15. Mahmuda Sharmin, Mark G. Tjoelker, Sebastian Pfautsch, Manuel Esperon-Rodriguez, Paul D. Rymer, Sally A. Power, Tree crown traits and planting context contribute to reducing urban heat, 2023, 16188667, 127913, 10.1016/j.ufug.2023.127913
    16. Francisco Tomatis, Francisco Javier Diez, Maria Sol Wilhelm, Luis Manuel Navas-Gracia, Prediction of Daily Ambient Temperature and Its Hourly Estimation Using Artificial Neural Networks in Urban Allotment Gardens and an Urban Park in Valladolid, Castilla y León, Spain, 2023, 14, 2073-4395, 60, 10.3390/agronomy14010060
    17. Jiyoung Kim, Abdou Khouakhi, Ronald Corstanje, Alice S.A. Johnston, Greater local cooling effects of trees across globally distributed urban green spaces, 2024, 911, 00489697, 168494, 10.1016/j.scitotenv.2023.168494
    18. Francisco Tomatis, Monika Egerer, Luis Manuel Navas-Gracia, Evaluating Food Production, Cooling Potential, and Gardener Perspectives in Urban Allotment Gardens of Valladolid, Spain, 2024, 10, 2311-7524, 1232, 10.3390/horticulturae10111232
    19. Diana Lucia Giraldo-Charria, Francisco J. Escobedo, Nicola Clerici, Benjamin Quesada, Urban forests mitigate extreme heat exposure in a vulnerable tropical city, 2025, 59, 22120955, 102311, 10.1016/j.uclim.2025.102311
    20. Vidjinnagni Vinasse Ametooyona Azagoun, Kossi Komi, Expédit Wilfrid Vissin, Komi Selom Klassou, Analysis of the Dynamics of Hydroclimatic Extremes in Urban Areas: The Case of Grand-Nokoué in Benin, West Africa, 2025, 13, 2225-1154, 39, 10.3390/cli13020039
    21. Johnson Adedeji Olusola, Felix Ike, Oluwafemi Emmanuel Olofinl, Adebayo Oluwole Eludoyin, 2025, Chapter 29-1, 978-3-031-24952-5, 1, 10.1007/978-3-031-24952-5_29-1
  • Reader Comments
  • © 2015 the Author(s), licensee AIMS Press. This is an open access article distributed under the terms of the Creative Commons Attribution License (http://creativecommons.org/licenses/by/4.0)
通讯作者: 陈斌, bchen63@163.com
  • 1. 

    沈阳化工大学材料科学与工程学院 沈阳 110142

  1. 本站搜索
  2. 百度学术搜索
  3. 万方数据库搜索
  4. CNKI搜索

Metrics

Article views(7722) PDF downloads(1673) Cited by(21)

Article outline

/

DownLoad:  Full-Size Img  PowerPoint
Return
Return

Catalog