A false data injection attack (FDIA) indicates that attackers mislead system decisions by inputting false or tampered data into the system, which seriously threatens the security of power cyber-physical systems. Considering the scarcity of FDIA attack samples, the traditional FDIA detection models based on neural networks are always limited in their detection capabilities due to imbalanced training samples. To address this problem, this paper proposes an efficient FDIA attack sample generation method by an adversarial attention-diffusion model. The proposed scheme consists of a diffusion model and a GAN model with an attention mechanism (ATTGAN). First, the forward diffusion of the diffusion model was used to add noise to the real data while injecting the attack vector. Then, the ATTGAN model was trained to effectively focus on the information of power grid measurements and topological nodes, while weakening irrelevant information. In the reverse diffusion process, the trained ATTGAN model was combined to predict the noise, and it was further iterated forward step by step and denoised in this process. Finally, a large number of efficient FDIA attack samples can were generated. Extensive experiments have been carried out on IEEE 14, IEEE 39, and IEEE 118 bus systems. The experimental results indicate that the generated attack samples outperform existing state-of-the-art schemes in terms of evasion detection capability, robustness, and attack strength.
Citation: Kunzhan Li, Fengyong Li, Baonan Wang, Meijing Shan. False data injection attack sample generation using an adversarial attention-diffusion model in smart grids[J]. AIMS Energy, 2024, 12(6): 1271-1293. doi: 10.3934/energy.2024058
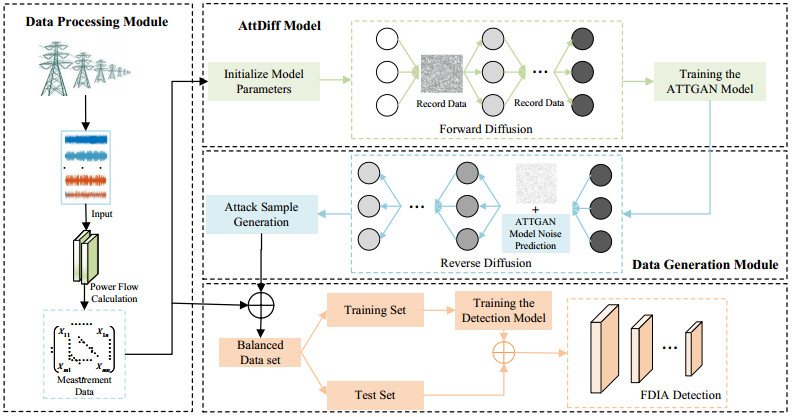
A false data injection attack (FDIA) indicates that attackers mislead system decisions by inputting false or tampered data into the system, which seriously threatens the security of power cyber-physical systems. Considering the scarcity of FDIA attack samples, the traditional FDIA detection models based on neural networks are always limited in their detection capabilities due to imbalanced training samples. To address this problem, this paper proposes an efficient FDIA attack sample generation method by an adversarial attention-diffusion model. The proposed scheme consists of a diffusion model and a GAN model with an attention mechanism (ATTGAN). First, the forward diffusion of the diffusion model was used to add noise to the real data while injecting the attack vector. Then, the ATTGAN model was trained to effectively focus on the information of power grid measurements and topological nodes, while weakening irrelevant information. In the reverse diffusion process, the trained ATTGAN model was combined to predict the noise, and it was further iterated forward step by step and denoised in this process. Finally, a large number of efficient FDIA attack samples can were generated. Extensive experiments have been carried out on IEEE 14, IEEE 39, and IEEE 118 bus systems. The experimental results indicate that the generated attack samples outperform existing state-of-the-art schemes in terms of evasion detection capability, robustness, and attack strength.

| [1] | Baheti R, Gill H (2011) Cyber-physical systems. The Tmpact of Control Technology 12: 161–166. Available from: www.ieeecss.org. |
| [2] |
Aoufi S, Derhab A, Guerroumi M (2020) Survey of false data injection in smart power grid: Attacks, countermeasures and challenges. J Inf Secur Appl 54: 102518. https://doi.org/10.1016/j.jisa.2020.102518 doi: 10.1016/j.jisa.2020.102518

|
| [3] |
Li Z, Tong W, Jin X (2016) Construction of cyber security defense hierarchy and cyber security testing system of smart grid: Thinking and enlightenment for network attack events to national power grid of Ukraine and Israel. Autom Electr Power Syst 40: 147–151. https://doi.org/10.7500/AEPS20160313005 doi: 10.7500/AEPS20160313005
|
| [4] |
Kumar A, Saxena N, Jung S, et al. (2021) Improving detection of false data injection attacks using machine learning with feature selection and oversampling. Energies 15: 212. https://doi.org/10.3390/en15010212 doi: 10.3390/en15010212
|
| [5] |
Cheng G, Lin Y, Zhao J, et al. (2022) A highly discriminative detector against false data injection attacks in AC state estimation. IEEE Trans Smart Grid 13: 2318–2330. https://doi.org/10.1109/TSG.2022.3141803 doi: 10.1109/TSG.2022.3141803
|
| [6] |
Qu Z, Dong Y, Li Y, et al. (2024) Localization of dummy data injection attacks in power systems considering incomplete topological information: A spatio-temporal graph wavelet convolutional neural network approach. Appl Energy 360: 122736. https://doi.org/10.1016/j.apenergy.2024.122736 doi: 10.1016/j.apenergy.2024.122736
|
| [7] | Fang Z (2024) Detection of false data injection attacks in power grid based on Res-CNN-LSTM with channel fusion. Electr Eng 25: 11–17. Available from: www.cesmedia.cn. |
| [8] |
Su X, Deng C, Yang J, et al. (2024) Damgat based interpretable detection of false data injection attacks in smart grids. IEEE Trans Smart Grid 15: 4182–4195. https://doi.org/10.1109/TSG.2024.3364665 doi: 10.1109/TSG.2024.3364665
|
| [9] |
Takiddin A, Ismail M, Atat R, et al. (2023) Robust graph autoencoder-based detection of false data injection attacks against data poisoning in smart grids. IEEE Trans Artif Intell 5: 1287–1301. https://doi.org/10.1109/TAI.2023.3286831 doi: 10.1109/TAI.2023.3286831
|
| [10] |
Li X, Wang Y, Lu Z (2023) Graph-based detection for false data injection attacks in power grid. Energy 263: 125865. https://doi.org/10.1016/j.energy.2022.125865 doi: 10.1016/j.energy.2022.125865
|
| [11] |
Qu Z, Bo X, Yu T, et al. (2022) Active and passive hybrid detection method for power CPS false data injection attacks with improved AKF and GRU‐CNN. IET Renewable Power Gener 16: 1490–1508. https://doi.org/10.1049/rpg2.12432 doi: 10.1049/rpg2.12432
|
| [12] |
Wang S, Bi S, Zhang YJA (2020) Locational detection of the false data injection attack in a smart grid: A multilabel classification approach. IEEE Int Things J 7: 8218–8227. https://doi.org/10.1109/JIOT.2020.2983911 doi: 10.1109/JIOT.2020.2983911
|
| [13] |
Xie J, Rahman A, Sun W (2024) Bayesian gan-based false data injection attack detection in active distribution grids with DERs. IEEE Trans Smart Grid 15: 3223–3234. https://doi.org/10.1109/TSG.2023.3337340 doi: 10.1109/TSG.2023.3337340
|
| [14] |
Yan Q, Wang M, Huang W, et al. (2019) Automatically synthesizing DoS attack traces using generative adversarial networks. Int J Mach Learn Cybern 10: 3387–3396. https://doi.org/10.1007/s13042-019-00925-6 doi: 10.1007/s13042-019-00925-6
|
| [15] |
Kumar V, Sinha D (2023) Synthetic attack data generation model applying generative adversarial network for intrusion detection. Comput Secur 125: 103054. https://doi.org/10.1016/j.cose.2022.103054 doi: 10.1016/j.cose.2022.103054
|
| [16] |
Tian J, Wang B, Wang Z, et al. (2021) Joint adversarial example and false data injection attacks for state estimation in power systems. IEEE Trans Cybern 52: 13699–13713. https://doi.org/10.1109/TCYB.2021.3125345 doi: 10.1109/TCYB.2021.3125345
|
| [17] |
Bhattacharjee A, Mondal AK, Verma A, et al. (2022) Deep latent space clustering for detection of stealthy false data injection attacks against AC state estimation in power systems. IEEE Trans Smart Grid 14: 2338–2351. https://doi.org/10.1109/TSG.2022.3216625 doi: 10.1109/TSG.2022.3216625
|
| [18] |
Wu Y, Zu T, Guo N, et al. (2023) Laplace-domain hybrid distribution model based FDIA attack sample generation in smart grids. Symmetry 15: 1669. https://doi.org/10.3390/sym15091669 doi: 10.3390/sym15091669
|
| [19] | Li F, Shen W, Bi Z, et al. (2024) Sparse adversarial learning for FDIA attack sample generation in distributed smart grids. CMES-Comput Model Eng Sci 139. https://doi.org/10.32604/cmes.2023.044431 |
| [20] |
Tang B, Lu Y, Li Q, et al. (2023) A diffusion model based on network intrusion detection method for industrial cyber-physical systems. Sensors 23: 1141. https://doi.org/10.3390/s23031141 doi: 10.3390/s23031141
|
| [21] | Batzolis G, Stanczuk J, Schönlieb CB, et al. (2021) Conditional image generation with score-based diffusion models. arXiv preprint arXiv:2111, 13606. https://doi.org/10.48550/arXiv.2111.13606 |
| [22] | Deng J, Dong W, Socher R, et al. (2009) Imagenet: A large-scale hierarchical image database. 2009 IEEE Conference on Computer Vision and Pattern Recognition, Miami, FL, USA, 248–255. https://doi.org/10.1109/CVPR.2009.5206848 |
| [23] | Esser P, Rombach R, Ommer B (2021) Taming transformers for high-resolution image synthesis. Proceedings of the IEEE/CVF Conference on Computer Vision and Pattern Recognition, 12873–12883. https://doi.org/10.1109/CVPR46437.2021.01268 |
| [24] | Austin J, Johnson DD, Ho J, et al. (2021) Structured denoising diffusion models in discrete state-spaces. Adv Neural Inf Process Syst 34: 17981–17993. Available from: www.proceedings.neurips.cc. |
| [25] | Park SW, Lee K, Kwon J (2021) Neural markov controlled SDE: Stochastic optimization for continuous-time data. International Conference on Learning Representations. Available from: https://openreview.net/pdf?id = 7DI6op61AY. |
| [26] | Tashiro Y, Song J, Song Y, et al. (2021) Csdi: Conditional score-based diffusion models for probabilistic time series imputation. Adv Neural Inf Process Syst 34: 24804–24816. Available from: www.proceedings.neurips.cc |
| [27] |
Wu Y, Wang Q, Guo N, et al. (2023) Efficient multi-source self-attention data fusion for FDIA detection in smart grid. Symmetry 15: 1019. https://doi.org/10.3390/sym15051019 doi: 10.3390/sym15051019
|
| [28] | Wu Y, Sheng Y, Guo N, et al. (2022) Hybrid deep network based multi-source sensing data fusion for fdia detection in smart grid. 2022 Asia Power and Electrical Technology Conference (APET), 310–315. https://doi.org/10.1109/APET56294.2022.10072807 |
| [29] |
Li Y, Wei X, Li Y, et al. (2022) Detection of false data injection attacks in smart grid: A secure federated deep learning approach. IEEE Trans Smart Grid 13: 4862–4872. https://doi.org/10.1109/TSG.2022.3204796 doi: 10.1109/TSG.2022.3204796
|
| [30] |
Musleh A, Chen G, Dong Z, et al. (2023) Attack detection in automatic generation control systems using LSTM-based stacked autoencoders. IEEE Trans Ind Inf 19: 153–165. https://doi.org/10.1109/TII.2022.3178418 doi: 10.1109/TII.2022.3178418
|


Figures(6) / Tables(6)

Kunzhan Li, Fengyong Li, Baonan Wang, Meijing Shan. False data injection attack sample generation using an adversarial attention-diffusion model in smart grids[J]. AIMS Energy, 2024, 12(6): 1271-1293. doi: 10.3934/energy.2024058


 DownLoad: