Research article Topical Sections

Estimation of different wind characteristics parameters and accurate wind resource assessment for Kadavu, Fiji

  • Wind resource assessment is carried out for a site in Kadavu, Fiji Islands. This included estimating the Weibull parameters and wind power density using ten different methods and carrying out an economic analysis. The wind speeds at 34 m and 20 m above ground level, wind direction, atmospheric pressure and temperature were measured for 18 months and statistically analyzed. The overall average wind speed at a height of 34 m above ground level was found to be 3.63 m/s. The seasonal averages for the site were 3.81 m/s and 3.40 m/s for summer and winter respectively. The diurnal variation of the wind shear for the site was correlated with the temperature variation. The Moments Method was found to be the best method for the entire period of study. The Modified Maximum Likelihood Method was found to be the best for the summer season whilst Median and Quartile method was the best for the winter period. The mean wind power density at the location was found to be 45.88 W/m2. The WAsP software was used to create the wind resource map. Five potential sites were selected installing the wind turbines and for carrying out the economic analysis, which included an estimation of annual energy production. It was found that, for the five turbines average capacity factor would be 20.05%. The payback period for installing the wind turbines at 50 m above the ground level is estimated to be between 6.99 and 8.74 years.

    Citation: Saiyad S. Kutty, M. G. M. Khan, M. Rafiuddin Ahmed. Estimation of different wind characteristics parameters and accurate wind resource assessment for Kadavu, Fiji[J]. AIMS Energy, 2019, 7(6): 760-791. doi: 10.3934/energy.2019.6.760

    Related Papers:

    [1] Takvor Soukissian, Anastasios Papadopoulos, Panagiotis Skrimizeas, Flora Karathanasi, Panagiotis Axaopoulos, Evripides Avgoustoglou, Hara Kyriakidou, Christos Tsalis, Antigoni Voudouri, Flora Gofa, Petros Katsafados . Assessment of offshore wind power potential in the Aegean and Ionian Seas based on high-resolution hindcast model results. AIMS Energy, 2017, 5(2): 268-289. doi: 10.3934/energy.2017.2.268
    [2] Nour Khlaifat, Ali Altaee, John Zhou, Yuhan Huang . A review of the key sensitive parameters on the aerodynamic performance of a horizontal wind turbine using Computational Fluid Dynamics modelling. AIMS Energy, 2020, 8(3): 493-524. doi: 10.3934/energy.2020.3.493
    [3] Elio Chiodo, Pasquale De Falco, Luigi Pio Di Noia, Fabio Mottola . Inverse Log-logistic distribution for Extreme Wind Speed modeling: Genesis, identification and Bayes estimation. AIMS Energy, 2018, 6(6): 926-948. doi: 10.3934/energy.2018.6.926
    [4] Malhar Padhee, Rajesh Karki . Bulk system reliability impacts of forced wind energy curtailment. AIMS Energy, 2018, 6(3): 505-520. doi: 10.3934/energy.2018.3.505
    [5] Wolf-Gerrit Früh . From local wind energy resource to national wind power production. AIMS Energy, 2015, 3(1): 101-120. doi: 10.3934/energy.2015.1.101
    [6] María del P. Pablo-Romero, Rafael Pozo-Barajas . Global changes in total and wind electricity (1990–2014). AIMS Energy, 2017, 5(2): 290-312. doi: 10.3934/energy.2017.2.290
    [7] Majid Deldar, Afshin Izadian, Sohel Anwar . Analysis of a hydrostatic drive wind turbine for improved annual energy production. AIMS Energy, 2018, 6(6): 908-925. doi: 10.3934/energy.2018.6.908
    [8] Ammar E. Ali, Nicholas C. Libardi, Sohel Anwar, Afshin Izadian . Design of a compressed air energy storage system for hydrostatic wind turbines. AIMS Energy, 2018, 6(2): 229-244. doi: 10.3934/energy.2018.2.229
    [9] Ferhat Bingol . Feasibility of large scale wind turbines for offshore gas platform installation. AIMS Energy, 2018, 6(6): 967-978. doi: 10.3934/energy.2018.6.967
    [10] Azevedo Joaquim, Mendonça Fábio . Small scale wind energy harvesting with maximum power tracking. AIMS Energy, 2015, 2(3): 297-315. doi: 10.3934/energy.2015.3.297
  • Wind resource assessment is carried out for a site in Kadavu, Fiji Islands. This included estimating the Weibull parameters and wind power density using ten different methods and carrying out an economic analysis. The wind speeds at 34 m and 20 m above ground level, wind direction, atmospheric pressure and temperature were measured for 18 months and statistically analyzed. The overall average wind speed at a height of 34 m above ground level was found to be 3.63 m/s. The seasonal averages for the site were 3.81 m/s and 3.40 m/s for summer and winter respectively. The diurnal variation of the wind shear for the site was correlated with the temperature variation. The Moments Method was found to be the best method for the entire period of study. The Modified Maximum Likelihood Method was found to be the best for the summer season whilst Median and Quartile method was the best for the winter period. The mean wind power density at the location was found to be 45.88 W/m2. The WAsP software was used to create the wind resource map. Five potential sites were selected installing the wind turbines and for carrying out the economic analysis, which included an estimation of annual energy production. It was found that, for the five turbines average capacity factor would be 20.05%. The payback period for installing the wind turbines at 50 m above the ground level is estimated to be between 6.99 and 8.74 years.


    Nomenclature: A: Scale Factor, m/s; AGL: above ground level; COE: coefficient of efficiency; EPF: energy pattern factor method; k: shape factor; LS: least squares method; MAE: mean absolute error; MAPE: mean absolute percentage error, %; ML: Maximum Likelihood Method; MML: Modified Maximum Likelihood Method; MO: Moments Method; MMOM: Method of Multi-Objective Moments; MQ: Median and Quartiles Method; N: number of observations; R2: Coefficient of determination; RMSE: root mean square error, m/s; TI: Turbulence Intensity, %; U: wind speed, m/s; ¯U: mean wind speed, m/s; Um: median wind speed, m/s; WAsP: wind atlas analysis and application program; WPD: wind power density, W/m2; α: wind shear coefficient; Γ: gamma function; σ: standard deviation of wind speed, m/s

    Renewable energy is the cleanest energy resource available to us. This type of energy is increasingly used globally. According to [1,2], the use of renewable energy sources not only helps improve the economy of any country and social well-being but also is an important factor to have a future without the dangerous effects of climate change and this is only through decreasing/eradicating the use of conventional sources of energy: coal, gas and oil. Fossil fuels are non-renewable, that is, they draw on finite resources that will eventually dwindle and will become too expensive or too environmentally damaging to retrieve [3]. The harmful effect of burning the fossil fuel is the production of harmful gases that cause global warming [4]. While these conventional sources of energy helped many nations to get developed, they are also destroying the natural environment. On the other hand, renewable sources of energy help diminish greenhouse gas emission and reduce global warming [5]. According to Razykov et al. [6], the current usage of energy throughout the world is 10 TW-year and it is estimated that by 2050 the usage will increase to 30 TW-year. Most of the countries are moving towards greater utilization of renewable energy resources; some of these resources are wind, solar, tidal and wave energy.

    Some other benefits of renewable energy are that they will create jobs and will also help countries save the money that is used to import the fossil fuels. There will also be no problem of supply since renewable sources will be available locally [3]. Scientists and Engineers around the globe are finding ways to utilize these sources of energy and decrease the use of fossil fuels.

    Wind energy was first used in wind-propelled boats dating back to 6000 BC [7]. Over time it went from wind-propelled boats to food production. The windmills were used by the American colonists to grind food, to cut wood at sawmills and to pump water. Wind energy-based power generation gained popularity in the 20th century. When the price of oil decreased in 1950s, the popularity of wind energy decreased. But by 1970s, the demand for wind energy increased due to increase in oil prices. In the last two decades, renewable energy utilization started to increase and wind energy started to thrive in places where wind power density was good.

    Due to the increasing demand for renewable energy, it is imperative for researchers to perform detailed assessments of wind energy because it is one of the major renewable sources of energy throughout the globe. Since the beginning of the 21st century, more research work started on the assessment of wind resource. This assessment will be helpful to the energy companies to design and install new wind turbines/farms.

    There have been a lot of studies on wind resource assessment. Some of these include studies done in Hong Kong [8] where they used four different methods to find the Weibull parameters and estimate the errors in the parameters. It was found that the parameters differ in seasons. The wind power density was also calculated for the sites. One of the major results found was that Weibull parameters estimated for urban sites recorded a low scale factor compared to the hilltops that were at a much higher elevation. Another paper which reported the wind resource assessment for Iran where Dabbaghiyan et al. [9] found that Iran has a good wind energy potential than can be used for generating electricity for the country. In the research, one year of wind data were used to analyze the wind resource for the four sites in Iran. The analysis was done at three different heights of 10 m, 20 m and 40 m. An average wind speed of 5.93 m/s at 40 m above ground level (AGL) for Bordkhum was recorded which was the highest compared to the other three sites. The wind power density for the site was 175 W/m2 at 40 m AGL. For the economic analysis, 12 different models of wind turbine were used of which Proven 15 wind turbine showed the best capacity factor. One more work which reported wind resource assessment in Iran was by Fazelpour et al. [10] who studied the wind power potential for four locations and it was found that Zabol and Zahek have good potential as it had the highest average wind speed. The highest wind power density recorded for Zabol was 284.97 W/m2.

    A study conducted in Faya-Largeau, Chad by Soulouknga et al. [11] concluded that due to high consumption of electricity it is vital to use renewable energy like the wind energy over fossil fuel. They carried out wind resource assessment to find the wind power potential in the city of Faya-Lageau in the Saharan zone of Chad. It was found that the energy pattern factor was the best approximation method to find the k and the A values. By using the Weibull parameter estimation from 18 years of data, they found that the maximum wind average of 4 m/s was recorded for the month of January.

    A study by Bassyouni et al. [12] in Jeddah found that the wind speed for Jeddah is higher for months of March to August. In the analysis, 10 years of wind data were used to find the Weibull parameters and also the average wind speeds. It was also recommended to install smaller turbines than larger ones since the wind average calculated ranged between 2.866 m/s and 3.875 m/s. The smaller turbines are generally used in areas with low wind speed and larger wind turbines in the regions which have high winds. The wind turbine used in their analysis is small due to the average wind speed in the low wind speed range. Another important reason for using smaller wind turbines is because smaller wind turbines have higher rotational speeds and higher aerodynamic efficiency. According to Mohammadi et al. [13], it was found that different sites used different methods of Weibull parameter estimation since the wind characteristics of the site determine that best approximation method. The best method for the stations located at Edmonton and Grande Prairie was EPF method while for the stations at Lethbridge and Waterton Park Gate, the EMJ method was the effective method of approximation.

    Another study that confirms that different Weibull parameter estimation methods are applicable to different sites was done by Werapun et al. [14] in Phangan Island, Thailand where it was concluded that energy pattern factor method was very effective in the calculation of Weibull parameters. According to Azad et al. [15], the most effective Weibull parameters estimation method was the Moments Methods (MO) out of the four methods that were used in the study for Hatiya Island. It was also found that the winds in Hatiya were predominantly higher ranging between 2.62 m/s and 14.01 m/s. It was concluded that the site has potential to generate power using small wind turbines for the generation of electricity.

    Wind resource assessment for Jhampir in Pakistan was carried out using 10 years of averaged 10 minutes wind data [16]. Using three different methods of Weibull approximation, the best method was found to be the Maximum Likelihood Method (MML). In the months of May to October, wind speeds were higher compared to other months. The highest WPD was recorded in May. The predominant wind speed recorded was blowing from 250°. The total annual energy which can be harvested was estimated to be 10054.27 kWh. The turbine and plant efficiency calculated were 40% and 46% respectively.

    Kombe et al. [17] reported that the MO is the best method for Weibull parameter approximation after only analyzing two methods with the error analysis using only the root mean square error method. In the analysis, 10 years of monthly mean data of Great Cumbrae Island were used from the National Aeronautic Space Administration (NASA). The calculated mean wind speed was 7.598 m/s and the wind power density calculated for the region was 483.50 W/m2. According to them, the best wind turbine for the site was the GE 2.0 platform, which was estimated to produce 4.5 GWh of annual energy. Their study could have been more accurate if more methods of Weibull approximation were used with different methods of error analysis.

    From the above studies, it is clear that different methods of finding Weibull parameters will be applicable for different locations. Thus, it is important to find the best method for any site where wind resource assessment is to be carried out. For the present work, the wind data from a site on the Kadavu group of islands will be assessed for finding the best method from ten different methods of finding Weibull parameters. The ten different methods which are used are: the median and quartiles method (MQ), the moments method (MO), the empirical method of Justus (EMJ), the empirical method of Lysen (EML), the least squares method (LS), the maximum likelihood method (ML), the modified maximum likelihood method (MML), the energy pattern factor method (EPF), the WAsP method and method of multi-objective moments (MM). To find the best method, error analysis is performed. The wind power density from the best method is calculated using 18 months of data. The wind shear and turbulence intensity (TI) analysis is also carried out. The wind rose plots will be used to show the predominant wind speed and direction. To conclude the findings, the annual energy production is estimated and the economic analysis is carried out.

    The site under this study was one of the islands in the Kadavu group, in the southern Fiji. The site is located at a latitude of 18°59'1.91"S and a longitude of 178°26'4.06"E. Figure 1 shows the location of the measurement point in the map of Kadavu islands. Kadavu group of islands has an area of 411 square kilometers. The main center for the people of Kadavu is Vunisea which has the hospital, airstrip, schools and other necessary government service centres. According to the latest population count, Kadavu has a total of 10,897 people [18]. In recent years, tourism sector started to flourish but their main source of income is from exporting seafood and kava. Kadavu group has been one of the least developed islands of Fiji. The islands are home to many diverse flora and fauna such as lizards, birds, and some unique flowers [19].

    Figure 1.  Map of Kadavu Islands showing the measurement location [20].

    A 34 m tall tower was installed at the site. The sensors installed on the tower measured wind direction, wind speeds, pressure, temperature, and rainfall. Two anemometers were placed at 34 m and one at 20 m AGL. The data-logger used was SymphoniePlus3 which has an external storage where the 10 minutes averaged data were processed and logged. The data-logger has 15 channels that can log data for the maximum, minimum, mean, and the standard deviation of the 10 minutes recordings. The data may be extracted manually from the SD card or otherwise an extra module is used to send the data via GSM network using the Symphonie® IPackGPS which contains a SIM card. This Symphonie® IPackGPS was programmed to send the data each day via the GSM network as an email attachment using the SIM card. For better durability and to get a better performance, the anemometers had 3 rugged Lexan cups molded into one piece. The accuracy of the anemometers is 0.1 m/s in the range of 5–25 m/s. The wind vane was aligned to the true north and placed at 30 m AGL. A temperature sensor was mounted on the tower to get the measurements of temperature. For obtaining accurate values of temperature, a circular six radiation shield was provided around the sensor. A barometric pressure sensor was mounted for recording atmospheric pressure. The specifications of the sensors are shown in Table 1.

    Table 1.  Specifications of the measurement sensors [21].
    Parameter Sensor Type Range Accuracy
    Wind speed NRG#40 maximum anemometer 1.0–96.0 m/s 0.1 m/s
    Wind direction NRG 200P direction vane 0–360° N/A
    Pressure NRG BP-20 barometric pressure sensor 15–115 kPa 1.5 kPa
    Temperature NRG 110S −40 ℃–65 ℃ 1.1 ℃

     | Show Table
    DownLoad: CSV

    There were some uncertainty values which had to be taken into account. Some of the uncertainties were the calibration errors, the terrain of the site that was used, the dynamic over-speeding, the error that gets introduced due to the wind shear and the inflow angle. This research is based on averages of very large data set samples, thus it may be stated that each parameter tested has an error which is less than 1%.

    The data that were obtained for the analysis had to be validated before processing. The very first test done was the range test. The wind data for the 34 m and the 20 m were checked to be in the range 0.4–25 m/s. The maximum wind speeds that were recorded at 34 m and 20 m AGL were 21.9 m/s and 20.9 m/s respectively. There was some error in recording for two months of temperature data that were corrected using the data from another source. For other months, the average temperatures were between the stated range of 15–40 ℃. The maximum 10-minute average temperature recorded was 37.2 ℃ and the minimum was 16.2 ℃. The wind speeds measured at 34 m AGL for the entire period from the two anemometers were compared and are shown in Figure 2. The average difference between the mean wind speeds for the two anemometers at 34 m AGL was 3.25%.

    Figure 2.  Comparison of wind speeds from the two anemometers installed at 34 m AGL.

    The mean wind speed was calculated from a series of data. According to Zhang [22] the equation used to find the average wind speed is shown in Eq (1):

    ˉU=1nni=1Ui (1)

    where ˉU is the average wind speed and Ui is the wind speed recorded at constant intervals i.e., 10 minutes average for the data under study, n represents the number of observations and i is the interval at which the data are recorded. The overall average wind speed for 34 m AGL recorded over the assessment period was 3.63 m/s.

    The data were first analyzed for the average daily wind speed. Figure 3 shows the average daily wind speed for the site in Kadavu at 34 m AGL. The assessment period for the data were from March 2012 to August 2018. It was seen over the period the daily average wind speed was between 1.59 m/s and 9.34 m/s. The maximum 10 minutes average wind speed was recorded on the 17th of December 2012 of 21.9 m/s and also the maximum wind speed recorded was 33.6 m/s recorded on the same day.

    Figure 3.  Daily average wind speed at 34 m AGL.

    The results of the hourly mean wind speed, averaged over the entire duration of measurements, are shown in Figure 4. From the figure, it can be seen that during the day wind speed normally starts increasing at 8 am from 3.4 m/s and reaches the peak of 4.27 m/s at around 2 pm then it starts to decrease and stabilizes, with minimum wind speed changes, to 3.36 m/s at around 8 pm. This indicates that the site is windier more during the day compared to night.

    Figure 4.  Diurnal variation of wind speed at 34 m AGL for the entire measurement period.

    The monthly averaged wind speeds are shown in Figure 5. It was found that average wind speed was highest in the month of December. It is noted that the average wind speed for the months of October, November, December, January and April are higher. From the results, it is observed that summer months are mostly windier. The results were further analyzed for wind averages for every month of measurements, as shown in Figure 6 and it was found that the wind speeds for March 2012 and December 2012 were higher compared to other months. In March 2012 there was a tropical disturbance that caused high winds for the whole of Fiji group and flash flooding. High wind speeds were again recorded in the month of December 2012 as Fiji was hit by cyclone Evan. As Fiji has a cyclone period from November to April, the winds recorded in these months are always expected to be higher.

    Figure 5.  Monthly averaged wind speed for 34 m AGL for the summarized entire period.
    Figure 6.  Monthly average wind speed at 34 m AGL for each month of measurement period.

    Figure 7 shows the seasonal mean wind speed at the site in Kadavu. Fiji has only two seasons—winter (dry season) and summer (wet season). The average of the summer wind speed is greater compared to the winter months. This is because the Fiji group has a warm tropical climate and during the summer period it is known to be a cyclone season with high wind speeds and this is evident in Figure 7.

    Figure 7.  Seasonal average wind speeds at 34 m and 20 m AGL.

    One of the best ways to express the wind profile is by doing the wind shear analysis. According to Zhang [22] ‘Wind profile enables us to deduce the mean wind speed from one height to another and tells us the wind speed difference between two heights’. The easiest way to find the wind shear coefficient is by using the logarithmic formula [21] as shown in Eq (2),

    α=ln(U2U1)ln(h2h1) (2)

    where α is the wind shear and U and h are the wind speed and the height respectively. Wind shear coefficients is found by taking wind speeds at two different heights but most of the meteorological sites only have anemometers placed on one specific height which makes it difficult for researchers to find wind shear coefficient. In the present work, wind speeds were measured at two different heights to find the wind shear coefficient. Wind shear values are never constant; this is similar to the case of a wind profile but it varies with the mean wind speed, the direction of the wind flow, atmospheric condition, the time of the day, the nature of the terrain, humidity, pressure, temperature and also the wind direction [23].

    The diurnal variation of the WSC is shown in Figure 8. The WSC is directly related to the diurnal heating/cooling cycle of air above the ground. It is evident from several past works [21,23,24,25] that WSC is higher during the night and lower during the daytime. This is because during the day the heating effect of the ground surface and the air takes place thus decreasing the WSC. On the other hand, at dawn and night the cooling effect is evident. From the figures it observed that during the 24 hours of the day, the heating and the cooling cycle of the air adjacent to the earth influences the wind shear coefficient. From midnight till the daybreak, the WSC is nearly constant with a slight increase in morning but after 6 am it is observed that the values start to decrease, this shows the heating of the ground and the air above it, and values kept decreasing until 9 am then remaining nearly constant until 3 pm. The cooling effect of the surface of the ground and the air above the ground is shown after 3 pm when the WSC starts to increase till about 6 pm and then remains essentially constant throughout the night. Thus this pattern of the WSC with respect to the heating and cooling effects are observed with the results obtained. The overall WSC is dependent on the orography of the area. The more complex the land terrain, the effects will be seen in the wind speed. Some complex land forms include tall trees, large buildings and high mountains. However, Kadavu does not have high rise buildings but has some mountains and trees. The site is situated in a flat land area and is close to the shoreline. The effect of the terrain is negligible on the WSC in the present case.

    Figure 8.  Average diurnal wind shear coefficient, α, for the entire measurement duration.

    Overall the WSC can be compared to the graph of average daily temperature shown in Figure 9. It is seen that the trends correlate well to the heating and cooling cycle. When the temperature starts to increase, the WSC starts to decrease and when the temperature decreases the WSC increases. The temperatures in the South Pacific region normally increase with sunrise and are found to be the maximum around 2–3 pm during the day; similar observations were reported by Aukitino et al. [21] and Singh et al. [26].

    Figure 9.  Average diurnal temperature variation for the entire measurement duration.

    From the monthly analysis of the WSC depicted in Figure 10, it is observed that the monthly average WSC is higher during the months of January and April; during these months, the turbulence levels were lower; however, the WSC also varies with the ambient temperature as the rising air at the time of high temperature reduces the wind shear. From the figure, it can be seen that the summer months have higher WSC compared to the winter months. The highest WSC was recorded in April with a value of 0.17 while October recorded the lowest WSC of 0.042.

    Figure 10.  Monthly average wind shear coefficient, α and Temperature.

    According to Zhang [22], turbulence has very harmful effects on the wind turbine components. This is because turbulence causes fatigue loads on the major components of the wind turbine. In wind resource assessment, the TI is used to quantify how much the wind may vary. Turbulence is also known as the fluctuations in wind speed with respect to time [21]. The TI can be calculated with Eq (3), i.e., the standard deviation divided by the mean wind speed.

    TI=σu¯U (3)

    TI values for a typical day for measurement site are shown in Figure 11. The average TI for a typical day was 26.26% and 28.87% at 34 m AGL and the 20 m AGL respectively. The minimum TI recorded for some typical days is about 18%. The 20 m AGL has a higher TI compared to the TI at 34 m AGL. From this observation, the results indicate that the lower the height of the anemometer (wind turbines) the higher the TI. To get a lower TI the height AGL must be increased.

    Figure 11.  Turbulence Intensity for a typical day.

    The turbulence is higher at the lower height of 20 m; this causes random mixing between air particles at different heights and reduces the WSC. However, the temperature also plays a role here, as the hot air rises up reducing the wind shear coefficient.

    The analysis of the wind direction is a vital part in the assessment of wind energy potential. This is because from this analysis the prevalent wind direction from which the maximum energy can be harnessed will be known. Figure 12 shows the wind rose plot for the entire period of study for the site. The wind rose plot was divided into 12 sectors of 30° angle. The 10 minutes wind data was obtained at 34 m AGL placed anemometer considering the wind direction being invariant with height. The wind directions for summer and winter seasons are shown in Figures 13 and 14 respectively. It is shown in Figure 12 that the predominant wind direction is mostly between 60° and 150°. The winter wind rose as shown in Figure 14 indicates that the dominant wind direction is between 60° and 150° which is similar to the overall wind rose. However there is a slight difference in the summer wind rose. The summer wind rose indicates that the dominant wind direction is between 60° and 120°. This result also indicates that summer, winter and overall wind directions have no major differences. The dominant wind force for the Pacific Ocean is the south east trade winds. Due to the site location and the terrain, the prevalent wind is from the east.

    Figure 12.  Wind Rose Plot for the overall period.
    Figure 13.  Wind Rose Plot for summer.
    Figure 14.  Wind Rose Plot for winter.

    The Weibull parameters were found with a detailed statistical analysis of the measured data. Weibull parameters have importance in determining the wind speed parameters for the specific hour, day, week month and year. The wind speed are never negative and also the wind speed are bounded only to one side [22] thus normal distribution cannot be used. The Weibull probability density function (4) using the two parameters k and A is given by:

    f(U)=kA(UA)(k1)e(uA)k (4)

    where U is the wind speed, k is the shape factor and A is the scale factor.

    The Weibull distribution with accurate Weibull parameters will be used to determine the energy production for five selected turbine locations. The different methods for estimating the Weibull parameters used in the present work are listed:

    ⅰ.Median and quartiles method

    According to Justus [27], the k an A values can be calculated using the median velocity (Um) and the quartile velocities which are at 25% (U0.25) and at 75% (U0.75), thus k and A are obtained using:

    k=ln[ln(0.25)/ln(0.75)]ln(U0.75)/U0.251.573ln(U0.75)/U0.25) (5)
    A=Umln(2)1/a (6)

    ⅱ.Moments method

    This method was suggested by Justus and Mikhail in 1977 [27]. In this method, the mean wind speed and the standard deviation of the wind speed are used to determine the k and A values. This method is an alternative to maximum likelihood method. The Eq (7) and (8) to find k and A are given below [28,29,30]:

    ¯U=AΓ(1+1k) (7)
    σ=A[Γ(1+2/k)Γ2(1+1/k)]1/2 (8)

    ⅲ.Empirical method of justus

    This method was first used by Justus [27]. According to Justus [28,29], the k ad A values can be calculated as shown in the Eqs (9) and (10)

    k=[σ¯U]1.086 (9)
    A=¯U/Γ(1+1/k) (10)

    ⅳ.Empirical Method of Lysen

    This method was introduced by Lysen[31] and is modified from the empirical method of Justus. The method for obtaining k value is the same as Eq (9) but the equation of A differs. The Eq (11) of A is obtained by [28,29]:

    A=¯U(0.568+0.433/k)1k (11)

    ⅴ.Least Squares Method

    Least Square fit is one of the most useful methods that are used in engineering. This method is more formalized of the plotting technique of manual probability, in which this methods provides the technique to mathematical method. It is the linear correlation of the two variables are assumed. The Weibull parameters are found after some lengthy calculations. The final k equation and c Eqs (12) and (13) are written below [28,29].

    k=nni=1ln U×ln[ln{1f(U)}]ni=1lnU×ni=1ln[ln{1F(U)}]nni=1lnU2{ni=1lnU}2 (12)
    A=exp[kni=1ln Uni=1ln[ln{1F(U)}]nk] (13)

    ⅵ.Maximum Likelihood Method

    To find the k and A parameters, this method requires high level numerical iterations. This method uses a likelihood function of the wind speed data in time series format. For instance the values for a random wind data set (U1, U2, U3...Un) are given and the Weibull probability density function is given. The likelihood function from the given sample L (k, A, U1, U2, U3...Un) can be stated as in equation (14) [13,30,32,33]:

    L(k;A;U1;U2;U3;......Un)=ni=1f(k,A,Ui) (14)

    where the function is further simplified to:

    lnL=ni=1ln[f(Ui)] (15)

    This equations gives rise to the equations for k and A values:

    lnLk= 0 (16)
    lnLA= 0 (17)

    From the Eqs (18) and (19), k and A are formulated as below:

    k=[ni=1UkilnUini=1Ukini=1lnUin ]1 (18)
    A=[1nni=1(Ui)k]1k (19)

    ⅶ.Modified Maximum Likelihood Method

    This method is similar to that of maximum likelihood method. But when the wind data in given in the frequency distribution form, then this method is used to get the parameters k and A. This method involves high level numerical analysis. The Eqs (20) and (21) are obtained by modifying the equation of maximum likelihood method [13,30,32,33].

    k=[ni=1UkilnUif(Ui)ni=1Ukini=1lnUif(Ui)f(U0) ]1 (20)
    A=[1f(U0)ni=1(Ui)kf(Ui)]1k (21)

    where the variables are: Ui is the wind speed central to time interval i, the numerical number of bins is represented by n, f(Ui) represents the frequency the wind ranges in n.f(U0) represents the wind speed probability that is equal to or greater than zero.

    ⅷ.Energy Pattern Factor Method

    This method is also known as the power density method. In this method, the ratio of the mean of the cubic wind speed and the cubic of the mean wind speed is the energy pattern factor. To find the parameters k and A, the first thing to find is the energy pattern factor from Eq (22) [22,28,29,30]:

    Epf=¯U3(¯U)3=Γ(1+3/k)Γ(1+1/k)3 (22)

    where ¯U3 represents the mean of the cube of wind speed and (¯U)3 represents the cube of the mean wind speed. Thus the k and A parameters are represented by Eqs (23) and (24):

    k=1+3.69E2pf (23)
    A=¯UΓ(1+1/k) (24)

    ⅸ.WASP Method

    This method requires computer-aided calculations. The software for this method was developed by the RisØ National Laboratory in 1987 for analysing wind data. This software enables to calculate the energy yield, wind farm efficiency, wind resource and turbulence mapping, calculation of wind conditions like mean wind speed, wind shear, ambient turbulence, extreme wind and wind flow inclination and also the Weibull parameters k and A values. There are various versions available but version 11 is used in the present work for calculating the k and A values. The WAsP method has the following requirements [21]:

    a) The WAsP method does not directly fit the measured frequency histogram.

    b) The mean power densities from the fitted Weibull distribution should be equal to that of the observed one.

    c) The proportion of values above the mean observed wind speed from the fitted Weibull distribution should be equal to those from the observed distribution.

    From these requirements the equation of U is derived as shown in Eq (25):

    U=ni=1U3iNΓ(3k+1) (25)

    From the cumulative distribution function F(U), the values less than U are obtained. Thus the values that exceed U are represented by 1F(U). Fom the last requirement, the proportion of the observed wind speeds that exceed the mean observed wind speed must be obtained and we represent it as Z, thus Z will be:

    Z=1F(U) (26)
    (¯U3ni=1U3iNΓ(3k+1))k=ln(Z) (27)

    First Z is calculated from Eq (26) then k is obtained from Eq (27).

    ⅹ.Method of Multi-Objective Moments

    This method is recently introduced by Usta et al. [34]. This method proposes the squared deviance minimization between the sampling moments and the first three moments. To find the Weibull parameters, the following equation is used:

    λ1(AΓ(1+1k)¯U)2+λ2(A2Γ(1+2k)¯U2)+λ3(A3Γ(1+3k)¯U3) (28)

    For theλ1, λ2, λ3 it is taken into consideration that:

    λ1+λ2+λ3=1 (29)

    The rth sampled moments are represented by

    ¯Ur=ni=1Urin (30)

    All of the above methods are used in the present work to find the Weibull parameters k and A. Since different location have different wind characteristics as discussed earlier, the best method out of the above need to be used at a site. All of the above must be tested before concluding which method is the best one for the given site.

    From the conclusions of the journals and books [13,22,30,33,35] it is clear that different methods are suitable for different sites. It would be inappropriate to say that only a single method is the best method to find the Weibull parameters. In Tables 27, the results from all the methods of determining Weibull parameters are presented with an elaborate error analysis.

    Table 2.  The Weibull parameters, k and A, mean wind speed and WPD and goodness of fit test/errors obtained using different methods.
    Method k A ¯U WPD R2 COE RMSE MAE MAPE
    MQ 2.42 3.96 3.51 40.50 0.9084 1.6793 0.7661 0.1629 3.7692
    MO 2.35 4.10 3.63 45.89 0.9183 1.3743 0.5888 0.1448 3.8005
    EMJ 2.36 4.10 3.63 45.73 0.918 1.394 0.5981 0.1456 3.745
    EML 2.36 4.10 3.63 45.77 0.9182 1.3946 0.5978 0.1479 3.8242
    LS 1.97 4.85 4.30 89.37 0.9809 0.616 0.6793 0.5255 12.8375
    ML 2.32 4.10 3.63 46.52 0.9197 1.3131 0.5593 0.1533 4.0439
    MML 2.23 4.04 3.58 45.81 0.9271 1.2368 0.5115 0.1468 4.6466
    EPF 2.24 4.10 3.63 47.78 0.9301 1.1941 0.4843 0.1549 4.5914
    WAsP 2.13 4.10 3.63 49.93 0.9418 1.0362 0.4049 0.1811 5.7155
    MMOM 2.16 4.53 4.01 66.45 0.9514 0.8395 0.4984 0.3781 9.4886

     | Show Table
    DownLoad: CSV
    Table 3.  Performance evaluation by Ranking.
    Method k A ¯U WPD R2 COE RMSE MAE MAPE Overall Ranking
    MO 2.35 4.1 3.63 45.89 7 4 6 1 3 1
    EMJ 2.36 4.1 3.63 45.73 9 3 8 2 1 2
    EML 2.36 4.1 3.63 45.77 8 2 7 4 4 3
    EPF 2.24 4.1 3.63 47.78 4 7 2 6 6 4
    MML 2.23 4.04 3.58 45.81 5 6 4 3 7 5
    ML 2.32 4.1 3.63 46.52 6 5 5 5 5 6
    WAsP 2.13 4.1 3.63 49.93 3 8 1 8 8 7
    MQ 2.42 3.96 3.51 40.50 10 1 10 7 2 8
    MMOM 2.16 4.53 4.01 66.45 2 9 3 9 9 9
    LS 1.97 4.85 4.30 89.37 1 10 9 10 10 10

     | Show Table
    DownLoad: CSV
    Table 4.  The Weibull parameters, k and A, mean wind speed and WPD and goodness of fit test/errors obtained using different methods for the summer season.
    Method k A ¯U WPD R2 COE RMSE MAE MAPE
    MQ 2.41 4.19 3.71 48.22 0.9073 2.0328 1.0602 0.2591 4.6856
    MO 2.22 4.36 3.86 57.99 0.9235 1.383 0.6473 0.2291 5.4699
    EMJ 2.23 4.36 3.86 57.75 0.9227 1.4052 0.6611 0.2286 5.3722
    EML 2.23 4.36 3.86 57.82 0.9225 1.4028 0.6603 0.232 5.4636
    LS 1.85 4.9 4.35 98.83 0.9732 0.6225 0.6268 0.4699 11.4017
    ML 2.21 4.37 3.87 58.68 0.9259 1.3486 0.623 0.2282 5.4958
    MML 2.14 4.3 3.80 57.21 0.9315 1.3148 0.5928 0.2132 5.8339
    EPF 2.09 4.36 3.86 61.20 0.937 1.156 0.504 0.2354 6.5823
    WAsP 1.94 4.3 3.81 63.36 0.9525 0.965 0.4051 0.2638 8.5247
    MMOM 2.17 4.92 4.35 84.97 0.9414 0.9283 0.6057 0.4786 11.252

     | Show Table
    DownLoad: CSV
    Table 5.  Performance evaluation by ranking for summer.
    Method k A ¯U WPD R2 COE RMSE MAE MAPE Overall Ranking
    MML 2.14 4.3 3.80 57.22 5 6 3 1 6 1
    ML 2.21 4.37 3.87 58.68 6 5 5 2 5 2
    EMJ 2.23 4.36 3.86 57.75 8 2 9 3 2 3
    MO 2.22 4.36 3.86 58.00 7 4 7 4 4 4
    EPF 2.09 4.36 3.86 61.21 4 7 2 6 7 5
    WAsP 1.94 4.3 3.81 63.37 2 8 1 8 8 6
    EML 2.23 4.36 3.86 57.82 9 3 8 5 3 7
    MQ 2.41 4.19 3.71 48.23 10 1 10 7 1 8
    MMOM 2.17 4.92 4.36 84.97 3 9 4 10 9 9
    LS 1.85 4.9 4.35 98.83 1 10 6 9 10 10

     | Show Table
    DownLoad: CSV
    Table 6.  The Weibull parameters, k and A, mean wind speed and WPD and goodness of fit test/errors obtained using different methods for the winter season.
    Method k A ¯U WPD R2 COE RMSE MAE MAPE
    MQ 2.42 3.84 3.40 36.91 0.998 0.9717 0.0745 0.0292 1.9171
    MO 2.55 3.89 3.45 37.12 0.9959 1.0432 0.0995 0.0637 2.6745
    EMJ 2.56 3.89 3.45 37.04 0.9962 1.051 0.0986 0.0631 2.54
    EML 2.56 3.89 3.45 37.05 0.9962 1.051 0.0986 0.0631 2.5399
    LS 2.78 4.17 3.71 43.46 0.9906 1.0406 0.2851 0.2647 8.7411
    ML 2.55 3.9 3.46 37.37 0.9962 1.042 0.0968 0.065 2.6234
    MML 2.43 3.83 3.40 36.72 0.9979 0.9751 0.0758 0.0304 1.9348
    EPF 2.49 3.89 3.45 37.79 0.9969 0.9981 0.0805 0.0407 2.1108
    WAsP 2.74 3.9 3.47 35.92 0.9923 1.1791 0.1832 0.1293 4.3039
    MMOM 2.16 4.18 3.70 52.08 0.9989 0.6837 0.3449 0.2665 7.4227

     | Show Table
    DownLoad: CSV
    Table 7.  Performance evaluation by ranking for winter.
    Method k A ¯U WPD R2 COE RMSE MAE MAPE Overall Ranking
    MQ 2.42 3.84 3.40 36.91 2 2 1 1 1 1
    MML 2.43 3.83 3.40 36.72 3 3 2 2 2 2
    EPF 2.49 3.89 3.45 37.79 4 4 3 3 3 3
    EMJ 2.56 3.89 3.45 37.04 5 8 5 4 5 4
    EML 2.56 3.89 3.45 37.05 6 9 6 5 4 5
    ML 2.55 3.9 3.46 37.37 7 6 4 7 6 6
    MMOM 2.16 4.18 3.70 52.08 1 1 10 10 9 7
    MO 2.55 3.89 3.45 37.12 8 7 7 6 7 8
    WAsP 2.74 3.9 3.47 35.92 9 10 8 8 8 9
    LS 2.78 4.17 3.71 43.46 10 5 9 9 10 10

     | Show Table
    DownLoad: CSV

    To determine which method is the best method for any location, a quantitative assessment of the performance of the method must be done. There are various methods to assessments, some of which are:

    ⅰ.Root Mean Square error (RMSE)

    The RMSE is calculated using Eq (31) [21,28,29]. The RMSE checks for accuracy of the model by checking the value obtained by the Weibull function and the raw data that were measured. The lower the RMSE, the better the Weibull parameter estimation method. The RMSE calculated value never has a negative value.

    RMSE=1nnt=1(ˆUtUt)2 (31)

    ⅱ.Coefficient of determination (R2)

    It checks the method’s ability to estimate the variables accurately. It is considered that the higher the R2 the better the method is. The range of R2 is between 0 and 1. Equation (32) shows how the R2 is calculated [28,29].

    R2=ni=1|UtˆUt|ni=1|UtˉUt| (32)

    The variables Ut and ˆUt are the actual wind speed and the predicted wind speed respectively. The subscript t stands for the time (1, 2, 3…... n) and n stands for the number of observations that are made.

    ⅲ.Mean absolute error (MAE)

    It is a measure of the difference between two continuous variables. The MAE is the average of the absolute errors. The lower the MAE the better the accuracy. Eq (33) shows the calculation of MAE [21].

    MAE=1nnt=1|ˆUtUt| (33)

    ⅳ.Mean absolute percentage error (MAPE)

    The MAPE calculates the difference between the winds speeds computed using a Weibull function to that of the measured values. The value of MAPE is calculated using Eq (34) [21,28,29]:

    MAPE=1nni=1|ˆUtUtUt|x100 (34)

    ⅴ.Coefficient of efficiency [30]

    Another way to check the efficiency of a method is by using the COE. The greater the COE, the better the accuracy of the method [21].

    COE=Ni=1(ˆUtˉU)2Ni=1(UˉU)2 (35)

    Table 2 shows the Weibull parameters, k and A, mean wind speed and WPD and goodness of fit test/errors (COE, RMSE, R2, MAE and MAPE) obtained using different methods of parameter estimation discussed below. Further in Table 3 the table has been modified to show the ranking of the different methods. It is observed that the MO method has the best accuracy through having the best overall ranking (the sum of all the error/goodness of fit estimates). The MAE was the lowest and MAPE was the second lowest. This shows that the best method used for the calculating the wind power density for this site will be Moments method. The WPD found for this site using the MO method is 45.89 W/m2.

    The data were further analyzed for the two different seasons (summer and winter) that Fiji experiences. From the results, it can be seen that the Weibull parameters are not the same for summer and winter. The results for each season are shown in Table 4 to Table 7. After ranking the methods using the different types of performance analysis, it is seen that the best Weibull parameter estimation method is the MML for the summer period while for the winter period it is seen that the MQ is the best estimation method. From the seasonal analysis, it is noted that even the seasons matter for the Weibull parameters estimation. From the measured data, the summer and winter mean wind speeds were calculated to be 3.86 m/s and 3.45 m/s respectively. From the Weibull parameter estimation the mean wind speed was found to be 3.8 m/s and 3.40 m/s for the summer and winter periods respectively. The mean wind speeds for winter and summer from the measured data were similar to the mean wind speeds calculated from the best Weibull parameter estimation method for the two seasons. Using the best approximation for each of the different seasons, the WPD noted are 36.90 W/m2 and 57.22 W/m2 for the winter and the summer seasons respectively.

    The data obtained were divided into cumulative frequency. Figure 15 shows the different parameter estimation Weibull curves for the overall period. The Weibull parameters and the Weibull curves were obtained using the ten different methods. The cumulative frequency showed that the data for 2 to 4 m/s showed the maximum percentage of wind speed for the overall as well as for different seasons. It was seen that the winter season had the highest wind speed of 10.5 m/s whilst the summer season reached a maximum of 21.9 m/s. It is rare for the wind speed reaching to that maximum speed. This maximum wind speed is due to high wind speeds during tropical disturbances or cyclones. The Weibull curves after analyzing were also studied for the summer and winter period which are represented by Figures 16 and 17.

    Figure 15.  Wind frequency distribution and Weibull distribution curves from ten different methods for the overall measurement period.
    Figure 16.  Wind frequency distribution and Weibull distribution curves from ten different methods for summer season.
    Figure 17.  Wind frequency distribution and Weibull distribution curves from ten different methods for winter season.

    The WAsP software was used to plot the wind power density map for Kadavu site. The accuracy of the wind resource map is based on the resolution of the digitized map. The resolution of the map is based on the rectangular sets of points which are evenly spaced in rows and columns. Before the wind resource grid is plotted, the generalized wind climate needs to be studied. To obtain a resource grid, the vector map must be digitized in which the roughness levels as well as the terrains of the location are determined. The final step is the calculations. Some of these calculations include wind power density, wind speed and Weibull parameters.

    For the AEP estimation, Vergnet 275 kW wind turbines were used in WAsP. WAsP is one of the important tools in the wind industry for AEP estimations. For estimation, the hub height of the turbine was taken as 50 m AGL, a rotor diameter of 32 m, a cut-in speed of 3 m/s, rated wind speed of 12.2 m/s with a density of 1.16 kg/m3 and a cut-out wind speed of 25 m/s. The power curve of the turbine is shown in Figure 18.

    Figure 18.  Power curve for the Vergnet 275 kW wind turbine.

    The Vergnet 275 kW wind turbines are used for further economic analysis. Some of the important reasons of choosing the Vergnet 275 kW wind turbines are used are:

    ●  During cyclones the turbines can be easily lowered

    ●  The maintenance is easy and not very costly

    ●  They have been installed and are performing very well in Vanuatu as well as in Fiji.

    The other turbines are also possible to be used to increase the AEP for the site selected. The other turbines are not used because:

    ●  The initial cost of these turbines are too high.

    ●  Larger turbine will increase the noise pollution as the islands are small.

    The average power generated by a turbine is obtained by taking the average wind speed for the time interval from time ti to ti+Δt for the period of N observations and is expressed as:

    ¯Pw=1NNt=1Pw(Ut) (36)

    where Pw(Ut) is the power output defined by the turbine power curve. Energy yield from the turbine can be expressed as:

    E=Nt=1Pw(Ut)(Δt) (37)

    Four of the sites selected for potential turbine installation are mostly close to the shorelines and are flat surfaces. The error in the estimation of wind speed will be negligible, since the measurements are performed at a height of 34 m AGL.

    To further analyze the wind characteristics, a wind resource grid was drawn using WAsP software. To find the wind resource grid, the map of Kadavu was first digitized. The digitized wind resource map showing the wind power density is shown in Figure 19. As an effect of some hilly and mountainous regions in Kadavu, the map shows them as the contours of very high wind power density. Also most of the area in Kadavu in covered with thick vegetation. The range of most of the WPDs for the map ranged between 6 W/m2 and 200 W/m2 but the peak was 462 W/m2. Five potential sites were chosen for wind turbine installation for further analysis. The annual energy production (AEP) was calculated for each selected site and the results are shown in Table 8.

    Figure 19.  High resolution wind power density map of Kadavu. The numbers 1–5 indicate the location of preferred installation sites for the turbines.
    Table 8.  AEP from five Vergnet 275 kW turbines at the Kadavu at 50 m AGL.
    Turbine Site Location [m] Power Density
    (W/m2)
    Net AEP
    [MWh]
    Capacity Factor
    (%)
    1 (652200, −2097200) 278 635.54 26.38
    2 (649996.6, −2101386) 173 422.631 17.54
    3 (648450, −2098900) 160 402.454 16.71
    4 (647877, −2095900) 186 451.532 18.74
    5 (646138, −2095900) 204 502.998 20.88

     | Show Table
    DownLoad: CSV

    The range of the AEP for the 5 sites was estimated to be between 402.45 MW to 635.54 MW. The total AEP of the Kadavu site for one year was calculated to be 2415.155 MW. The capacity factor for the 5 turbines was averaged and the value of 20.05% was obtained. The capacity factor is the generated AEP over the expected AEP for the wind farm. The wake loss for all the turbines is 0%, as they are not located close to each other or in the wake of other turbine(s). The range of the power densities obtained were ranging between 160 W/m2 and 278 W/m2.

    Using the following assumptions and Eq (38), the economic analysis for the site was carried out:

    ●  All amounts are in US$.

    ●  It is assumed that the turbine lifetime (T) is 20 years.

    ●  The interest rate (r) is 12%.

    ●   The inflation rate (i) is 3%.

    ●  Operational, maintenance and repair costs (Comr) are considered to be 25% of the annual cost of the turbine (machine price/lifetime).

    ●  Scrap value (S) is taken as 10% of the cost of turbine and civil work.

    ●  Investment (I) includes the cost of turbine plus its transportation cost to Fiji and cost of the civil work with costs associated with grid integration.

    The present value of cost (PVC) is expressed by the following equation:

    PVC=I+Comr[1+iri][1(1+i1+r)T]S(1+i1+r)T (38)

    The PVC using Eq (38) is US$675,647. In obtaining the PVC, the Investment cost calculated was US$615,000 for installing the Vergnet 275 kW wind turbine in Fiji (including US$35,000 transport cost to Fiji), Comr was US$7,687.50 and Scrap Value calculated was US$58,000.

    The average energy production is 489.31 MWh for a single turbine from the 5 turbines. The period for the maintenance has been neglected. The price of electricity in Fiji is FJ$0.331/kWh (charge/unit) for the domestic use and FJ$0.418/kWh (charge/unit) for the industrial use which are US$0.16/kWh and US$0.20/kWh respectively. The production of each unit of electricity using the wind turbine will cost US$0.07/kWh. To calculate the production cost the average energy produced multiplied by the assumed lifetime of the wind turbine divided from the PVC:

    Production Cost=US675,647/(20years x 489.31MWh)=US0.07/kWh

    The total cost recovered in one year will be between US$77,284.96 and US$96,606.20 which is by using the stated cost of electricity by EFL. In 20 years, between US$870,052.30 and US$1,256,477 profit will be made after recovering the PVC of US$675,647. It will take between 6.99 and 8.74 years to recover the full PVC. To reduce the cost of electricity and making the environment pollution-free, the use of wind energy in combination with other environmental friendly sources of energy like solar and hydro should be incorporated.

    The wind turbines are usually connected to the grid using the transformer and the substation. For safety measures, circuit breakers are utilized. To avoid huge losses by low voltage lines, the transformers are usually placed near the turbines. There are different types of losses occurring in the wind energy generation which are no load loss, substation loss which are from lighting and heating, for the transformer loss which includes copper losses and also the transmission cable loss. The total loss for a grid-connected wind turbine, as stated by Szafron [36], is 1–2%. The computed price, accounting for the losses, ranges between US$0.0706/kWh and US$0.071/kWh. In the generation the standards which are normally utilized by Energy Fiji limited is the frequency of 50 Hz and the substations are 11 kV while the transformers for step down for industrial use is 11 kV/415 V three phase while for domestic use is 240 V.

    A detailed wind resource assessment is carried out from 18 months of measurements for a site in the islands of Kadavu, Fiji Islands. The daily, monthly and seasonal average wind speeds were obtained. The average turbulence intensity for a typical day was 28.87% at a height of 34 m AGL. The Weibull parameters were calculated using ten different methods and a comparison of the performance of these methods was done to find the best method. It was found that the MO was the best method for finding the Weibull parameters for the entire duration of measurements. For the seasonal data analysis the best Weibull method for the summer season was MML, while it was the MQ method for the winter season. From the analysis, it can said that different methods are suitable for different sites as well as seasons. The overall average wind speed from the measurements was 3.63 m/s. However, the seasonal wind speed showed a larger difference. The effects of temperature variation was also shown on the diurnal of wind shear coefficients. The overall WPD using the Moments Method was found to be 45.88 W/m2. An economic analysis was also carried out with five Vergnet 275 kW wind turbines and the AEP and payback periods were estimated. The five sites for the turbines were based on high wind speed and wind power density. The average AEP for the five turbines was 483.31 MWh. Finally the payback period for installing the wind turbines were estimated to be between 6.99 and 8.74 years.

    Funds for carrying out this were provided by Korea International Cooperation Agency (KOICA) under its East Asia Climate Partnership. The project number was 2009-00042.

    The authors declare that there is no conflict of interest in publishing this paper.


    [1] United Nations Department of Economic and Social Affairs (2009) A global green new deal for climate, energy, and development. Technical note. Available from: http://sustainabledevelopment.un.org/content/documents/cc_global_green_new_deal.pdf.
    [2] Shahbaz M, Loganathan N, Zeshan M, et al. (2015) Does renewable energy consumption add in economic growth? An application of auto-regressive distributed lag model in Pakistan. Renewable Sustainable Energy Rev 44: 576-585.
    [3] Alrikabi NKMA (2014) Renewable energy types. J Clean Energy Technol 2: 61-64.
    [4] Shahzad U (2012) The need For renewable energy sources. Inf Technol Electr Eng J 4: 16-19.
    [5] Panwar NL, Kaushik SC, Kothari S (2011) Role of renewable energy sources in environmental protection: A review. Renewable Sustainable Energy Rev 15: 1513-1524. doi: 10.1016/j.rser.2010.11.037
    [6] Razykov TM, Ferekides CS, Morel D, et al. (2011) Solar photovoltaic electricity: Current status and future prospects. Sol Energy 85: 1580-1608. doi: 10.1016/j.solener.2010.12.002
    [7] Sholler D (2011) Wind power: Harnessing history to meet the energy demand. Penn McNair Res J 3.
    [8] Shu ZR, Li QS, Chan PW (2015) Statistical analysis of wind characteristics and wind energy potential in Hong Kong. Energy Convers Manage 101: 644-657. doi: 10.1016/j.enconman.2015.05.070
    [9] Dabbaghiyan A, Fazelpour F, Abnavi MD, et al. (2015) Evaluation of wind energy potential in province of Bushehr, Iran. Renewable Sustainable Energy Rev 55: 455-466.
    [10] Fazelpour F, Markarian E, Soltani N (2017) Wind energy potential and economic assessment of four locations in Sistan and Balouchestan province in Iran. Renewable Energy 109: 646-667. doi: 10.1016/j.renene.2017.03.072
    [11] Soulouknga MH, Doka SY, Revanna N, et al. (2018) Analysis of wind speed data and wind energy potential in Faya-Largeau, Chad, using Weibull distribution. Renewable Energy 121: 1-8. doi: 10.1016/j.renene.2018.01.002
    [12] Bassyouni M, Gutub SA, Javaid U, et al. (2015) Assessment and analysis of wind power resource using weibull parameters. Energy Explor Exploit 33: 105-122. doi: 10.1260/0144-5987.33.1.105
    [13] Mohammadi K, Alavi O, Mostafaeipour A, et al. (2016) Assessing different parameters estimation methods of Weibull distribution to compute wind power density. Energy Convers Manage 108: 322-335. doi: 10.1016/j.enconman.2015.11.015
    [14] Werapun W, Tirawanichakul Y, Waewsak J (2015) Comparative study of five methods to estimate Weibull parameters for wind speed on Phangan Island, Thailand. Energy Procedia 79: 976-981. doi: 10.1016/j.egypro.2015.11.596
    [15] Azad AK, Rasul M, Alam M, et al. (2014) Analysis of wind energy conversion system using Weibull distribution. Procedia Eng 90: 725-732. doi: 10.1016/j.proeng.2014.11.803
    [16] Shoaib M, Siddiqui I, Rehman S, et al. (2019) Assessment of wind energy potential using wind energy conversion system. J Cleaner Prod 216: 346-360. doi: 10.1016/j.jclepro.2019.01.128
    [17] Kombe EY, Muguthu J (2019) Wind energy potential assessment of Great Cumbrae Island using weibull distribution function. J Energy Res Rev: 1-8.
    [18] Fiji Bureau of Statistics (2017) 2017 Population and Housing Census. Available from: http://www.statsfiji.gov.fj/index.php/statistics/population-censuses-and-surveys.
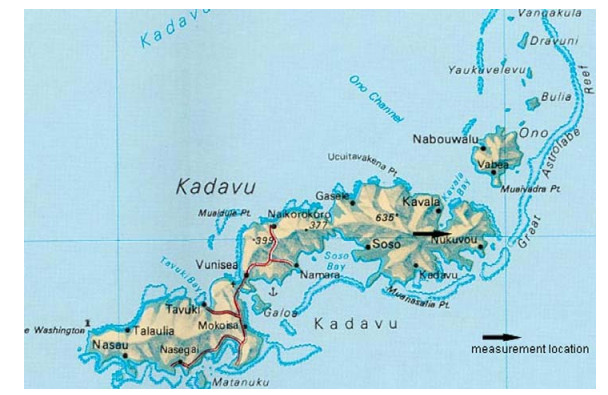
    [19] The Editors of Encyclopædia Britannica. Kadavu Island. Available from: https://www.britannica.com/place/Kadavu-Island.
    [20] Kadavu Map. Available from: http://nztourmaps.com/fiji_map_kadavu.htm.
    [21] Aukitino T, Khan M, Ahmed MR (2017) Wind energy resource assessment for Kiribati with a comparison of different methods of determining Weibull parameters. Energy Convers Manage 151: 641-660. doi: 10.1016/j.enconman.2017.09.027
    [22] Zhang MH (2015) Wind Resource Assesement and Micrositting : Science and Engineering. Singapore: John Wiley & Sons Singapore Pte. Ltd.
    [23] Fırtın E, Güler Ö, Akdağ SA (2011) Investigation of wind shear coefficients and their effect on electrical energy generation. Appl Energy 88: 4097-4105. doi: 10.1016/j.apenergy.2011.05.025
    [24] Gualtieri G, Secci S (2011) Wind shear coefficients, roughness length and energy yield over coastal locations in Southern Italy. Renewable Energy 36: 1081-1094. doi: 10.1016/j.renene.2010.09.001
    [25] Rehman S, Al-Abbadi NM (2008) Wind shear coefficient, turbulence intensity and wind power potential assessment for Dhulom, Saudi Arabia. Renewable Energy 33: 2653-2660. doi: 10.1016/j.renene.2008.02.012
    [26] Singh K, Bule L, Khan M, et al. (2019) Wind energy resource assessment for Vanuatu with accurate estimation of Weibull parameters. Energy Explor Exploit 37: 1804-1832. doi: 10.1177/0144598719866897
    [27] Justus CG, Hargraves WR, Mikhail A, et al. (1978) Methods for estimating wind speed distributions. J Appl Meteorolgy 17: 350-353. doi: 10.1175/1520-0450(1978)017<0350:MFEWSF>2.0.CO;2
    [28] Chaurasiya PK, Ahmed S, Warudkar V (2017) Study of different parameters estimation methods of Weibull distribution to determine wind power density using ground based Doppler SODAR instrument. Alexandria Eng J 55: 2299-2311.
    [29] Chaurasiya PK, Ahmed S, Warudkar V (2018) Comparative analysis of Weibull parameters for wind data measured from met-mast and remote sensing techniques. Renewable Energy 115: 1153-1165. doi: 10.1016/j.renene.2017.08.014
    [30] Rocha PAC, de Sousa RC, de Andrade CF, et al. (2012) Comparison of seven numerical methods for determining Weibull parameters for wind energy generation in the northeast region of Brazil. Appl Energy 89: 395-400. doi: 10.1016/j.apenergy.2011.08.003
    [31] Lysen E (1982) Introduction to wind energy: basic and advanced Introduction to wind energy with emphasis on water pumping windmills. Amersfoort: Consultancy services wind energy developing countries (CWD).
    [32] Ahmad S, Hussin W, Bawadi M, et al. (2003) Analysis of wind speed variations and estimation of Weibull parameters for wind power generation in Malaysia. 2nd Dubrovnik Conference on Sustainable Development of Energy, Water and Environment Systems, Dubrovnik, Croatia, 15-20 June, 61.
    [33] Katinas V, Marciukaitis M, Gecevicius G, et al. (2017) Statistical analysis of wind characteristics based on Weibull methods for estimation of power generation in Lithuania. Renewable Energy 113: 190-201. doi: 10.1016/j.renene.2017.05.071
    [34] Usta I, Arik I, Yenilmez I, et al. (2018) A new estimation approach based on moments for estimating Weibull parameters in wind power applications. Energy Convers Manage 164: 570-578. doi: 10.1016/j.enconman.2018.03.033
    [35] Arslan T, Bulut YM, Yavuz AA (2014) Comparative study of numerical methods for determining Weibull parameters for wind energy potential. Renewable Sustainable Energy Rev 40: 820-825. doi: 10.1016/j.rser.2014.08.009
    [36] Szafron C (2011) Wind energy conversion systems grid connection. Master's Thesis, Wroclaw University of Technology.
  • This article has been cited by:

    1. Ombeni John Mdee, Performance evaluation of Weibull analytical methods using several empirical methods for predicting wind speed distribution, 2020, 1556-7036, 1, 10.1080/15567036.2020.1832161
    2. Varadharajan Sankaralingam Sriraja Balaguru, Nesamony Jothi Swaroopan, Kannadasan Raju, Mohammed H. Alsharif, Mun-Kyeom Kim, Techno-Economic Investigation of Wind Energy Potential in Selected Sites with Uncertainty Factors, 2021, 13, 2071-1050, 2182, 10.3390/su13042182
    3. Ombeni JOHN, Evaluation of Rainfall Extreme Characteristics in Dodoma Urban, A Central Part of Tanzania, 2022, 9, 2148-9173, 166, 10.30897/ijegeo.1000458
    4. Krishneel A. Singh, M. G. M. Khan, Mohammed Rafiuddin Ahmed, Wind Energy Resource Assessment for Cook Islands With Accurate Estimation of Weibull Parameters Using Frequentist and Bayesian Methods, 2022, 10, 2169-3536, 25935, 10.1109/ACCESS.2022.3156933
    5. Mohammad Golam Mostafa Khan, Mohammed Rafiuddin Ahmed, Bayesian method for estimating Weibull parameters for wind resource assessment in a tropical region: a comparison between two-parameter and three-parameter Weibull distributions, 2023, 8, 2366-7451, 1277, 10.5194/wes-8-1277-2023
    6. Jean-Michel Soumien Kouadio, Franck Didier Néné, Moussa Grafouté, Alexandre N'guessan, Siaman Paule Carine Yeboua, N'goran Yao, Harnessing the wind energy potential in Yamoussoukro, the Economic Capital of Côte d'Ivoire, 2024, 10, 24058440, e30170, 10.1016/j.heliyon.2024.e30170
    7. Saiyad S. Kutty, M.G.M. Khan, M. Rafiuddin Ahmed, Analysis of wind characteristics and wind energy resource assessment for Tonga using eleven methods of estimating Weibull parameters, 2024, 10, 24058440, e30047, 10.1016/j.heliyon.2024.e30047
  • Reader Comments
  • © 2019 the Author(s), licensee AIMS Press. This is an open access article distributed under the terms of the Creative Commons Attribution License (http://creativecommons.org/licenses/by/4.0)
通讯作者: 陈斌, bchen63@163.com
  • 1. 

    沈阳化工大学材料科学与工程学院 沈阳 110142

  1. 本站搜索
  2. 百度学术搜索
  3. 万方数据库搜索
  4. CNKI搜索

Metrics

Article views(5053) PDF downloads(699) Cited by(7)

/

DownLoad:  Full-Size Img  PowerPoint
Return
Return

Catalog