Review Topical Sections

Energy storage for electrical systems in the USA

  • Energy storage is becoming increasingly important as renewable generation sources such as Wind Turbine and Photo Voltaic Solar are added to the mix in electrical power generation and distribution systems. The paper discusses the basic drivers for energy storage and provides brief descriptions of the various energy storage technologies available. The information summarizes current technical tradeoffs with different storage approaches and identifies issues surrounding deployment of large scale energy storage systems.

    Citation: Eugene Freeman, Davide Occello, Frank Barnes. Energy storage for electrical systems in the USA[J]. AIMS Energy, 2016, 4(6): 856-875. doi: 10.3934/energy.2016.6.856

    Related Papers:

    [1] Tilahun Nigussie, Wondwossen Bogale, Feyisa Bekele, Edessa Dribssa . Feasibility study for power generation using off- grid energy system from micro hydro-PV-diesel generator-battery for rural area of Ethiopia: The case of Melkey Hera village, Western Ethiopia. AIMS Energy, 2017, 5(4): 667-690. doi: 10.3934/energy.2017.4.667
    [2] Sulabh Sachan . Integration of electric vehicles with optimum sized storage for grid connected photo-voltaic system. AIMS Energy, 2017, 5(6): 997-1012. doi: 10.3934/energy.2017.6.997
    [3] Surender Reddy Salkuti . Sustainable energy technologies for emerging renewable energy and electric vehicles. AIMS Energy, 2024, 12(6): 1264-1270. doi: 10.3934/energy.2024057
    [4] Khuthadzo Kgopana, Olawale Popoola . Improved utilization of hybrid energy for low-income houses based on energy consumption pattern. AIMS Energy, 2023, 11(1): 79-109. doi: 10.3934/energy.2023005
    [5] K. M. S. Y. Konara, M. L. Kolhe, Arvind Sharma . Power dispatching techniques as a finite state machine for a standalone photovoltaic system with a hybrid energy storage. AIMS Energy, 2020, 8(2): 214-230. doi: 10.3934/energy.2020.2.214
    [6] Syed Sabir Hussain Rizvi, Krishna Teerth Chaturvedi, Mohan Lal Kolhe . A review on peak shaving techniques for smart grids. AIMS Energy, 2023, 11(4): 723-752. doi: 10.3934/energy.2023036
    [7] Abdul Matin Ibrahimi, Mohammad Masih Sediqi, Harun Or Rashid Howlader, Mir Sayed Shah Danish, Shantanu Chakraborty, Tomonobu Senjyu . Generation expansion planning considering renewable energy integration and optimal unit commitment: A case study of Afghanistan. AIMS Energy, 2019, 7(4): 441-464. doi: 10.3934/energy.2019.4.441
    [8] Hassan Shirzeh, Fazel Naghdy, Philip Ciufo, Montserrat Ros . Stochastic energy balancing in substation energy management. AIMS Energy, 2015, 3(4): 810-837. doi: 10.3934/energy.2015.4.810
    [9] Solomon A. A., Michel Child, Upeksha Caldera, Christian Breyer . Exploiting wind-solar resource complementarity to reduce energy storage need. AIMS Energy, 2020, 8(5): 749-770. doi: 10.3934/energy.2020.5.749
    [10] Dalong Guo, Chi Zhou . Potential performance analysis and future trend prediction of electric vehicle with V2G/V2H/V2B capability. AIMS Energy, 2016, 4(2): 331-346. doi: 10.3934/energy.2016.2.331
  • Energy storage is becoming increasingly important as renewable generation sources such as Wind Turbine and Photo Voltaic Solar are added to the mix in electrical power generation and distribution systems. The paper discusses the basic drivers for energy storage and provides brief descriptions of the various energy storage technologies available. The information summarizes current technical tradeoffs with different storage approaches and identifies issues surrounding deployment of large scale energy storage systems.


    1. Introduction

    This article outlines some of the applications and issues for energy storage systems in the electric utility network. The electric utility industry is under a lot of pressure to reduce emissions and control costs while maintaining reliable service to an ever growing customer base. Energy storage systems have the potential to resolve some of the problems arising by adapting intermittent renewable generation resources to the irregular loads on the grid. An alternate technically feasible approach to solving part of the problems of the intermittent nature of wind and solar energy is to use geographically diverse sources interconnected to a nationwide transmission network. For example the sun rises in the east before it rises in the west and different locations are likely to have cloud cover at different times so that probability of some solar power being available is increased with geographical diversity. Typical solar radiation at a given location is equivalent to from 4 to 6 at 1 kW/m2 per day [1] and another source of energy is needed in the evening and on cloudy days. Similarly the wind energy tends to peak in the early evening and in the spring and fall. Peak loads tend to occur in the afternoon or early evening and in the summer or winter depending on location.

    However, the principal issues with delivery of electric power to the grid from diversified renewable sources are the capital costs and the difficulty of building the transmission networks required to connect the power to the loads. The capital investment required to completely integrate wind and solar assets through a nationwide distribution network may be beyond the financial capacities of the utility industry. The political and territorial imperatives of the various regulatory agencies that control the industry currently present nearly impossible project authorization and implementation barriers to a nationwide distribution network. Transmission line permitting currently takes up to10 years or more to achieve in just a small area of the country like Wyoming. Storage systems may simply take less time and money to implement.

    This paper is designed to serve as an introduction to energy storage and some of the problems in integrating wind and solar energy to the electric power grid. There are a verity of extensive reviews for energy storage including references [2,3,4,5].

    Nearly all electrical power is “manufactured” from the energy stored in other forms. Much of it comes from the combustion of fossil fuels. Table I [6] characterizes the world’s consumption and supply of these fuels. Coal and natural gas are the dominant fuels used in generating electricity.

    Table I. Worldwide Fossil Fuel Reserves [6].
    Natural GasCoalOil
    Consumpt.ReservesYrs SupplyConsumpt.ReservesYrs SupplyConsumpt.ReservesYrs Supply
    201320142012201120132015
    T cuft/yrT cuftM tons / yrT tonsB brls / dayB brls
    North America32.1422.113.195626728023.4218.825.6
    South America5.5277.650.351163137.1329.4127.4
    Europe18.5135.97.31027918814.211.72.3
    Eurasia21.92177.899.24652515414.7118.969.5
    Middle-East15.12812.8186.5231558.1808.1273.9
    Africa4.6606.0132.5221351593.6126.596.3
    Asia23.6540.422.95713185630.146.04.2
    Total121.46972.557.5844998011691.31659.549.8
    Note: Reserves and consumption rates are as reported by EIA for the year indicated and represent the most recent data available. Years supply is the ratio of reserves and consumption rates.
     | Show Table
    DownLoad: CSV

    While there is a 116 year supply in the world reserves, coal has many undesirable characteristics from an environmental perspective as a fuel for power generation. About 32% of the US’s electric power is currently derived from coal fired turbines, but many coal fired plants in the U.S are being retired due to their age and the costs associated with bringing them into compliance with EPA requirements for emissions. They are being replaced with N.G. (natural gas) fired turbine systems, wind turbines and P.V. (photovoltaic) solar arrays.

    There was a 57.5 year supply of N.G. world-wide at the beginning of 2015, based on 2013 consumption rates, with two thirds of the reserve located in Russia and the Middle East. North America had 13.1 years of proven reserves and is still developing more through investment in advanced drilling and recovery technologies. As more N.G. turbines are added to the U.S. generation base to replace the retiring fleet of coal and nuclear plants, consumption rates for N.G. will rise significantly. Future electricity costs are going to become increasingly dependent on efficient use of our finite N.G. fuel reserves. CAES (Compressed Air Energy Storage) systems can reduce the fuel consumption of NG turbine systems by as much as one half for the same electrical output because the high pressure intake air for the turbine comes from a storage reservoir that has been previously “charged” using surplus electricity from other sources [7]. In the future our N.G. reserves could become as “strategically” valuable as oil has been in prior decades. Conservation of these geographically limited resources will become an important part of the U.S. energy roadmap.

    Table II [6] shows the nature of the electric power generated and consumed in the world. Twenty two percent of it comes from renewable sources like hydro-electric, solar and wind turbine generators. Electric power is widely distributed to customers via large distribution networks but, once generated, it is difficult to store in large quantities. Low energy storage devices like batteries, supercapacitors, flywheels and superconducting inductors may be used to help regulate voltage, frequency and phase angle characteristics of the power. Larger storage systems like CAES (Compressed Air Energy Storage) and PHES (Pumped Hydro Energy Storage) are used to provide start-up power for plants that have gone off-line or emergency back-up power when unplanned interruptions occur. They are also used to balance uneven loads with conventional generation capacity, thus helping to reduce capital investments and operating costs.

    Table II. World Wide Electric Power Generation & Consumption for 2012 [6].
    AreaConsumptionGenerationCapacityRenewable
    Generation%
    B kwhrsB kwhrsM kwB kwhrs
    North America4592.14943.71260.7949.619.2%
    South America999.11177.0279.9775.765.9%
    Europe3313.33581.71075.31040.129.0%
    Eurasia1305.41479.5364.4247.016.7%
    Middle-East792.4907.0234.822.72.5%
    Africa600.0681.2142.7119.617.6%
    Asia8108.18761.62191.81560.217.8%
    Total19710.421531.75549.64714.821.9%
    Renewable generation capacity includes wind, solar, geothermal, tidal, hydroelectric and solid waste disposal generators. Data is the most recent available.
     | Show Table
    DownLoad: CSV

    Figure 1 shows the trends for different types of electric power generation in the United States. Natural gas (N.G.) turbines, Photo Voltaic (P.V.) Solar and Wind turbines are gradually displacing coal and nuclear sources in the generation mix. At penetration levels above 15-30% in isolated grids, non-dispatch-able generation sources like P.V. solar or wind turbines will ultimately require electrical energy storage systems, higher generation flexibility, the introduction of demand response and/or higher levels of curtailment (which is ultimately unwanted) [8]. These modifications would be needed not only to buffer the irregularity of Wind and Solar, but to match their outputs to the variable load conditions on the grid (see Figure 2). The percentage of power when storage will be required will depend on the details of the grid to which they are connected and the generating sources which are feeding it. Smaller localized girds such as those on islands are likely to need storage earlier than large interconnected grids. Even though there are cases of very high wind penetration without storage or excessive curtailment (e.g. Denmark with 33% Wind energy penetration in 2013 [9]), the real amount of energy that was consumed was limited. In Denmark’s case only about 50% was consumed locally, while the rest was consumed in neighboring nations [10]. Additionally the availability of hydroelectric power from Norway that is dispatch-able helps to match the available power to the loads. Dispatch-able storage capacity will be needed to offset the loss of the spinning reserves traditionally available from the coal and nuclear fueled generation assets that are being retired.

    Figure 1. U.S. electrical power production forecast [11].
    Figure 2. Typical load curve fro part of the U.S. “Grid” [11].

    Figure 2 illustrates the highly variable nature of the load on part of the U.S. electric grid. Hourly demand (vertical axis) is organized in descending order (in M Watts) from the highest to the lowest over the course of a year (horizontal axis). For this part of the Grid, peak demand occurs in the afternoon hours of the summer and the night-time hours of the winter. The “Base Load” region requires 1500MW per hour continuously over an entire year. The “Intermediate Load” region requires power between 1500 MW and 4000 MW per hour, depending on the time of day and the season of the year. The “Peak Load” part requires 4000 MW to 6000 MW per hour, but only for a few hours each day for parts of the year. Utility operators have to have enough generation capacity to meet peak demand whenever it occurs, so a lot of under-utilized generation capacity exists in the network. Energy storage technologies like PHES or CAES allow operators to “time shift” some of this excess capacity to higher demand periods, thus reducing overall capital investment, operating costs and pollution output of the system. Demand response is another way to shift the loads and can be used in place of energy storage in cases where the portions of the load are flexible and can be shifted in time by amounts large enough to compensate for the lack of power for time mismatches between the load and the electrical energy generation system. A demand response system can be implemented by preprograming the loads so that they are staggered or time shifted so as to reduce the peak load or to match the projected input from the renewable energy sources. A better match is obtained by overlaying a communications system on the power distribution system. This approach can open up the grid to a large number of inputs from smart meters which can provide detailed information on the loads or distributed power sources such as solar cells and their location. Optimizing controls and minimizing the capital and maintenance costs in a distribution system is a problem of current interest as is the problem of securing the system against false or malleolus data. As more intermittent sources replace conventional spinning reserves, more storage capacity or loads which can be time shifted will be required to match capacity with demand on a real time basis.


    2. Renewable Energy Sources Drive Energy Storage Requirements

    Renewable energy sources are displacing traditional fossil fuel sources in many parts of the world due to their low operating costs and emissions. The following describes the prominent renewable power generation technologies in use:

    · Hydro-electric power plants (2.7%) **1 (1 ** (%) indicates contribution to U.S. generation base in 2015 [13].) use the gravitational energy stored in water behind their dams to generate electricity. C.F. ***2 (2 *** Capacity Factor (C.F.)=actual power delivered for 1 year / rated power possible on a continuous basis. Systems with high C.F.s (Coal, Nuclear, Hydroelectric) are used for Base power generation. Sources like wind and solar have low C.F.s and are difficult to dispatch due to their intermittent nature. Natural gas systems are easy to dispatch so their C.F.s vary depending on how they are used -some for extended periods to cover long periods of intermediate demand, others only for peak loads because of their high fuel consumption.) ranges from 28% to 45% depending on seasonal variation in water flow [12].

    · P.V. Solar Arrays (0.62%) **convert the energy of photons emitted by the sun into electric energy, creating an electric current. The average C.F. ***for P.V. Solar arrays in the U.S during 2015 was 28.6% [12]. Peak power is generated from these systems when the sun is directly overhead and the atmosphere is free of particulates moisture, and clouds. Output is also highly dependent on latitude, the orientation of the arrays and the effects of shadows from nearby obstructions.

    · Wind Turbines (2.01%) **convert the kinetic energy in the wind into rotational energy in the blades of the turbines. The average C.F. ***for wind turbines in the U.S. in 2015 was 32.5% [12]. Output is highly dependent on atmospheric wind conditions and geographic location. Wind velocities that are too low reduce output. Wind velocities that are too high cause the turbines to be “caged” so they won’t be damaged.

    · Biomasses (5.35%)**, which refer to the use of the chemical energy contained in biological matter (Wood, Biofuels…etc). This energy is normally released by burning the biomass like traditional fossil fuels and exploited in thermal engines. The C.F. for Biomasses in the U.S was 52.9% in 2015 [12]. The output is very constant and does not provide problems to the grid, as it can be deployed like traditional fossil energy sources.

    · Tidal Flow Systems harness the gravitational energy in the tidal flows that occur at the boundaries of the ocean with the land. These offer promise, but their use is limited by geographical and environmental constraints.

    As coal and nuclear-fired plants are replaced by wind and P.V. solar sources in the U.S. electric grid, the ability of operators to dispatch power on demand will become more difficult. Figures 3 and 4 [14] show how much variability there is in solar array output from day to day. Figure 5 [15] shows how, over a 7 day period, the output of a typical wind farm is poorly correlated with the demand curve. Wind and solar sources are neither continuous nor dispatch-able and can create serious instabilities in the Grid, especially during peak loading conditions. On “bad” days, “emergency” back-up power from dispatch-able sources must be added to the Grid, often at considerable expense.

    Figure 3. San Luis Valley Solar Data (09/12/2010) Bad Day [14].
    Figure 4. San Luis Valley Solar Data (09/11/2010) Good Day [14].
    Figure 5. Bonneville Power Administration Data [15].

    On “bad” days (when the sun and wind are not optimal) and at night (for solar arrays), base power generation resources (fossil fuel, nuclear and hydroelectric systems) must cover the 100% of the load. The system must have sufficient capacity to meet peak load requirements at all times. On “good” days, wind and solar power outputs are nearly ideal because they are fuel and pollution free, but that power output is not needed because the load is already covered by conventional sources. Without some large scale storage asset in the system, full utilization of this “free” power requires that other sources be “throttled” back or shut down. Fossil fuel plants are designed to deliver optimum performance at peak power output settings. Ramping can significantly increase the operating and maintenance costs and decrease the lifetime of the equipment, especially in coal fired systems. Balancing these costs with all of the other constraints for power quality and environmental impact on a continuous basis is a complex management problem that ultimately affects utility rates.

    A graphical representation of this dilemma is shown Figure 6a, where solar & wind outputs are compared to demand levels for a winter day in California. As solar sources ramp up, conventional sources must be ramped down to meet regulatory requirements. In this case, there is as much as 13, 000 MW of excess total capacity in the system during the day. As the sun goes down, conventional resources have to be ramped up to cover both the peak evening load and the loss of the solar input. Operators have two choices during the day—shut off traditional base power assets or refuse the solar and wind energy. Either way, a big part of the capital investment in generation assets (both traditional and renewable) becomes “stranded” (i.e.no income to pay back the debt incurred to build the asset). Regulatory mandates in California require operators to utilize renewables first, so the other assets in place to cover the load when solar is not producing do not create enough daily revenue to pay for themselves. The same situation occurs with wind turbine power. Higher utility rates are required during the peak load periods if the utility companies are to service their debt and remain profitable.

    Figure 6a. Supply/Demand Characteristics for a Day in California (data from [16]).

    This situation becomes even more dramatic in the autumn months as shown in figure 6b, when cooling demand is lower at midday (reduced peak power requirements), and when the solar power is more available. In effect, large numbers of capital assets are either generating un-needed power or they are idle. High capacity storage systems like PHES and CAES can move un-needed blocks of energy to peak load periods, thereby reducing the overall generation cost. Energy storage can also smooth out the irregularities in solar and wind output so the disruptions become virtually invisible to the grid. The basic financial tradeoff is where to place the upfront capital investment in order to lower the overall operating cost of the system, the total capital investment required to support the demand and meet the environmental pollution restrictions.

    Figure 6b. Daily Supply/Demand graphs for a Day in California [17].

    There are several other issues that affect the decision to deploy high capacity storage systems in the power network:

    · Site geology limitations

    · Facility siting (Proximity to transmission trunks, and natural gas supplies)

    · Permitting barriers (multiple state, local and federal agencies control site development)

    · Cycle times to get all of the approvals needed (10 year cycle times are typical)

    · Politics


    3. Electrical Energy Storage Facts

    Electrical energy storage devices do not generate electrical power by themselves. They must be recharged by an external source each time their energy is depleted. Losses occur in these charge/discharge cycles. These losses are reflected in “Round-Trip Efficiency” (RTE) metrics (Energy out/Energy in). There are two kinds of losses -conversion (heat, friction) and storage (leakage).

    · In supercapacitor and flywheel systems, conversion losses are typically small, so they can be used for high power applications, but their internal storage losses can be substantial. In supercapacitors, internal charge levels are subject to leakage or recombination effects that are a function of time and temperature. In flywheels, the internal air friction leads to higher storage losses in the long run. RTE’s over 90% are reported for short term applications [18,19].

    · In battery systems both conversion and storage losses play a role, partly due to Ohmic and Activation losses during charging and discharging and partly due to leakage or recombination effects. All these effects result in RTE’s of 70% to 85% [18,19].

    · PHES systems can have significant conversion and storage losses based on piping design, reservoir size, evaporation, and leakage rates. RTE’s of 70% to 80% are reported [19].

    · CAES systems use NG fuel to generate the output power, so RTEs are more difficult to compute. Such plants generate 1.2 to 1.8 times more electricity than they use to compress the air, so RTE appears to be > 1.0. However, when the natural gas fuel is factored into the computation of efficiency, RTEs of 42% to 55% are indicated [19].

    A. The capacity of energy storage systems is an important factor when considering its application. It depends primarily on three factors—how much output power must/can be delivered per unit time, how long a period of time that power must be delivered, and the conversion and storage losses during that period of time. CAES and PHES are a special case, since their size and output capacity depend primarily on the site geology and physical dimensions of the storage reservoirs.

    B. Response time to a change in load is an important consideration. Supercapacitor, superconducting inductor and battery systems respond in milliseconds and are limited only by the impedance internal to the device and the wiring connecting it to the load. PHES systems have response times comparable to hydroelectric generation facilities (~5 minutes). CAES systems are comparable to NG fired turbine generators (3-5 minutes if the turbines are hot, 10-15 minutes if they are cold) [20].

    C. Cost is a big determinant in the design of a storage system. Operating costs of storage systems are typically lower than conventional generation assets, but the up-front capital construction costs are large and usually additive to the capitalization in the network [21].


    4. Descriptions of Electrical Energy Storage Systems

    Figure 7 shows the characteristics of a variety of energy storage systems and the areas where they are used in the electric utility industry [22].

    Figure 7. Capacity vs. Power Ratings for Various Storage Systems [22].

    The choice of energy storage systems vs the cost of generation by sources such as natural gas or shifting in load with a demand response is an important issue in deciding whether or not to install an energy storage system. The costs of energy storage systems include the capital costs for its purchase, installation, and maintenance which must be estimated over the projected lifetimes. See Table III. It is to be noted that pumped hydroelectric systems have relatively high capacities and capital costs, low operations and maintenance costs and long lifetimes. Batteries have relatively small capacities and short lifetimes.

    Table III. Costs for Energy Storage Systems.
    Type of StorageStorage Capacity (MWh)Energy Capital Cost ($/kWh)Power Capital Cost ($/kW)Operating CostComments
    Batteries - Lead Acid0.001 - 40 [23]50 - 400[23]~400-850[24]300 - 600[23]~1650-3900[24]50 $/kW/yr[23] 15 $/kW[18]
    Batteries - NiCd6.75[23]400-240023~700-1000[24]500-1500~2800-5000[24]20 $/kW/yr[23] 15 $/kW[18]
    Batteries - Lithium0.004 - 10[23]600-3800[23]~550-650[24]900-4000[23]~2500-3300[24]10 $/kW[18]
    Batteries - Flow2 - 60[23]150 -1000[23]~300-550[24]600-1500[23]~1500-2000[24]70 $/kW/yr[23] 28 $/kW[18]
    Capacitors-500-1000[23]200-400[23]13 $/kW/yr[23]
    Super Capacitors0.0005[23]300-2000[23]~850-1000[24]100-450[23]~250-300[24]6 $/kW/yr[23]
    Inductors----
    SMES0.0008 - 0.015[23]1000-72000[23]~6400-8300[24]200-500[23]~300-700[24]18.5 $/kW/yr[23] 10 $/kW[18]
    Flywheels0.005 - 5[23]1000-14000[23]~2300-30000[24]250-350[23]~700-1800[24]20 $/kW/yr[23] 18 $/kW[18]
    PHES180 -8000[23]10-100[23]~100-200[24]2000-4300[23]~1200-2000[24]3 $/kW/yr[23] 3 $/kW[18]
    CAES - Geologic580 - 2860[23]2-120[23]~50-100[24]400-1000[23]~1000-1200[24]19-25 $/kW/yr[23] 6 $/kW[18]
    CAES - Above Ground0.002 - 0.01[23]200-250[23]~200-300[24]500-1550[23]~1500-1800[24]-
     | Show Table
    DownLoad: CSV

    4.1. Battery Energy Storage (BES)

    Batteries are the oldest and most pervasive of the energy storage technologies in use. Figure 8 [25] shows the range of battery technologies from the common non-rechargeable alkaline batteries used in portable electronics, to stationary high power Lead-Acid or Ni-Cd battery systems that are used for Grid scale energy storage purposes [25].

    Figure 8. Energy vs Power Density for Various Battery Technologies [25].

    Batteries consist of one or more electrochemical cells, containing an electrolyte solution and 2 electrodes. During the charging cycle, a DC (Direct Current) electrical source is connected to the electrodes, causing the electrolyte solution to change its chemical state. When the energy is needed during the discharge cycle, the chemical reaction is reversed, thus reducing the energy content of the electrolyte solution, releasing the “stored” electrical energy to the load.

    Batteries have rapid response times and high energy densities, but they have limited life times (shelf-life and # of charge/discharge cycles). They are also subject to considerable auto-discharge between cycles. Weight, size and cost for battery systems are directly proportional to energy storagecapacity, so their uses on the Grid are limited to low to medium power back-up and load smoothing applications [19,20].

    The total BES systems cost depends on the application, for which it is used. For Load Shifting purposes, which require high capacities, BES systems outperform Supercapacitors and Superconducting Inductors in terms of cost, but are 2 to 5 times more expensive than Large scale systems such as CAES and PHS [4,18].


    4.2. Flow Batteries

    Flow Batteries are a hybrid between fuel cells and batteries. The electron exchange that normally happens inside the electrolyte of a normal battery occurs through an isolating membrane in a flow battery and involves the interaction of two separate electrolyte solutions, as in a fuel cell. Figure 9 shows a schematic of a flow battery [26].

    Figure 9. Schematic Representation of a Flow Battery [26].

    During the storage cycle, a DC voltage differential between the electrodes causes a chemical reduction reaction in one electrolyte and an oxidation reaction in the other. The membrane between the half cells prevents the electrolytes from mixing but selected ions can pass through it, allowing the electrical energy to be stored in chemical form in each solution. When the electrical energy is needed, the electrolytes are pumped back into the electrochemical cells where the reverse reaction occurs, releasing electrons that are transported from the electrodes to the load. Since the electrolytes are stored in separate tanks, the storage capacity of the battery is totally a function of the size of the tanks [27]. The cost of a flow battery energy storage system is very high compared to other electrochemical energy storage systems, at least for low capacity applications, such as frequency regulation and power quality. The system is competitive with BES systems only for load shifting applications, due to the ease to scale the capacity of the system, even though the cost is still two times the one of more traditional systems such as Lead Batteries. Further cost reductions will be needed to make this technology economically attractive [18].


    4.3. Capacitors and Supercapacitors

    Capacitors—A capacitor is a device that stores electric charge on a set of metal (conducting) surfaces separated by a dielectric (non-conducting) material like ceramic, mica, plastic or glass. A cross-sectional diagram of a multi-layered capacitor is shown in Figure 10.

    Figure 10. Capacitor Cross-sectional Diagram and Symbol.

    The capacitance (expressed in Farads) is given by the formula: C=ε x A/d, where:

    -ε is the dielectric constant of the material between the plates,

    -A is the area of the plates

    -d is the distance between the plates

    The energy that can be stored in a capacitor is given by the formula: U= *C * V2, where

    -C is the capacitance

    -V is the voltage across the electrodes.

    The maximum amount of voltage that can be applied is a function of the dielectric strength of the material and its thickness.

    Super Capacitors—High capacity super-capacitors (or Ultra-capacitors) are electrochemical devices which are a hybrid between conventional capacitors and batteries. Fig 11 [28] shows a cross-sectional diagram. The device takes advantage of the electrochemical storage in the electrolyte (like conventional batteries) and the very narrow separation between the plates (~1 nano-meter) to achieve high capacitance. Super-capacitors are a relatively new technology and are suitable for low to medium power phase correction and voltage / frequency stabilization applications.

    Figure 11. Schematic of a Super-capacitor [28].

    The low cost of supercapacitorbased energy storage systems for high power applications (about 300 $/kW) combined with its high cost for high capacities (30000 $/kWh) [18] pushes the application for low energy, high power applications. In power quality applications, which satisfy these needs, supercapacitors are cheaper than battery systems and are competitive with Flywheel, and Superconducting Inductors.


    4.4. Superconducting Inductors (SMES—Superconducting Magnetic Energy Storage)

    An inductor is a device that stores energy in the magnetic field of its coil. Inductance (expressed in Henries) is a function of geometry, core materials and size. For a cylindrical, single winding, air core device, inductance is given by the following formula:

    L=(μ0 * K * N2 * A)/l where:

    0=permeability of air=4 * π * 10−7Henries /m

    -K=Nagaoka constant=1 for small diameter wires on a large diameter coil

    -N=number of turns in the coil

    -A=the area circumscribed by the coil diameter

    -l=the length of the wire in the winding

    The formula changes significantly for different shapes and core materials. The energy stored in an inductor is a function of the current flowing through the device and given by the formula:

    E=(L x I2)/2 where:

    -L=Inductance

    -I=Current

    Superconducting Magnetic Energy Storage Systems (SMES)—are inductors that take advantage of the increased current carrying capacity and efficiency of superconducting alloys to carry higher currents with lower electrical losses. Superconducting metal alloys exhibit no electrical resistance when cooled below their critical temperatures (e.g.≈ −270 °C). The higher currents flowing inside SMES devices can be maintained with very low I2 R losses for incredibly long periods of time, thus maximizing the energy stored per unit volume for a given current input [29,30]. Estimates of its cost show a very poor competitiveness in high to medium capacity applications, such as load shifting and frequency control, while they appear to be the cheapest solution in power quality applications, where extremely short response times are needed. This is due to the very low cost per kW (~300 $/kW) [18].


    4.5. Flywheel Energy Storage (FES)

    FES systems contain massive wheels rotating at very high speeds. The mechanical energy (angular momentum) in the wheels is supplied by an electric motor that is powered by the excess energy available on the Grid during the spin-up cycle. The mechanical energy in the spinning wheel is converted back into electrical energy at a later time by using the motor as a generator. The cross-sectional schematic of a FES system is shown in detail in figure 12 [31].

    Figure 12. Flywheel Energy Storage System [31].

    The main components of the system are: the flywheel rotor, the electrical Motor/Generator Unit (MGU), vacuum container and the bearings. The vacuum chamber and the bearings are designed to minimize losses due to friction.

    The amount of energy stored in the system is proportional to the square of the value of the angular velocity, and the mass of the flywheel. These systems can deliver several hundred kWatts of peak power but only for seconds [32]. The low cost per unit power (350 $/kW) and the relatively low cost per unit energy (1000 $/kWh) compared to SMES and Supercapacitors, makes this technology attractive for both low and medium capacity applications, with high power requirements, such as power quality and frequency regulation [18].


    4.6. Pumped Hydroelectric Energy Storage (PHES)

    Pumped Hydroelectric Energy Storage (PHES) accounted for almost 130 GW of installed capacity around the world in 2009 [33]. PHES systems offer large storage capacity (10’s of GWhrs) and high continuous poweroutput capability (10-1000MW). Atmospheric pollution is zero because they consume no fossil fuels. Although up-front capital costs are high, PHES systems are attractive because of their very long life cycles ( > 50 years), very low operating costs and low atmospheric pollution levels [34].

    Figure 13 shows a cross-sectional diagram of one configuration for a PHES facility -consisting of two water reservoirs situated at different altitudes ( > 200 feet) with a pumping and piping system that connects them to a hydroelectric generator. During low demand periods of the day, electrical energy is “stored” by pumping water from the lower reservoir into the upper reservoir. When electrical energy is needed, the water is released through the hydroelectric generator. RTEs of 70% to 80% are reported [19].

    Figure 13. Schematic of the PHES at Raccoon Mountain [35].

    Runoff from rain, ice, snow melt, etc. feeds the initial levels in the reservoirs and replenishes the water lost to evaporation and leakage. Most of the water is recycled through the system over and over again to generate electric power. Where legal and contractual obligations require discharge of water from the reservoirs for other uses (irrigation, domestic water supply, etc.), the inflow to the upper and lower reservoirs from natural sources must be greater than those demands plus the system losses.

    Forty such plants are in operation in the U.S. with a combined capacity of 20.5 GW. More are being evaluated, including seven subsurface sites that use existing mining caverns for the storage reservoirs. Many potential sites exist across the U.S., especially in areas where flood control and future water resource management issues add to the economic benefits. PHES is one of the most mature, operationally cost effective and pollution free mechanisms for storing energy. However, deployment is often slowed by long permitting cycle times (10 to 15 years) and obstacles raised by land use and environmental impact advocates [34,36].


    4.7. Compressed Air Energy Storage (CAES)

    Compressed Air Energy Storage systems use high pressure air as the energy storage media. This technology has been in commercial production for over 40 years and is operating in 2 different locations—Huntorf, Germany (commissioned 1978) and McIntosh, Alabama, USA (commissioned 1991)—for a total of 440 MW of capacity. CAES has characteristics comparable to PHES (large capacity and power output) but with lower roundtrip efficiencies (42-55%) [19]. CAES systems require an external natural gas fuel source to generate output power. Response times around 15-20 min have been demonstrated. Figure 14 shows a schematic for the CAES system in McIntosh, Alabama [33,37].

    Figure 14. Generic CAES plant scheme [38].

    The system consists of the compressor train, underground storage reservoir, a gas turbine connected to an electric generator and control and switching equipment to connect to the Grid. During the charging cycle the compressorraises the pressure of the ambient air up to 45-75 bar using the electricity supplied from the electrical grid during off-peak periods The compressed air is stored in an underground cavern until peak demand periods when it is mixed with natural gas in the output turbine and burned to drive the output stage, thus generating electrical power. Two thirds of the fuel in a conventional gas turbine system is consumed just to raise the pressure of the intake air to operating pressures. With a CAES system the pressurized intake air comes from the storage reservoir, so the total energy contained in the air flow generates electricity more efficiently, at a lower operating cost and with lower CO2 emissions than a stand-alone gas turbine generator. The electricity required by the compressors can come from any surplus electrical power source (coal, nuclear, hydroelectric, wind turbines, P.V. solar panels or even underutilized NG turbines) often at a lower cost.

    Site locations for CAES facilities are primarily governed by underground geological conditions. The two proven CAES facilities use solution mined salt domes for the storage reservoir. Such formations occur in scattered locations around the world and are usually very deep underground ( > 2000 meters). CAES sites also need to be geologicallystable. Earthquakes and fault zones can cause deterioration of the reservoir, rendering it inoperable. Other underground storage reservoir configurations have been suggested but none have been implemented. Smaller-scale above ground storage vessels are available that work the same way as cavern based systems and minimize the hazards of underground storage sites [33,37,39].


    5. Conclusion

    Several different energy storage technologies are in use for maximizing the reliability and operation of the electrical network. Each has its relevance based on the size, output rates, response times and other technical considerations. The ultimate determinant for choosing a given technology distills down to costs—both up-front, one time capital costs and the continuously re-occurring operating costs. Detailed analysis of the economic trade-offs are critical to making sound investments in energy storage technologies. The pressure to minimize environmental impacts of fossil fuels increases with time. The pressure to preserve strategic energy independence and low costs will make energy conservation and management through storage technology even more important in the future.


    Conflict of Interest

    All authors declare no conflict of interest in this paper.


    [1] Masters G (2004) Renewable and efficient electric power systems. Chapter 3.9.2. Wiley-Interscience, John Wiley & Sons, Inc, New Jersey, 75, 76.
    [2] Barnes F, Levine J (2011) Large Energy Storage Systems, Handbook CRC Press.
    [3] Yan J (2015) Handbook of Clean Energy Systems Vol 5, Wiley.
    [4] Kyriakopoulos G, Arabatzis G (2016) Electrical energy storage systems in electricity generation: energy policies, innovative technologies, and regulatory regimes. Renew Sust Energ Rev 56: 1044-1067. doi: 10.1016/j.rser.2015.12.046
    [5] Akhil A, Huff G, Currier A, et al. (2013) Electricity Storage Handbook in Collaboration with NRECA Sandia Report Sand 2013-5131.
    [6] U.S. Energy Information Administration (EIA) (2014) Derived from International Energy Report 2014.
    [7] Succar S, Williams R (2008) Compressed air energy storage: theory, resources, and applications for wind power. Princeton Environmental Institute, Princeton, NJ.
    [8] Denholm P, Hand M (2011) Grid flexibility and storage required to achieve very high penetration of variable renewable electricity. Energ Policy 39: 1817–1830. doi: 10.1016/j.enpol.2011.01.019
    [9] ENERGINET.DK (2014) 2013 was a record-setting year for Danish wind power. Available from: http://energinet.dk/EN/El/Nyheder/Sider/2013-var-et-rekordaar-for-dansk-vindkraft.aspx. (Access Date: 03/08/2016)
    [10] Sharman H (2009) Wind Energy the Case of Denmark, Center for Poitiske Studier, CEPOS. Available from: http://www.templar.co.uk/downloads/Wind_energy_-_the_case_of_ Denmark.pdf. (Access Date: 08/21/2016)
    [11] Reference case U.S. Energy Information Administration (EIA) (April 2015) Annual Energy Outlook 2015.
    [12] U.S. Energy Information Administration (EIA), Table 6.7.B. Capacity Factors for Utility Scale Generators Not Primarily Using Fossil Fuels, January 2013-May 2016 Available from: https://www.eia.gov/electricity/monthly/epm_table_grapher.cfm?t=epmt_6_07_b. (Access Date: 08/21/2016)
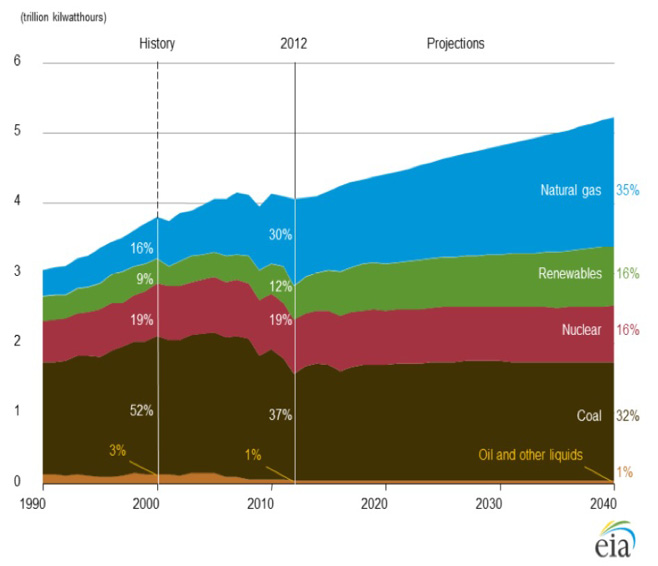
    [13] U.S. Energy Information Administration (EIA) Table 1.2 Primary Energy Production by Source. Available from: http://www.eia.gov/beta/MER/index.cfm?tbl=T01.02#/?f=A&start=200001. (Access Date: 08/21/2016)
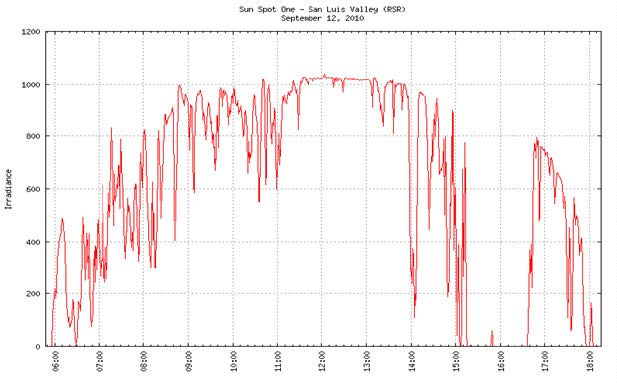
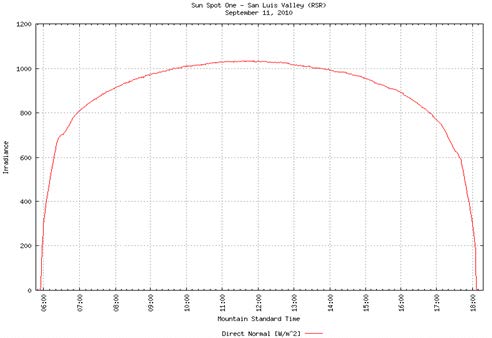
    [14] Andreas A, Stoffel T (2010) Sun Spot One, San Luis Valley, Colorado, Governor's Energy Office (Data) Available from: http://dx.doi.org/10.5439/1052221.
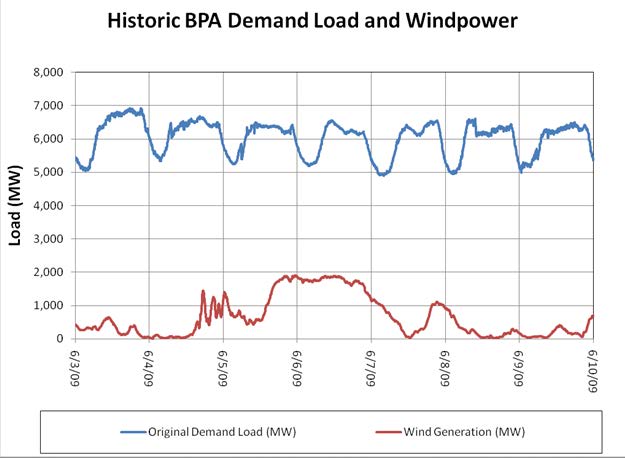
    [15] Bonneville Power Administration (2009) WIND GENERATION & Total Load in The BPA Balancing Authority Data at 5-minute increments for year 2009. Available from: https://transmission.bpa.gov/business/operations/wind/.
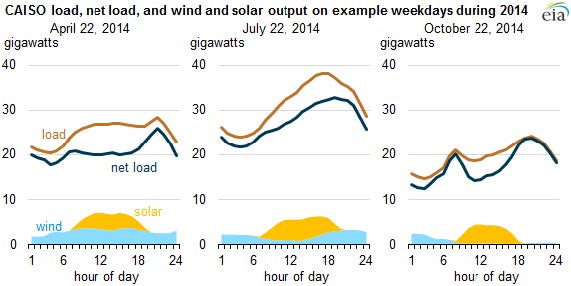
    [16] U.S. Energy Information Administration (Dec. 2014) Increased solar and wind electricity generation in California are changing net load shapes. Available from: http://www.eia.gov/todayinenergy/detail.cfm?id=19111. (Access Date: 08/21/2016)
    [17] California ISO (CAISO) Renewables Watch Available from: http://www.caiso.com/green/renewableswatch.html. (Access Date: 08/21/2016)
    [18] Sundararagavan S, Baker E (2012) Evaluating energy storage technologies for wind power integration. Solar Energy 86: 2707-2717. doi: 10.1016/j.solener.2012.06.013
    [19] Manuel W (2014) Energy Storage Study 2014, Available from: http://www.energy.ca.gov/assessments/ab2514_reports/Turlock_Irrigation_District/2014-10-28_ Turlock_Irrigation_District_Energy_Storage_Study.pdf. (Access Date: 08/21/2016)
    [20] Carnegie R, Gotham D, Nderitu D, et al. (2013) Utility Scale Energy Storage Systems, Benefits, Applications, and Technologies. Available from: https://www.purdue.edu/discoverypark/energy/ assets/pdfs/SUFG/publications/SUFG Energy Storage Report.pdf. (Access Date: 08/21/2016)
    [21] Energy Storage Association (ESA) Benefit Categories, Executive Summary. Available from: http://energystorage.org/energy-storage/energy-storage-benefits/benefit-categories. (Access Date: 08/21/2016)
    [22] Rastler D (2010) Electricity Energy Storage Technology Options: A White Paper Primer on Applications, Costs and Benefits: Electric Power Research Institute.
    [23] Luo X, Wang J, Dooner M, et al. (2015) Overview of current development in electrical energy storage technologies and the application potential in power system operation. Appl Energ V137: 511-53
    [24] Zaker B, Syri S (2015) Electrical energy storage systems: A comparative life cycle cost analysis. Renew Sust Energ Rev 42: 569-596. doi: 10.1016/j.rser.2014.10.011
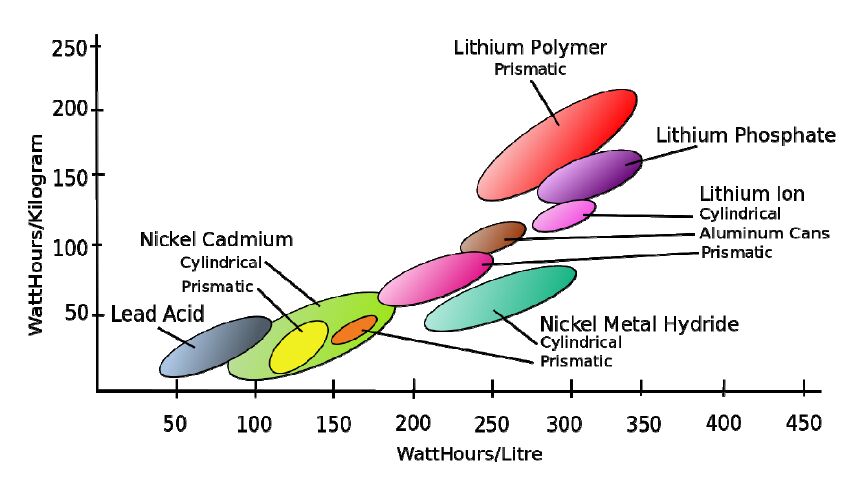
    [25] Polo M (2006) Secondary Cell Diagram of energy density Creative Commons. Available from: http://commons.wikimedia.org/wiki/File:Secondary_cell_energy_density.svg. (Access Date: 08/21/2016)
    [26] Environmental Health Perspectives (2007) VOLUME 115, NUMBER 7.
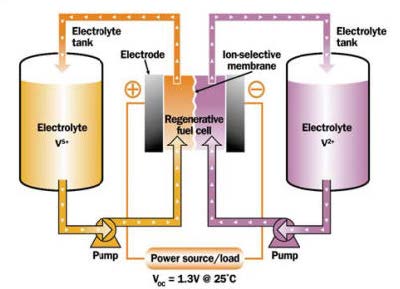
    [27] Lucas A, Chondrogiannis S (2016) Smart grid energy storage controller for frequency regulation and peakshaving, using a vanadium redox flow battery. Int J Electr Power Energ Syst 80: 26-36.
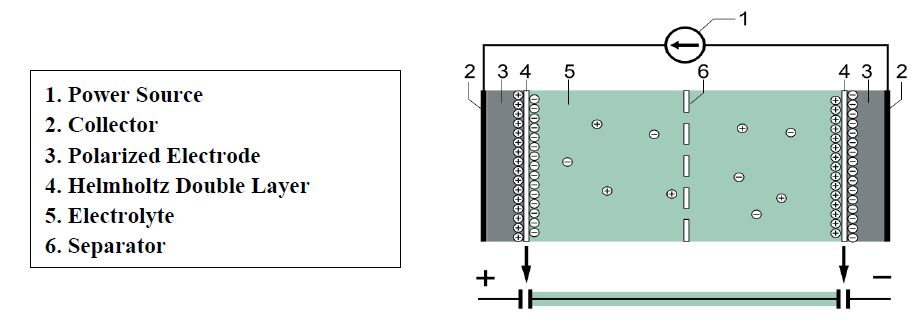
    [28] Tosaka (2008) Electric_double-layer_capacitor_(2_models)_-1_NT Creative Commons. Available from: http://commons.wikimedia.org/wiki/File:Electric_double-layer_capacitor_ (2_models)_-1_NT.PNG. (Access Date: 08/21/2016)
    [29] Nielsen K, Molinas M (2010) Superconducting Magnetic Energy Storage (SMES) in Power Systems with Renewable Energy Sources Industrial Electronics (ISIE), 2010 IEEE International Symposium on, 2487, 2492, 4-7.
    [30] Marouchkine A (2004) Room-Temperature Superconductivity, CISP Cambridge International Science Publishing.
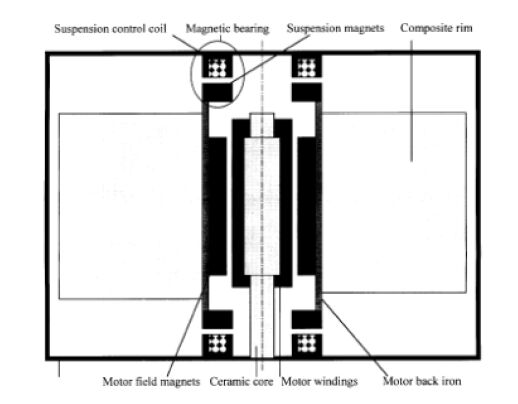
    [31] Stevens K, Thornton R, Clark T, et al. (2002) A Shaftless Magnetically Levitated Multifunctional Spacecraft Flywheel Storage System, Unclassified NASA final report. Available from: http://www.archive.org/details/nasa_techdoc_20020034156. (Access Date: 08/21/2016)
    [32] Bitterly J (1998) Flywheel technology: past, present and 21st century projections, IEEE AES Systems Magazine, 13-16.
    [33] Crotogino F (2001) Huntorf CAES: More than 20 years of successful operation. Available from: http://www.sciencedirect.com/science/article/pii/S1364032116300363.
    [34] Barbour E, Wilson I, Radcliffe J, et al. (2016), A review of pumped hydro energy storage development in significant international electricity markets. Renew Sust Energ Rev 61. Available from: http://dx.doi.org/10.1016/j.rser.2016.04.019.
    [35] Tennessee Valley Authority (2004) Raccon Mountain Pumped Storage Power Plant (TVA). Available from: http://www.tva.gov/power/pumpstorart.htm. (Access Date 07/2004)
    [36] Pickard W (2012) The History, Present State, and Future Prospects of Underground Pumped Hydro for Massive Energy Storage. Proceedings of the IEEE 100: 473-483. doi: 10.1109/JPROC.2011.2126030
    [37] R. EPRI – Pollak (1994) History of First US Compressed Air Energy Storage (CAES) Plant (110MW 26h) Volume 2.
    [38] DOE/EPRI (2013) DOE/EPRI 2013 Electricity Storage Handbook in Collaboration with NRECA, SANDIA Report 2013-5131. Available from: http://www.sandia.gov/ess/publications/ SAND2013-5131.pdf. (Access Date: 08/21/2016)
    [39] Budt M, Wolf D, Span R, et al. (2016) A review on compressed air energy storage: Basic principles, past milestones and recent developments. Appl Energ 170: 250-268. Available from: http://dx.doi.org/10.1016/j.apenergy.2016.02.108. doi: 10.1016/j.apenergy.2016.02.108
    [40] Available from: http://www.sciencedirect.com/science/article/pii/S0306261916302641.
  • This article has been cited by:

    1. Sintayehu Nibret Tiruneh, Bong Kyun Kang, Sung Hoon Kwag, Usama Bin Humayoun, Dae Ho Yoon, Nickel cobalt sulfide anchored in crumpled and porous graphene framework for electrochemical energy storage, 2018, 18, 15671739, S37, 10.1016/j.cap.2017.11.018
    2. Matthew D. Leonard, Efstathios E. Michaelides, Dimitrios N. Michaelides, Substitution of coal power plants with renewable energy sources – Shift of the power demand and energy storage, 2018, 164, 01968904, 27, 10.1016/j.enconman.2018.02.083
    3. Sammy Houssainy, Mohammad Janbozorgi, Pirouz Kavehpour, Performance of an Isobaric Hybrid Compressed Air Energy Storage System at Minimum Entropy Generation, 2020, 142, 0195-0738, 10.1115/1.4045931
    4. Efstathios E. Michaelides, Dimitrios N. Michaelides, Impact of nuclear energy on fossil fuel substitution, 2020, 366, 00295493, 110742, 10.1016/j.nucengdes.2020.110742
    5. Matthew D. Leonard, Efstathios E. Michaelides, Dimitrios N. Michaelides, Energy storage needs for the substitution of fossil fuel power plants with renewables, 2020, 145, 09601481, 951, 10.1016/j.renene.2019.06.066
    6. Shania Sharif, Khuram Shahzad Ahmad, Synthesis and physiognomic study of copper sulfide doped cobalt sulfide, 2019, 6, 2053-1591, 046408, 10.1088/2053-1591/aafb9e
    7. Sammy Houssainy, Mohammad Janbozorgi, Pirouz Kavehpour, Thermodynamic performance and cost optimization of a novel hybrid thermal-compressed air energy storage system design, 2018, 18, 2352152X, 206, 10.1016/j.est.2018.05.004
    8. Brady Bokelman, Efstathios E. Michaelides, Dimitrios N. Michaelides, A Geothermal-Solar Hybrid Power Plant with Thermal Energy Storage, 2020, 13, 1996-1073, 1018, 10.3390/en13051018
    9. Sammy Houssainy, Mohammad Janbozorgi, Pirouz Kavehpour, Theoretical Performance Limits of an Isobaric Hybrid Compressed Air Energy Storage System, 2018, 140, 0195-0738, 10.1115/1.4040060
    10. Efstathios E. Michaelides, Thermodynamics and energy usage of electric vehicles, 2020, 203, 01968904, 112246, 10.1016/j.enconman.2019.112246
    11. Godwin O. Uzedhe, Benjamin O. Akinloye, 2019, Controlled Investigation into Solar-Pneumatic Storage System for Green Power Generation in Rural Area, 978-1-7281-1010-3, 581, 10.1109/PowerAfrica.2019.8928876
    12. Matthew D. Leonard, Efstathios E. Michaelides, Grid-independent residential buildings with renewable energy sources, 2018, 148, 03605442, 448, 10.1016/j.energy.2018.01.168
    13. Michelle K. DeValeria, Efstathios E. Michaelides, Dimitrios N. Michaelides, Energy and thermal storage in clusters of grid-independent buildings, 2020, 190, 03605442, 116440, 10.1016/j.energy.2019.116440
    14. 2021, 4, 9781108635684, 147, 10.1017/9781108635684.005
    15. Efstathios E. Michaelides, Thermodynamics, Energy Dissipation, and Figures of Merit of Energy Storage Systems—A Critical Review, 2021, 14, 1996-1073, 6121, 10.3390/en14196121
    16. Zhao Zhang, Haifeng Liu, Zongyu Yue, Yang Li, He Liang, Xiangen Kong, Zunqing Zheng, Mingfa Yao, Effects of intake high-pressure compressed air on thermal-work conversion in a stationary diesel engine, 2023, 20, 1543-5075, 338, 10.1080/15435075.2022.2040509
    17. Efstathios Michaelides, Transition to Renewable Energy for Communities: Energy Storage Requirements and Dissipation, 2022, 15, 1996-1073, 5896, 10.3390/en15165896
    18. Efstathios E. Michaelides, Primary Energy Use and Environmental Effects of Electric Vehicles, 2021, 12, 2032-6653, 138, 10.3390/wevj12030138
    19. Raquel Sandoval Aguilar, Efstathios E. Michaelides, Microgrid for a Cluster of Grid Independent Buildings Powered by Solar and Wind Energy, 2021, 11, 2076-3417, 9214, 10.3390/app11199214
    20. Efstathios E. Michaelides, Thermal Storage for District Cooling—Implications for Renewable Energy Transition, 2021, 14, 1996-1073, 7317, 10.3390/en14217317
    21. Efstathios E. Michaelides, Viet N.D. Nguyen, Dimitrios N. Michaelides, The effect of electric vehicle energy storage on the transition to renewable energy, 2023, 2, 27731537, 100042, 10.1016/j.geits.2022.100042
    22. Parveen Tania, Sanjari Mohammad J., Arace Luke, Inertia compensation of power grid with flywheel-integrated synchronous condenser, 2023, 11, 2333-8334, 404, 10.3934/energy.2023021
    23. Yuekuan Zhou, Worldwide carbon neutrality transition? Energy efficiency, renewable, carbon trading and advanced energy policies, 2023, 27729702, 100026, 10.1016/j.enrev.2023.100026
    24. Efstathios E. Michaelides, Decarbonization of the electricity generation sector and its effects on sustainability goals, 2023, 10, 2731-9237, 10.1186/s40807-023-00080-1
    25. Efstathios E. Michaelides, Energy Efficiency and the Transition to Renewables—Building Communities of the Future, 2025, 18, 1996-1073, 1778, 10.3390/en18071778
    26. Efstathios E. Michaelides, Energy Efficiency and Grid-Independent Buildings, 2025, 147, 0199-6231, 10.1115/1.4068357
  • Reader Comments
  • © 2016 the Author(s), licensee AIMS Press. This is an open access article distributed under the terms of the Creative Commons Attribution License (http://creativecommons.org/licenses/by/4.0)
通讯作者: 陈斌, bchen63@163.com
  • 1. 

    沈阳化工大学材料科学与工程学院 沈阳 110142

  1. 本站搜索
  2. 百度学术搜索
  3. 万方数据库搜索
  4. CNKI搜索

Metrics

Article views(9627) PDF downloads(1371) Cited by(26)

Article outline

Other Articles By Authors

/

DownLoad:  Full-Size Img  PowerPoint
Return
Return

Catalog