Citation: Naeimeh Faraji, Yan Zhang, Ajay K. Ray. Impact of operating conditions on chromatographic column performance: experimental studies on adsorption of high-value minor whey proteins[J]. AIMS Bioengineering, 2017, 4(2): 223-238. doi: 10.3934/bioeng.2017.2.223
| [1] | Lindsay Arnold, Rachel Chen . One-step non-chromatography purification of a low abundant fucosylated protein from complex plant crude extract. AIMS Bioengineering, 2015, 2(3): 249-263. doi: 10.3934/bioeng.2015.3.249 |
| [2] | Lindsay Arnold, Tian-Bo Yang, Rachel Chen . A thermal responsive affinity ligand for precipitation of sialylated proteins. AIMS Bioengineering, 2016, 3(1): 92-102. doi: 10.3934/bioeng.2016.1.92 |
| [3] | Yihan Zhang . Manufacture of complex heart tissues: technological advancements and future directions. AIMS Bioengineering, 2021, 8(1): 73-92. doi: 10.3934/bioeng.2021008 |
| [4] | Natalia Fullana, Victoria Braña, Juan José Marizcurrena, Danilo Morales, Jean-Michel Betton, Mónica Marín, Susana Castro-Sowinski . Identification, recombinant production and partial biochemical characterization of an extracellular cold-active serine-metalloprotease from an Antarctic Pseudomonas isolate. AIMS Bioengineering, 2017, 4(3): 386-401. doi: 10.3934/bioeng.2017.3.386 |
| [5] | Ana Paula Guedes Pinheiro, Augusto Bücker, Ana Cláudia Cortez, John Edward Hallsworth, João Vicente Braga de Souza, Érica Simplício de Souza . Vinegar production from Theobroma grandiflorum SCHUM (cupuassu). AIMS Bioengineering, 2021, 8(4): 257-266. doi: 10.3934/bioeng.2021022 |
| [6] | Byron Carpenter . Current applications of mini G proteins to study the structure and function of G protein-coupled receptors. AIMS Bioengineering, 2018, 5(4): 209-225. doi: 10.3934/bioeng.2018.4.209 |
| [7] | Maria Waqas, Urooj Ainuddin, Umar Iftikhar . An analog electronic circuit model for cAMP-dependent pathway—towards creation of Silicon life. AIMS Bioengineering, 2022, 9(2): 145-162. doi: 10.3934/bioeng.2022011 |
| [8] | Steven Rheiner, Younsoo Bae . Increased poly(ethylene glycol) density decreases transfection efficacy of siRNA/poly(ethylene imine) complexes. AIMS Bioengineering, 2016, 3(4): 454-467. doi: 10.3934/bioeng.2016.4.454 |
| [9] | Carlos M. Carballosa, Jordan M. Greenberg, Herman S. Cheung . Expression and function of nicotinic acetylcholine receptors in stem cells. AIMS Bioengineering, 2016, 3(3): 245-263. doi: 10.3934/bioeng.2016.3.245 |
| [10] | Olga M. Tsivileva, Inna M. Uchaeva, Nikolay A. Yurasov . Biotesting of technologically important carboxy containing acridones with solid-state fungal culture. AIMS Bioengineering, 2021, 8(1): 1-13. doi: 10.3934/bioeng.2021001 |
Nomenclature
A coefficient in van Deemter equation (7) (m)
B coefficient in van Deemter equation (7) (m2/s)
Bb Bed permeability (m2/s)
C coefficient in van Deemter equation (7) (s)
c protein concentration in the mobile phase (M)
dp Particle diameter (m)
Dax axial dispersion coefficient (m2/s)
Dm molecular diffusivity in mobile phase (m2/s)
De effective diffusivity (m2/s)
h reduced HETP (= H/dp)
H Height equivalent to plate number (HETP) (m)
L length of the column (m)
ΔP column pressure drop (Pa)
u0 Superficial velocity of the fluid (m/s)
Vc column volume (m3)
Greek symbols
εc column void fraction
εp Intra-particle void fraction
εt total column void fraction
η mobile phase viscosity (Pa.s)
μ1 first moment of pulse response peak (s)
μ2 second moment of pulse response peak
Dimensionless transport parameters
Pe Péclet number (= uint L/Dax)
Re Reynolds number (= ρudp/η)
Sc Schmidt number (= η/ρDm)
Ion-exchange chromatography was introduced in the mid-1940s as a separation technique based on charge properties of molecular species [1]. Within the last few decades, there has been an increasing interest in liquid chromatographic processes because of the developing biotechnology scope and demands from the pharmaceutical and chemical industries for extremely particular and productive separation methods. Today, IEC is being employed for purification of proteins, peptides, nucleic acids and other charged biomolecules. IEC technique is well-suited for capture, intermediate purification or polishing steps in a purification protocol. IEC columns are commercially available from several suppliers, ranging from microscale purification and analysis through to purification of kilograms of product.
With increased commercial usage, in-depth understanding of different mechanisms within chromatography columns is desirable in order to achieve optimum performance. Regardless of intended application, operators seek a common set of performance characteristics such as high capacity and recovery, reproducibility, purification factor and a high degree of process control. Development of methods for protein purification processes is preferably done at small scale typically to obtain a robust, scalable process with the highest possible performance at the minimal cost without compromising with the product quality. This has stimulated much research to study the principles of preparative chromatography and the important subject of scale-up.
The performance of a chromatography column rests on elements of design and operational factors. Several studies have been focused on the determination of the experimental settings and column design parameters of separations in preparative chromatography. Atamna et al. [2] studied the effect of column diameter on resolution and efficiency with four different diameters using constant length columns. Gritti and Guichon [3] explained the theoretical and experimental investigations of the impact of the column diameter to the average particle size on the column performance that manufacturers of narrow-bore and/or capillary columns with small bed aspect ratio are facing.
Rathore and Velayudhan [4,5] presented an overview of the fundamentals and practices of scale-up in preparative chromatography. Modes of interaction and modes of operation are defined to clarify the choices available in the course of scale-up. The scaling-up of ion-exchange processes for protein separation has been reported in several studies. For example, Levison et al. [6] investigated an ovalbumin separation from hen egg-white on the anion exchange with a 1000-fold scale-up. Fibrous cellulose-based ion-exchangers were operated at high flow rates in a process-scale system demonstrating no loss of capacity or binding efficiency for the target proteins. Gerberding and
Byers [7] described a preparative anion exchange processing of proteins from dairy whey scaling from 5 cm to 140 cm column diameter to an economically optimized production level operation. According to the theory, an effective scale-up can be achieved by holding the retention factor of the components inside the column constant [8,9,10]. This means that the flow rate, loading and gradient length are scaled to the column volume. Thus, one must decide on column dimension. The key point in scale-up is the concept of time scales. The time scales involved are the time scales for flow, mass transfer, and dispersion. When scaling up or scaling down, processes of similarity will be processes, which have identical time scales [11].
It should be emphasized that many of the comparative issues and scale-up challenges are associated with momentum and mass-transfer problems in a large-scale production process. The combined effects of convection, axial dispersion, mass transfer within the particle pores, and sorption rate limitations reduce the performance [12,13,14,15]. Column performance can also be affected by other factors such as protein denaturation [16] and extra-column effects [17]. Depending on specific conditions, one or more of these mechanisms may dominate contributions to band broadening and peak asymmetry (fronting and tailing) or distortions [12,18], which can considerably affect separation effectiveness[19]. Some process procedures can be difficult to control, may suffer from a lack of reproducibility and involve significant losses of product. The feasibility and successful application of ion-exchange chromatography in the purification of proteins at pilot and process scale remains to be demonstrated.
A preparative chromatography study was conducted to investigate the effect of operation conditions on the dynamic adsorptive behavior of proteins in a commercialized strong cation ion-exchange SP Sepharose Fast Flow (SP FF). As separation efficiency relies on the flow properties of the column, the flow distribution was first observed under a non-binding condition loading an acetone solution. Prior to carry out the scale-up calculations, it is essentially necessary to figure out which mass transfer mechanism is controlling the ion-exchange process. The diffusion mechanism is often dominated mass transfer resistance for protein chromatography. To check if this hypothesis was the case for minor whey proteins and in particular lactoperoxidase, the height equivalent to plate number (HETP) and breakthrough profiles were determined for two columns with different diameters. The bed height was kept the same to maintain kinetic and dynamic equivalence. We investigated HETP as a function of velocity for LP and LF under non-binding conditions. LP breakthrough curves were then obtained at different flow rates and LP loading concentrations. The dynamic binding capacity at 10% breakthrough was calculated and compared for the both columns. Finally, the column efficiency in terms of HETP as well as dynamic binding capacity of the column performance for two different scales was evaluated.
Lactoperoxidase and lactoferrin from bovine milk both ≥ 90% purity were used. For elution under non-retained conditions, the elution buffer was prepared from 20 mM solution of Na2HPO4 and NaH2PO4, by adding 1 M NaCl adjusted to pH 6.7. For breakthrough studies under retained conditions, the running buffer was phosphate buffer saline (PBS), adjusted to pH 6.7. All chemical reagents used in the present work were purchased from Sigma-Aldrich (Oakville, Canada), except acetone and HCl from Caledon. Ultra-pure water was obtained using a Milli-Q system (Barnstead easy-pure RODI equipped with 0.2 μm filter, Fisher Scientific). Prior to use, all buffer solutions were filtered through a hydrophilic polypropylene membrane filter with a 0.2 μm pore size (PALL life Sciences, Canada) and de-gassed.
The 90μm SP Sepharose prepacked HiScreenTM and HiPrepTM columns (7.7 mm × 100 mm and 16 mm × 100 mm) were used from GE Healthcare (Mississauga, Canada). The experiments were carried out on the ÄKTA purifier 100 system (GE Healthcare Life Sciences, Canada), which includes two system pumps, a fraction collector and monitors for multi-wavelength UV absorption, pH, and conductivity. UNICORNTM 5.31 software was used for data acquisition and system control. The flow rate accuracy was checked by directly collecting the mobile phase in the absence of column at room temperature and displayed the long-term accuracy. The dead volume of the experimental device and void volumes of two columns were estimated from the elution volumes of acetone and dextran respectively corrected for the extra-column contribution.
| Parameter | HiScreenTM SP FF | HiPrepTM SP FF |
| Column length (mm) | 100 | 100 |
| Column i.d. (mm) | 7.7 | 16 |
| Median particle size (μm) | 90 | 90 |
| Column voidage | 0.296 | 0.273 |
| Particle voidage | 0.893 | 0.856 |
| Total voidage | 0.917 | 0.895 |
 DownLoad: CSV
The system dispersion curve was measured using a phosphate buffer containing 3% (v/v) acetone. The non-binding breakthrough data were fitted to Eq. 1 to determine the Péclet number (Pe) using least squares regression [20]. For mass transfer, the dimensionless Pe number describes the relative rate of convection and diffusion. In Eq. (1), c is the outlet effluent concentration, c0 is the solute loading concentration, Vloading is the volume of acetone solution loaded, and V50 is the loaded volume when c/c0 = 0.50.
| cc0=12{1+erf(Pe1/2(Vloading−V50)2(VloadingV50)1/2)} | (1) |
A concentration of 0.2 mg/mL for each protein was used. The experimental protocol is as follows: 1% CV of each protein solution is injected into the column through in which the buffer solution is flowing through. Similar to non-binding breakthrough, the binding experiments were monitored by recording the UV absorbance of protein at 280 nm at the column exit. Each experiment was conducted at different flow rates between 0.8-3.5 mL/min and 1.68-5.8 mL/min corresponding to linear velocities of 1.74-7.52 cm/min for HiScreenTM and 1.74-2.90 cm/min HiPrepTM columns respectively. All experiments were carried out at room temperature. Table 2 summarizes the experimental conditions used. It should be noted that volumes of 47 μL and 200 μL of protein samples (equivalent to 1% CV) were injected into the 7.7 mm × 100 mm and the 16 mm × 100 mm column in order to maintain constant sample loading per unit of column cross-section area.
| Protein | LP and LF |
| Concentration (mg/mL) | 0.2 |
| Injection volume (μL) | 47*, 200** |
| Flow velocity (cm/min) | 1.74, 2.50, 3.33, 4.50, 5.82, 6.67, 7.52*, 0.84, 1.00, 1.74, 2.00, 2.50, 2.88** |
| Buffer | 20 mM NaH2SO4+ Na2HPO4, 1 M NaCl pH 6.7 |
| Temperature (℃) | 22-22.5 |
| *HiScreenTM column, **HiPrepTM column | |
DownLoad: CSVOnly lactoperoxidase (LP) was used for these studies. The breakthrough curves were measured at different LP concentrations (0.02, 0.06, 0.1, 0.5 and 1 mg/mL) and flow velocities (1.74, 2.00, 2.50, 2.90 cm/min). The loading step with the protein solution was stopped after the outlet concentration of the column reached to the feed solution absorbance, afterwards the column was washed using 20 mM sodium phosphate + 1 M NaCl solution for 5 CV, followed by phosphate buffers for 5 CV of each. To compare the adsorption performance on two columns, the dynamic binding capacity at 10% breakthrough (DBC10%) was calculated using Eq. (2), where c is the LP outlet concentration, c0 is the LP loading concentration, V10%is the loading volume of LP solution when c/c0 = 0.10 and Vc is the volume of the column.
| DBC10%=c0V10%∫0(1−cc0)dVloadingVc | (2) |
All experiments were carried out at room temperature, operating conditions of which are reported in Table 3.
| Protein | LP |
| Concentration (mg/mL) | 0.02, 0.03, 0.06, 0.1, 0.5, 1 |
| Flow velocity (cm/min) | 1.74, 2, 2.50, 2.80 |
| Buffer | 20 mM NaH2SO4+ Na2HPO4, pH 6.7 |
| Temperature (℃) | 22-22.5 |
DownLoad: CSVPhysical insights on the flow distribution are particularly important for understanding and predicting the transport of molecules through the column particularly due to low Reynolds
number (Re) which is typical in protein chromatography. For each column, the acetone breakthrough curve was measured under non-binding conditions. As can be seen in Figure 1, the typical breakthrough curves obtained for both columns are identical. All following breakthrough profiles for HiPrepTM SP FF takes place later due to its larger void volume. The Pe number values were estimated from Eq. (1) and summarized in Table 4. The Pe values are comparatively identical for each column; the higher Pe numbers are preferred as they correspond to a uniform distribution of flow to the inlet surface of the column as well as uniform distribution of the binding site properties. At higher Pe values, the breakthrough curve tends to approach ideality and breakthrough corresponds to the capacity of the media. Indeed, higher efficiency due to less back mixing and shorter required time for diffusion can be achieved with higher flow rates.
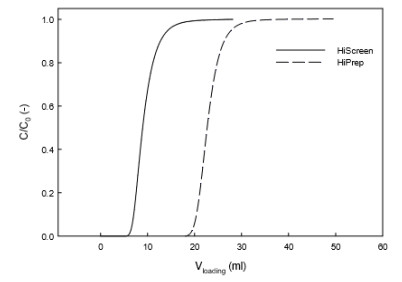 Figure 1. Non-binding breakthrough curves for HiScreenTM and HiPrepTM columns at a flow velocity of 2.5 cm/min and acetone loading concentration of 3% (v/v)
| Chromatography column | HiScreenTM SP FF | HiPrepTM SP FF | ||||||
| Velocity (cm/min) | 3.333 | 4.946 | 5.828 | 7.527 | 0.836 | 2.488 | 2.985 | 3.333 |
| Pe (-) | 35.01 ± 0.87 | 38.59 ± 0.91 | 37.49 ± 0.9 | 38.14 ± 0.97 | 190.3 ± 5.2 | 204.9 ± 4.6 | 196.7 ± 4.7 | 189 ± 5.4 |
DownLoad: CSVIn laminar flow, the pressure drop ΔP across a bed of length L packed with particles of diameter dp is given by Darcy's law:
| ΔP=ηu0L/Bb | (3) |
where η is the dynamic viscosity and Bb=ε3cd2p/150(1−εc)2 is the bed permeability, which depends on bed structure properties. This parameter is closely associated to resistance to mass transfer. For the HiScreenTM, bed permeability is calculated to be Bb=2.83×10⁻⁸ and for HiPrepTM Bb=3.01×10⁻⁸cm2/s.Using these permeability values, the pressure drop ΔP can be estimated as a function of linear velocity u0 (Figure 2). The large SP FF media pore size around 45-145 μm is a possible cause of this low backpressure which is an advantage for the operation. Both geometries show similar pressure values specifically at lower velocities due to their identical column height (10 cm). However, as can be seen in Figure 2, the pressure was slightly higher with HiScreenTM column for the reason that it has smaller cross-section area. It should be noted that the instrumentation employed in this study was not equipped with a pressure detector. Thus, the column pressure drop was only estimated and compared for the two columns.
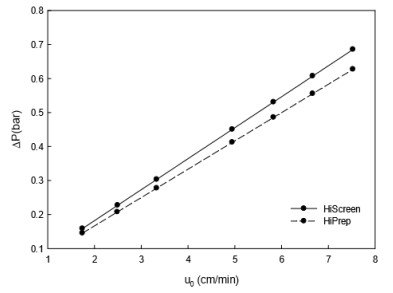 Figure 2. Operational pressures at different superficatial velocities for the two scales of coulumns
The peak responses were recorded at a wavelength of 280 nm for both LP and LF. For each of these flow rates and for each sample, the extra column contributions to the retention volume and to the band broadening of probes were measured by replacing the chromatographic column with a ZDV union connector. The experimental HETP data measured for the columns were corrected for the contribution of the ÄKTA FPLC system. The extra-column and the total band variances were measured according the numerical integration method. In this method, the data points (ti, ci) were considered and the true first and second central moments were calculated as follows:
| μ1=∫t0c(t)tdt∫t0c(t)dt | (4) |
| μ2=∫t0c(t)(t−μ1)2dtt∫0c(t)dt | (5) |
The moments were calculated based on the decomposition of the peak area into a series of elementary trapezes. The corrected reduced HETP, h=HETP/dp, was given by:
| h=Ldpμ2−μ2,ex(μ1−μ1,ex)2 | (6) |
where μ1, ex and μ2, exare the first and second central moments of the extra column band profiles.
Chromatographic peaks for the two proteins (LP and LF) obtained at various flow rates on SP FF medium are shown respectively in Figure 3.
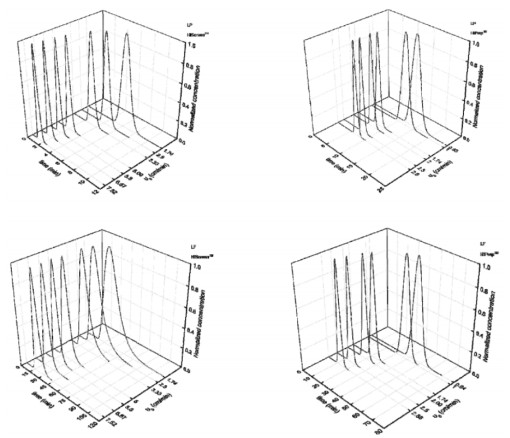 Figure 3. Elution chromatography of proteins on SP FF HiScreenTM and HiPrepTM columns under non-retained conditions LP and LF
A useful approach for the empirical characterization of column efficiency is based on van Deemter plot [21], which is used to assess the relative importance of dispersive and mass transfer kinetics. The experimental peaks for each protein in elution chromatography (Figure 3) were used to calculate HETP at various flow rates according to the numerical integration method described in previous section. The modified van Deemter equation adapted from [22] describes the effects of perfusion in a packed column:
| H=A+Bu0+Cf(λ)u0 | (7) |
In practical HPLC applications, A=2dp and B=2Dm; since the order of molecular diffusivity (Dm) is of 10−7cm2/s for proteins, the second term in Eq. (7) becomes negligibly small. The contribution of intra-particle convection becomes one at low flow rates. Thus, the slope of HETP vs. u0 is simply and in terms of reduced HETP, i.e. h=H/dp, can be written as:
| dhdu0=C=130ν(1+ν)2εpεcdpDe | (8) |
where εc external porosity, εp internal porosity and ν is ((1−εc)/εc)εp.
After initial rapid increase in HETP, the plot tends to a plateau at higher velocities expressed by Eq. (9). As u0 increases, the slope of HETP plot changes and mass transport becomes dominated by intra-particle convection [23].
| hplateau=A+35ν(1+ν)2εpεcBbBp | (9) |
Figure 4 illustrates the reduced HETP as a function of the superficial velocity that increases linearly with velocity for both proteins. The shape of HETP indicates the association with pore diffusion as the controlling mechanism of mass transport. It is essentially true as protein transport is restricted by diffusional hindrance due to large molecular configuration. This effect is even more remarkable for the two proteins of interest in this study. Indeed, as in our previous study, lactoperoxidase showed a high shielding factor indicating its hindrance impact on mass transport mechanism.
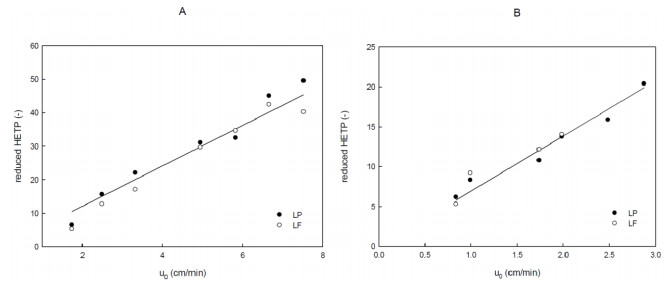 Figure 4. Reduced HETP vs. flow velocity u0 in elution chromatography on HiScreenTM A and HiPrepTM B Columns
To check reproducibility, two separate columns for each diameter were used and evaluated. For analysis, a single modified van Deemter plot is fitted to the two separate column data sets for each I.D. The data points collected for two columns at each column diameter were virtually superimposable. Rather than averaging the end results of two separate columns, the data from each column was combined for a single modified van Deemter fit. The fitted parameters of A and C were calculated by using SigmaPlot from Systat Software Inc. The values for reduced A term were found to be 0.016 and 0.023 for the studied columns. These values are in a good agreement with the estimation of A which equals 0.018 for SP FF. The reduced plate height for the test columns slightly increased with the slope (C term) of 6.02 and 6.90 for 7.7 and 16 mm I.D. column, respectively. A similar trend was observed by Patel et al. [24]. They reported that the van Deemter A term and C term coefficient exhibited an increase with increasing column diameter. The results clearly show that both columns offer a similar chromatographic performance for studied proteins.
For our experiments, the maximum linear velocity never exceeded 8 cm/min primarily due to pressure limitation of the columns. Thus, for the applied range of study no plateau was observed.
Chromatography columns are often characterized by the shape of their breakthrough curves. The breakthrough curve shape is governed by transport processes, heat effects, and adsorption kinetics within the functionalized adsorbent and by fluid hydrodynamics in the hold-up volumes of the columns. Commercial chromatography columns are optimized such as to obtain breakthrough curves that are as sharp as possible, in order to minimize buffer consumption and to maximize the utilized adsorbent capacity.
As the operating conditions having major influence on the performance of the adsorbent are the flow rate of the mobile phase and the protein loading concentration in the feed, the effect of these two operating conditions is experimentally studied. The obtained breakthrough curves for LP exhibited sharp breakthrough curves in most cases with both columns. The shape of the LP breakthrough curves was not rectangular, as seen for an ideal adsorbent [25]; yet symmetric in terms of the stoichiometric breakthrough time. One explanation for such a behavior could be the contribution of non-ideal effects such as dispersion effects due to pore size and length distribution. Another explanation could be the protein adsorption kinetic on the sulphopropyl (SP) strong cation exchange groups on the adsorbent surface. At high protein loadings, accessibility to the binding sites are further reduced and therefore diffusive transport limitations will be increased.
To study the impact of flow rate on the adsorption of LP on SP FF columns with two different diameters, dynamic adsorption experiments were carried out at flow rate between 1.74 cm/min and 2.80 cm/min. The flow rate was adjusted in order to obtain about the same linear velocity. The LP loading concentration was held constant at 0.03 mg/mL. The experimental breakthrough curves were plotted against the corrected LP loading volume (Vloading-V0) divided by CV (Figure 5). For both geometries, the breakthrough curves were unchanged at the operating range of flow rate. This confirms that it is likely to maintain the quality of the separation and to avoid any product stability issues at small scale and directly apply to the larger column with no flow rate effect. The obtained residence time of the loading acetone solution as a non-interacting tracer in the void volume was similar for both columns, i.e. at the flow velocity of 4.9 cm/min was equal to 1.88 and 1.80 min for HiScreenTM and HiPrepTM columns respectively. This generally indicates that the mass transfer mechanism is limited to diffusive transport.
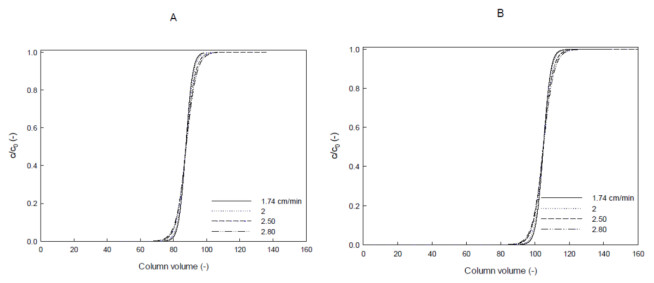 Figure 5. LP breakthrough curves of column HiScreenTM A and HiPrepTM B at different flow rates mL/min
The influence of feed loading concentration on breakthrough behaviour of LP was investigated at 0.02, 0.06, 0.1, 0.5 and 1 mg/mL LP for a flow velocity of 2.5 cm/min. The breakthrough curves were compared by plotting c/c0 as a function of the corrected loading volume of LP solution multiplied by the inlet concentration (c0) and divided by CV. Figure 6 illustrates the LP breakthrough curves at different LP loading concentrations for HiScreenTM and HiPrepTM columns respectively. For both columns, the profile of the breakthrough curves was uninfluenced by the feed concentration. However, the breakthrough occurs unexpectedly earlier at lower loading concentrations. This non-traditional behavior may be due to high amount of phosphate buffer (200 mM) present; the SP functional group of cation exchange has a great preference for sodium ions. With increasing LP concentration, the preference for LP over sodium ions takes turn resulting in a later breakthrough and higher dynamic capacity. van Beijeren et al. [25] also reported an increasing in binding capacity with increasing protein loading concentration for cation exchange membrane chromatography.
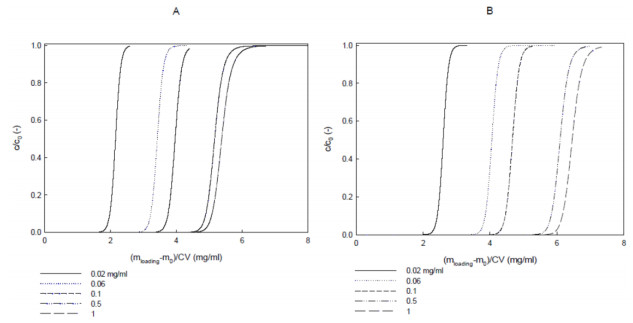 Figure 6. Experimental breakthrough curves of LP under different loading concentrations HiScreenTM column A and HiPrepTM column style="class:table_top_border"
Dynamic binding capacity (DBC) clarifies the impact of mass transfer limitations that may occur as flow rate is increased; it is much more useful in predicting real process performance. DBC is measured under operating conditions to obtain information on what the maximum load of the target protein to the column should be in order to prevent additional loss. For each column, the dynamic binding capacities at 10% breakthrough (DBC10%) were determined from the breakthrough curves attained at different flow rates. DBC10%was plotted as a function of superficial velocity in Figure 7. A negligible decrease with increased feed flow velocity can be observed, i.e. the dynamic binding capacity at 2.5 cm/min feed flow velocity being only 1.5% lower than that at 1.74 cm/min. In fact, less dependency of DBC on velocity is in agreement with results of HETP implying that protein uptake is controlled by pore diffusion. A decrease in dynamic binding capacity at increased flowrate for the adsorption of proteins on cation exchange was also observed for LF by Billakanti et al. [27], who found 15% decrease in DBC upon an increase of flow rate by a factor of five.
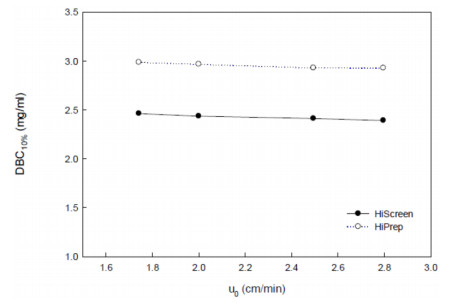 Figure 7. Dynamic binding capacity at 10% of breakthrough as a function of superficatial flow velocity
In this study, the highest DBC10%was obtained for the column with the larger column. For the 20 mL column, the LP binding capacity per unit of adsorbent volume was found around 20% higher than the one obtained with the 4.7 mL column. It is likely due to better flow distribution leading to deeper penetration of protein into the particles throughout the HiPrepTM column, which ultimately results in increasing binding capacity.
The dynamic binding capacity was also determined as a function of LP loading concentration. Figure 8 shows the concentration effect for both columns. Each column shows comparable results in the DBC10%with increasing the LP loading concentration. The DBC10%at 0.02 mg/mL was 1.96 and 2.40 mg/mL for HiScreenTM and HiPrepTM columns, respectively. As the inlet concentration increased to 1 mg/mL, these values increased to 5.04 and 6.12 mg/mL, corresponding to 1.57 and 1.55 fold increase in binding capacity. As previously described, this phenomenon might be due to the charge repulsion between proteins in the mobile phase and proteins adsorbed on the adsorbent and/or higher LP concentration. In addition, the obtained breakthrough curve beforehand at a concentration of 0.03 mg/mL and 2.5 cm/min is consistent with the result observed at the loading concentration range between 0.02 and 1 mg/mL. At these various loading concentrations, the binding capacities were lower with the HiScreenTM column, due to its smaller column diameter.
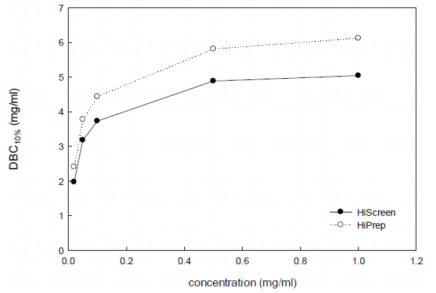 Figure 8. Effect of LP loading concentration on the dynamic binding capacity at 10% of breakthrough (DBC10%)
In this study, the influence of operating conditions on the adsorption of LP and LF on cation exchange adsorbent was experimentally investigated. In theory, the profiles should be similar due to the fact that the bed height, i.e. the flow path length through the column was kept equal. It was observed that under the same bed height at both scales comparable results of back pressure and breakthrough profiles can be obtained. The process efficiency in terms of the height equivalent to a theoretical plate (HETP) as well as the dynamic binding capacity was evaluated. Trends of HETP as a function of reduced velocity were consistent with two columns representing almost a constant efficiency for the increased column dimension. This indicates that efficiency could be expected to remain unchanged in scale-up step. The LP breakthrough curves were measured at various flow rates and loading concentrations. It was observed that the LP dynamic binding capacity at 10% breakthrough capacity was independent of the applied flow rate for two geometries. This proves the advantage of column chromatography, for which high flow rates can be used without decreasing the dynamic binding capacity in larger scales. Moreover, the dynamic binding capacity decreased at higher LP concentrations, which may be as a result of competitive adsorption between sodium ions and protein. A profound understanding of the impact of non-ideal effects particularly at high protein loadings on the rate of mass transport and adsorption is required for further optimization of ion-exchange adsorbent materials.
Overall, according to reproducibility and comparable results at larger scale in this study, scale-up of minor whey proteins separation can be accomplished by increasing column diameter while maintaining a constant column bed length and linear velocity. Although it leads to lower flow velocities, this approach has the advantage of reduced non-ideal flow distribution compared to small scale.
All authors declare no conflicts of interest in this paper.
| [1] |
Fritz JS (2004) Early milestones in the development of ion-exchange chromatography: a personal account. J Chromatogr A 1039: 3–12. doi: 10.1016/j.chroma.2003.12.068

|
| [2] | Atamna IZ, Muschick GM, Issaq HJ (1989) The effect of column diameter on HPLC separations using constant length columns. J Liq Chromatogr R T 12: 258–298. |
| [3] |
Gritti F, Guiochon G (2012) Theoretical and experimental impact of the bed aspect ratio on the axial dispersion coefficient of columns packed with 2.5 μm particles. J Chromatogr A 1262: 107–121. doi: 10.1016/j.chroma.2012.09.001
|
| [4] | Rathore SA, Velayudhan A (2002) An overview of scale-up in preparative chromatography in: scale-up and optimization in preparative chromatography: principles and biopharmaceutical applications, Marcel Dekker, New York. |
| [5] | Rathore AS, Velayudhan A (2003) Guidelines for optimization and scale-up in preparative chromatography. Biopharm Int 16: 34–42. |
| [6] |
Levison PR, Badger SE, Toome DW (1992) Economic considerations important in the scale-up of an ovalbumin separation from hen egg-white on the anion exchange cellulose DE92. J Chromatogr A 590: 49–58. doi: 10.1016/0021-9673(92)87005-S
|
| [7] |
Gerberding SJ, Byers CH (1998) Preparative ion-exchange chromatography of proteins from dairy whey. J Chromatogr A 808: 141–151. doi: 10.1016/S0021-9673(98)00103-4
|
| [8] | Pedersen L, Mollerup J (2000) Scale-up of chromatographic separations in ion-exchange chromatography, Poster presented at ISPPP 2000, Ljubljana, Slovenia, 5–8. |
| [9] | Pedersen L, Mollerup J (2001) Scale-up of chromatographic separations in ion-exchange chromatography, Poster presented at PREP' 2001, Washington, DC, USA, 26–29. |
| [10] |
Pedersen L, Mollerup J, Hansen E, et al. (2003) Whey proteins as a model system for chromatographic separation of proteins. J Chromatogr B 790: 161–173. doi: 10.1016/S1570-0232(03)00127-2
|
| [11] |
Lightfoot EN (1999) Speeding the design of bioseparations: a heuristic approach to engineering design. Ind Eng Chem Res 38: 3628–3634. doi: 10.1021/ie9900566
|
| [12] | Lenhoff AM (1987) Significance and estimation of chromatographic parameters. J Chromatogr A 384: 285–299. |
| [13] |
Stanley BJ, Savage TL, Geraghty J (1998) Calculation of the hydrodynamic contribution to peak asymmetry in high-perfomance liquid chromatography using the equilibrium-dispersive model. Anal Chem 70: 1610–1617. doi: 10.1021/ac971096r
|
| [14] |
Levison PR (2003) Large-scale ion-exchange column chromatography of proteins comparison of different formats. J Chromatogr B 790: 17–33. doi: 10.1016/S1570-0232(03)00087-4
|
| [15] | Guiochon G, Felinger A, Shirazi DG, et al. (2006) Fundamentals of preparative and nonlinear chromatography, 2nd ed., Elsevier Academic Press, New York. |
| [16] |
Whitley RD, Zhang X, Wang NHL (1994) Protein denaturation in nonlinear isocratic and gradient elution chromatography. Aiche J 40: 1067–1081. doi: 10.1002/aic.690400617
|
| [17] |
Kaltenbrunner O, Jungbauer A, Yamamoto S (1997) Prediction of the preparative chromatography performance with a very small column. J Chromatogr A 760: 41–53. doi: 10.1016/S0021-9673(96)00689-9
|
| [18] |
Li P, Xiu G, Rodrigues AE (2004) Modeling breakthough and elution curves in fixed bed of inert core adsorbents: analytical and approximate solutions. Chem Eng Sci 59: 3091–3103. doi: 10.1016/j.ces.2004.04.034
|
| [19] |
Jacobson N, Degerman M, Stenborg E, et al. (2007) Model based robustness analysis of an ion-exchange chromatography step. J Chromatogr A 1138: 109–119. doi: 10.1016/j.chroma.2006.10.057
|
| [20] |
Schneiderman S, Varadaraju H, Zhang L, et al. (2011) Mathematical model using non-uniform flow distribution for dynamic protein breakthrough with membrane adsorption media. J Chromatogr A 1218: 9121–9127. doi: 10.1016/j.chroma.2011.10.063
|
| [21] |
Van Deemter JJ, Zuiderweg FJ, Klinkenberg A (1956) Longitudinal diffusion and resistance to mass transfer as causes of nonideality in chromatography. Chem Eng Sci 5: 271–289. doi: 10.1016/0009-2509(56)80003-1
|
| [22] | Rodrigues AE (1993) An extended van Deemter equation (Rodrigues equation) for performing chromatographic processes using large-pore, permeable particles, 6: 20. |
| [23] |
Rodrigues AE, Loureiro JM, Chenou C (1995) Bioseparations with permeable particles. J Chromatogr B 664: 233–240. doi: 10.1016/0378-4347(94)00361-8
|
| [24] | Patel KD, Jerkovich AD, Link JC, et al. (2004) In-depth characterization of slurry packed capillary columns with 1.0 µm nonporous particles using reversed-phase isocratic ultrahigh-pressure liquid chromatography. Anal Chem 76: 5777–5786. |
| [25] | Van Beijeren P, Kreis P, Zeiner T (2012) Ion exchange membrane adsorption of bovine serum albumin: impact of operating and buffer conditions on breakthrough curves. J Membr Sci s415–s416: 568–576. |
| [26] |
Harinarayan C, Mueller J, Ljunglöf A, et al. (2006) An exclusion mechanism in ion exchange chromatography. Biotechnol Bioeng 95: 775–787. doi: 10.1002/bit.21080
|
| [27] |
Billakanti JM, Fee CJ (2009) Characterization of cryogel monoliths for extraction of minor proteins from milk by cation exchange. Biotechnol Bioeng 103: 1155–1163. doi: 10.1002/bit.22344
|
| 1. | Jelena Radosavljević, Dragana Stanić-Vučinić, Marija Stojadinović, Mirjana Radomirović, Ana Simović, Milica Radibratović, Tanja Ćirković Veličković, Application of Ion Exchange and Adsorption Techniques for Separation of Whey Proteins from Bovine Milk, 2021, 18, 15734110, 341, 10.2174/1573411017666210108092338 |

Naeimeh Faraji, Yan Zhang, Ajay K. Ray. Impact of operating conditions on chromatographic column performance: experimental studies on adsorption of high-value minor whey proteins[J]. AIMS Bioengineering, 2017, 4(2): 223-238. doi: 10.3934/bioeng.2017.2.223

| Parameter | HiScreenTM SP FF | HiPrepTM SP FF |
| Column length (mm) | 100 | 100 |
| Column i.d. (mm) | 7.7 | 16 |
| Median particle size (μm) | 90 | 90 |
| Column voidage | 0.296 | 0.273 |
| Particle voidage | 0.893 | 0.856 |
| Total voidage | 0.917 | 0.895 |
DownLoad: CSV| Protein | LP and LF |
| Concentration (mg/mL) | 0.2 |
| Injection volume (μL) | 47*, 200** |
| Flow velocity (cm/min) | 1.74, 2.50, 3.33, 4.50, 5.82, 6.67, 7.52*, 0.84, 1.00, 1.74, 2.00, 2.50, 2.88** |
| Buffer | 20 mM NaH2SO4+ Na2HPO4, 1 M NaCl pH 6.7 |
| Temperature (℃) | 22-22.5 |
| *HiScreenTM column, **HiPrepTM column | |
DownLoad: CSV| Protein | LP |
| Concentration (mg/mL) | 0.02, 0.03, 0.06, 0.1, 0.5, 1 |
| Flow velocity (cm/min) | 1.74, 2, 2.50, 2.80 |
| Buffer | 20 mM NaH2SO4+ Na2HPO4, pH 6.7 |
| Temperature (℃) | 22-22.5 |
DownLoad: CSV| Chromatography column | HiScreenTM SP FF | HiPrepTM SP FF | ||||||
| Velocity (cm/min) | 3.333 | 4.946 | 5.828 | 7.527 | 0.836 | 2.488 | 2.985 | 3.333 |
| Pe (-) | 35.01 ± 0.87 | 38.59 ± 0.91 | 37.49 ± 0.9 | 38.14 ± 0.97 | 190.3 ± 5.2 | 204.9 ± 4.6 | 196.7 ± 4.7 | 189 ± 5.4 |
DownLoad: CSV| Parameter | HiScreenTM SP FF | HiPrepTM SP FF |
| Column length (mm) | 100 | 100 |
| Column i.d. (mm) | 7.7 | 16 |
| Median particle size (μm) | 90 | 90 |
| Column voidage | 0.296 | 0.273 |
| Particle voidage | 0.893 | 0.856 |
| Total voidage | 0.917 | 0.895 |
| Protein | LP and LF |
| Concentration (mg/mL) | 0.2 |
| Injection volume (μL) | 47*, 200** |
| Flow velocity (cm/min) | 1.74, 2.50, 3.33, 4.50, 5.82, 6.67, 7.52*, 0.84, 1.00, 1.74, 2.00, 2.50, 2.88** |
| Buffer | 20 mM NaH2SO4+ Na2HPO4, 1 M NaCl pH 6.7 |
| Temperature (℃) | 22-22.5 |
| *HiScreenTM column, **HiPrepTM column | |
| Protein | LP |
| Concentration (mg/mL) | 0.02, 0.03, 0.06, 0.1, 0.5, 1 |
| Flow velocity (cm/min) | 1.74, 2, 2.50, 2.80 |
| Buffer | 20 mM NaH2SO4+ Na2HPO4, pH 6.7 |
| Temperature (℃) | 22-22.5 |
| Chromatography column | HiScreenTM SP FF | HiPrepTM SP FF | ||||||
| Velocity (cm/min) | 3.333 | 4.946 | 5.828 | 7.527 | 0.836 | 2.488 | 2.985 | 3.333 |
| Pe (-) | 35.01 ± 0.87 | 38.59 ± 0.91 | 37.49 ± 0.9 | 38.14 ± 0.97 | 190.3 ± 5.2 | 204.9 ± 4.6 | 196.7 ± 4.7 | 189 ± 5.4 |


