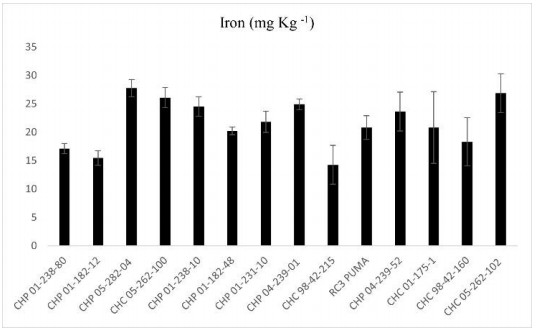
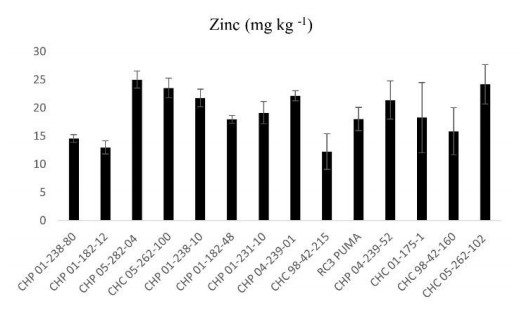
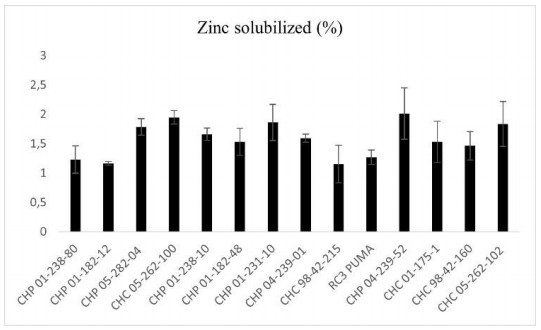
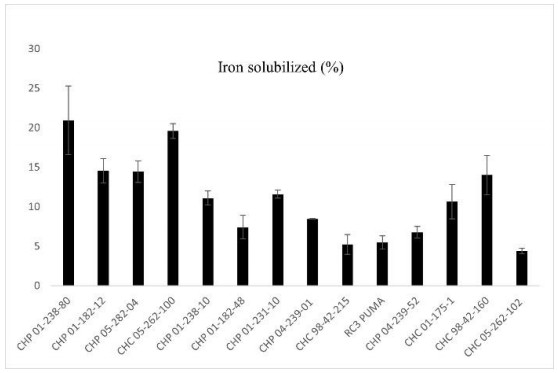
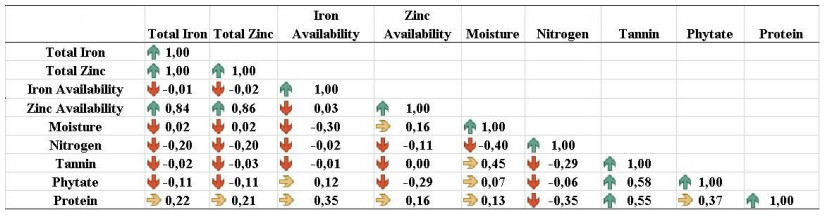
Beans (Phaseolus vulgaris L.) are the most important legume for human consumption, and have essential nutrients for physiological processes. As examples, we can mention Fe and Zn. As a strategy to increase these nutrients in the population's diet, beans stand out as a potential candidate, as it already has high levels of these minerals compared to other foods. The objective of this study was to evaluate 14 bean genotypes from the EPAGRI Bean Genetic Improvement Program, Brazil, regarding Fe and Zn content, availability of Fe and Zn in vitro, amount of phytic acid, tannins, proteins, and moisture. The results showed a high positive correlation between the total amount of Zn with bioavailable Zn; the total amount of Fe, and the total amount of Zn; and the total amount of bioavailable Fe with Zn. Furthermore, there were statistically significant differences for all characteristics evaluated, showing an interesting variability that can be considered for future crosses aiming at nutritional quality.
Citation: Julliane Destro de Lima, Wesley Ribeiro Rivadavea, Sydney Antonio Frehner Kavalco, Affonso Celso Gonçalves Junior, Ana Daniela Lopes, Glacy Jaqueline da Silva. Chemical and nutritional characterization of bean genotypes (Phaseolus vulgaris L.)[J]. AIMS Agriculture and Food, 2021, 6(4): 932-944. doi: 10.3934/agrfood.2021056
Beans (Phaseolus vulgaris L.) are the most important legume for human consumption, and have essential nutrients for physiological processes. As examples, we can mention Fe and Zn. As a strategy to increase these nutrients in the population's diet, beans stand out as a potential candidate, as it already has high levels of these minerals compared to other foods. The objective of this study was to evaluate 14 bean genotypes from the EPAGRI Bean Genetic Improvement Program, Brazil, regarding Fe and Zn content, availability of Fe and Zn in vitro, amount of phytic acid, tannins, proteins, and moisture. The results showed a high positive correlation between the total amount of Zn with bioavailable Zn; the total amount of Fe, and the total amount of Zn; and the total amount of bioavailable Fe with Zn. Furthermore, there were statistically significant differences for all characteristics evaluated, showing an interesting variability that can be considered for future crosses aiming at nutritional quality.

| [1] | Companhia Nacional de Abastecimento CONAB (2020) Acompanhamento da safra brasileira de grãos, safra 2019/20—Décimo primeiro levantamento, Brasília, 1. Available from: https://www.conab.gov.br/info-agro/safras/graos. |
| [2] | FAOSTAT Crops (2019) Available from: http://www.fao.org/faostat/en/#data/QC. |
| [3] | EMBRAPA (2017) Centro-Oeste lidera produção agrícola brasileira. Available from: https://www.gov.br/agricultura/pt-br/assuntos/noticias/centro-oeste-lidera-producao-agricola-brasileira. |
| [4] | SEAB. Feijão-Análise da Conjuntura Agropecuária. Available from: http://www.agricultura.pr.gov.br/arquivos/File/deral/Prognosticos/2018/feijão_2018_versao_1.pdf |
| [5] |
Fabbri AD, Crosby GA (2016) A review of the impact of preparation and cooking on the nutritional quality of vegetables and legumes. Int J Gastron Food Sci 3: 2-11. doi: 10.1016/j.ijgfs.2015.11.001

|
| [6] |
Hess SY (2017) National risk of Zn deficiency as estimated by national surveys. Food Nutr Bull 38: 3-17. doi: 10.1177/0379572116689000
|
| [7] |
Gupta S, Brazier AKM, Lowe NM (2020) Zn deficiency in low-and middle-income countries: Prevalence and approaches for mitigation. J Hum Nutr Diet 33: 624-643. doi: 10.1111/jhn.12791
|
| [8] |
Cascio MJ, DeLoughery TG (2017) Anemia: Evaluation and diagnostic tests. Med Clin N Am 101: 263-284. doi: 10.1016/j.mcna.2016.09.003
|
| [9] | Esteves AM, Abreu CD, Santos CD, et al. (2002) Comparação química e enzimática de seis linhagens de feijão (Phaseolus vulgaris L.). Ciênc Agrotec 26: 999-1005. |
| [10] | CIAT (2020) International Center for Tropical Agriculture. Available from: https://genebank.ciat.cgiar.org/genebank/bshowcollection.do?type=search&by=showall&collection=bean&new=new&category=. |
| [11] | Embrapa (2015) Alimentos biofortificados buscam reduzir a desnutrição da população. Brasília: Portal Embrapa. Available from: https://www.embrapa.br/busca-de-noticias/-/noticia/3254365/alimentos-biofortificados-buscam-reduzir-a-desnutricao-da-populacao. |
| [12] | Molina MR, Fuente G, Bressani R (1975) Interrelationships between storage, soaking time, cooking time, nutritive value and other characteristics of the black bean (Phaseolus vulgaris). Food Sci Technol 40: 587-591. |
| [13] | Zenebon O, Pascuet NS (2005) Métodos físico-químicos para análise de alimentos. In: Métodos físico-químicos para análise de alimentos, 4 Eds., São Paulo: IAL, 1018-1018. |
| [14] | Official methods of analysis (1984) Association of official Analytical Chemists, 40a Ed, USA. |
| [15] | Kjeldahl, J (1883) Neue Methode zur Bestimmung des Stickstoffs in organischen Körpern. Fresenius, Zeitschrift f anal Chemie 22: 366-382. |
| [16] |
Haug W, Lantzsch HJ (1983) Sensitive method for the rapid determination of phytate in cereals and cereal products. J Sci Food Agric 34: 1423-1426. doi: 10.1002/jsfa.2740341217
|
| [17] |
Price ML, Hagerman AE, Butler LG. (1980). Tannin content of cowpeas, chickpeas, pigeon peas, and mung beans. J Agric Food Chem 28: 459-461. doi: 10.1021/jf60228a047
|
| [18] | ASSISTAT (2017) Assistência estatística. Available from: http://www.assistat.com/indexp.html. |
| [19] | StatSoft (2012) Electronic Statistics Textbook. Tulsa, OK: StatSoft. Available from: http://www.statsoft.com/textbook/. |
| [20] | Ribeiro ND, Steckling SDM, Mezzomo HC, et al. (2019) Genetic parameters and combined selection for phosphorus, phytate, Fe, and Zn in Mesoamerican common bean lines. Agricultural Sciences·Ciênc Agrotec 43, Available from: https://doi.org/10.1590/1413-7054201943027818. |
| [21] | Rezende AA, Pacheco MTB, Silva VSND, et al. (2017) Nutritional and protein quality of dry Brazilian beans (Phaseolus vulgaris L.). Food Sci Technol 38: 421-427. |
| [22] |
Ojo, MA (2020) Phytic acid in legumes: A review of nutritional importance and hydrothermal processing effect on underutilised species. Food Res 5: 22-28. doi: 10.26656/fr.2017.5(3).325
|
| [23] | Petry N, Egli I, Campion B, et al. (2013) Genetic reduction of phytate in common bean (Phaseolus vulgaris L.) seeds increases Fe absorption in young women. J Nutr 143: 1219-1224. |
| [24] |
Akond MA, Crawford H, Berthold J, et al. (2011) Minerals (Zn, Fe, Ca and Mg) and antinutrient (phytic acid) constituents in common bean. Am J Food Technol 6: 235-243. doi: 10.3923/ajft.2011.235.243
|
| [25] |
Guzmán-Maldonado SH, Acosta-Gallegos J, Paredes-López O (2000) Protein and mineral content of a novel collection of wild and weedy common bean (Phaseolus vulgaris L). J Sci Food Agric 80: 1874-1881. doi: 10.1002/1097-0010(200010)80:13<1874::AID-JSFA722>3.0.CO;2-X
|
| [26] | Carvalho LJ, Corrêa M, Pereira E, Nutti M, et al. (2012). Fe and Zn retention in common beans (Phaseolus vulgaris L.) after home cooking. Food Nutr Res 56: 15618. |
| [27] | Pires CV, Oliveira MGA, Cruz GADR, et al. (2005) Composição físico-química de diferentes cultivares de feijão (Phaseolus vulgaris L.). Alim Nutr Araraquara 16: 157-162. |
| [28] | TBCA (2019) Tabela Brasileira de Composição de Alimentos. Version 7.0. Available from: http://www.fcf.usp.br/tbca/. |
| [29] |
Zemolin AEM, Ribeiro ND, Casagrande CR, et al. (2016) Genetic parameters of Fe and Zn concentrations in Andean common bean seeds. Acta Sci, Agron 38: 439-446. doi: 10.4025/actasciagron.v38i4.30652
|
| [30] |
Teixeira RDK, Lima S, Abreu DC, et al. (2015) Implications of early selection for grain colour on Fe and Zn content and productivity of common bean. Plant Breed 134: 193-196. doi: 10.1111/pbr.12241
|
| [31] | Ramalho MAP, Ferreira DF, Oliveira AC (2012) Experimentação em Genética e Melhoramento de Plantas, 3rd Edn. UFLA, Lavras. |
| [32] | Blair MW, Astudillo C, Grusak MA, et al. (2009) Inheritance of seed Fe and Zn concentrations in common bean (Phaseolus vulgaris L.). Mol Breed 23: 197-207. |
| [33] | Izquierdo P, Astudillo C, Blair MW, et al. (2018). Meta-QTL analysis of seed Fe and Zn concentration and content in common bean (Phaseolus vulgaris L.). Theor Appl Genet 131: 1645-1658. |
| [34] | Gelin JR, Forster S, Grafton KF, et al. (2007) Analysis of seed-Zn and other nutrients in a recombinant inbred population of navy bean (Phaseolus vulgaris L.). Crop Sci 47: 1361-1366. |
| [35] |
Mukamuhirwa F, Tusiime G, Mukankusi MC (2015) Inheritance of high Fe and Zn concentration in selected bean varieties. Euphytica 205: 349-360. doi: 10.1007/s10681-015-1385-4
|
| [36] | Feitosa S, Greiner R, Meinhardt AK, et al. (2018) Effect of traditional household processes on Fe, Zn and copper bioaccessibility in black bean (Phaseolus vulgaris L.). Foods 7: 123. |
| [37] | Moura NCD, Canniatti BSG (2006) Avaliação da disponibilidade de ferro de feijão comum (Phaseolus vulgaris L.) em comparação com carne bovina. Food Sci Technol 26: 270-276. |
| [38] |
Faria MA, Araújo A, Pinto E, et al. (2018) Bioaccessibility and intestinal uptake of minerals from different types of home-cooked and ready-to-eat beans. J Func Foods 50: 201-209. doi: 10.1016/j.jff.2018.10.001
|
| [39] |
Castro-Alba V, Lazarte CE, Bergenståhl B, et al. (2019) Phytate, Fe, Zn, and calcium content of common Bolivian foods and their estimated mineral bioavailability. Food Sci, Nutr 7: 2854-2865. doi: 10.1002/fsn3.1127
|
| [40] |
Vaz-Tostes MDG, Verediano TA, de Mejia EG et al. (2016) Avaliação da biodisponibilidade de ferro e Zno em grãos destinados à biofortificação por meio de modelos in vitro e in vivo e seu efeito no estado nutricional de pré-escolares. J Sci Food Agric 96: 1326-1332. doi: 10.1002/jsfa.7226
|
Figures(6) / Tables(1)

Julliane Destro de Lima, Wesley Ribeiro Rivadavea, Sydney Antonio Frehner Kavalco, Affonso Celso Gonçalves Junior, Ana Daniela Lopes, Glacy Jaqueline da Silva. Chemical and nutritional characterization of bean genotypes (Phaseolus vulgaris L.)[J]. AIMS Agriculture and Food, 2021, 6(4): 932-944. doi: 10.3934/agrfood.2021056


 DownLoad: