Citation: Poullikkas Andreas, Kourtis George, Hadjipaschalis Ioannis. Cost-benefit analysis for the installation of cogeneration CSP technology in Cyprus[J]. AIMS Energy, 2013, 1(1): 48-62. doi: 10.3934/energy.2013.1.48
[1] | Mulualem T. Yeshalem, Baseem Khan . Design of an off-grid hybrid PV/wind power system for remote mobile base station: A case study. AIMS Energy, 2017, 5(1): 96-112. doi: 10.3934/energy.2017.1.96 |
[2] | Abdulrahman Th. Mohammad, Amer Ibrahim Ismael . An equivalent photovoltaic solar system to solve the problems of electricity in Iraqi houses. AIMS Energy, 2019, 7(5): 660-670. doi: 10.3934/energy.2019.5.660 |
[3] | Gul Ahmad Ludin, Mohammad Amin Amin, Assadullah Aminzay, Tomonobu Senjyu . Theoretical potential and utilization of renewable energy in Afghanistan. AIMS Energy, 2017, 5(1): 1-19. doi: 10.3934/energy.2017.1.1 |
[4] | V. V. Thang, Thanhtung Ha . Optimal siting and sizing of renewable sources in distribution system planning based on life cycle cost and considering uncertainties. AIMS Energy, 2019, 7(2): 211-226. doi: 10.3934/energy.2019.2.211 |
[5] | Laveet Kumar, Jahanzaib Soomro, Hafeez Khoharo, Mamdouh El Haj Assad . A comprehensive review of solar thermal desalination technologies for freshwater production. AIMS Energy, 2023, 11(2): 293-318. doi: 10.3934/energy.2023016 |
[6] | Gustavo Henrique Romeu da Silva, Andreas Nascimento, Christoph Daniel Baum, Nazem Nascimento, Mauro Hugo Mathias, Mohd Amro . Renewable energy perspectives: Brazilian case study on green hydrogen production. AIMS Energy, 2025, 13(2): 449-470. doi: 10.3934/energy.2025017 |
[7] | Md. Mehadi Hasan Shamim, Sidratul Montaha Silmee, Md. Mamun Sikder . Optimization and cost-benefit analysis of a grid-connected solar photovoltaic system. AIMS Energy, 2022, 10(3): 434-457. doi: 10.3934/energy.2022022 |
[8] | Michael O. Dioha, Atul Kumar . Rooftop solar PV for urban residential buildings of Nigeria: A preliminary attempt towards potential estimation. AIMS Energy, 2018, 6(5): 710-734. doi: 10.3934/energy.2018.5.710 |
[9] | Muti Ur Rehman Tahir, Adil Amin, Ateeq Ahmed Baig, Sajjad Manzoor, Anwar ul Haq, Muhammad Awais Asgha, Wahab Ali Gulzar Khawaja . Design and optimization of grid Integrated hybrid on-site energy generation system for rural area in AJK-Pakistan using HOMER software. AIMS Energy, 2021, 9(6): 1113-1135. doi: 10.3934/energy.2021051 |
[10] | Yassine Charabi, Sabah Abdul-Wahab . The optimal sizing and performance assessment of a hybrid renewable energy system for a mini-gird in an exclave territory. AIMS Energy, 2020, 8(4): 669-685. doi: 10.3934/energy.2020.4.669 |
Throughout history, Cyprus has experienced long periods of water scarcity. In recent years this phenomenon occurs more due to the climate change. The overexploitation of the underground water resources and the reduction of the level of the surface water resources have brought the water resources at a critical point. The result of these factors is the shift in the desalination solution, which, although a method proven and technologically mature, still requires large amounts of energy, which in its majority is produced from conventional, polluting power plants. By increasing the water needs, there is an increase in the energy needs which are required for the operation of desalination units, which increases the impact in the environment. The cogeneration of electricity and desalinated water(DSW)by concentrated solar power(CSP)technologies is an innovative approach for solving the above problems of water scarcity and energy production from sources which are not friendly to the environment.
The purpose of this work is to investigate whether the innovative CSP-DSW technology developed in [1,2], which, can be installed in hillside terrains with adequate thermal storage for 24/7 operation is economically feasible for power generation in the isl and of Cyprus. For the simulations, the IPP v2.1 software is used for calculating the electricity unit cost or benefit before tax from the selected CSP-DSW technologies [3]. For each scenario under investigation, the simulations take into account the capital cost, the fuel consumption and cost, the operation cost, the maintenance cost, the plant load factor and it calculates the electricity unit cost or benefit before tax, as well as the after tax internal rate of return(IRR) and the payback period(PBP).
Section 2, gives a brief description of the CSP-DSW technology, whereas in section 3, the optimization model used for the simulations, is described. Section 4, concerns the input data and assumptions used for the feasibility study while in section 5 the results for the integration of large scale CSP-DSW technologies in the Cyprus power generation system are discussed. Finally the conclusions are summarized in section 6.
The CSP-DSW technology utilizes solar energy to generate electricity. The heat collected from converting solar energy to thermal energy is used in a conventional power cycle to generate electricity. The main components of a CSP-DSW technology are the energy collection system, the receiver system, the thermal energy storage, the desalination unit and the typical components used in conventional power cycles(e.g., steam turbines and generators). The receiver system illustrated in Figure 1 suitable for hillside terrains converts the solar energy intercepted and reflected by the collection system into thermal energy. In systems with energy storage capabilities, the thermal energy in the receiver is first stored into a heat storage medium to manage the variations in the solar energy influx. The storage system may contain sufficient thermal energy to continue the power generation overnight, or during days with overcast weather. A heat transfer fluid(HTF), possibly different from the heat storage medium, transfers the energy from the storage medium to the steam generators in the power cycle.
The intensity of the solar energy received by the collectors is only a few kWh/m2/day. To achieve higher intensities and ultimately higher operating temperatures, CSP technologies are used. In CSP systems, the surface area from which the heat losses occur, i.e., the receiver aperture, is significantly less than the total surface area of the collectors. Heliostats positioned on a south-facing hill reflect the light directly onto the receiver atop the central tower. The energy can be concentrated as much as 1500 times that of the energy coming in from the sun. Energy losses from thermal energy transport are minimized as solar energy is being directly transferred by reflection from the heliostats to the receiver, rather than being moved through a transfer medium to one central receiver, as with parabolic troughs [4].
The receiver itself is designed to absorb the energy from the sunlight incident upon it and transfer it to a heat transfer fluid. Depending on system design, this heat transfer fluid may be water, a molten salt or air. In a molten-salt solar tower, liquid salt at 290 ºC is pumped from a ‘cold’ storage tank through the receiver where it is heated to 565 ºC and then on to a ‘hot’ tank for storage. When power is needed from the plant, hot salt is pumped to a steam generating system that produces superheated steam for a conventional Rankine cycle turbine-generator system. From the steam generator, the salt is returned to the cold tank where it is stored and eventually reheated in the receiver. The storage unit is designed so that the unit can operate for 24 hours at full capacity without additional energy from the sun. As a result, if there is a widespread lack of sunshine, such as during the night or on cloudy days, the unit can continue its normal operation [4].
Extraction turbines are assumed for the electricity generation. Process steam is extracted from the turbine at various pressures. The extracted steam can be used for heating the condensed steam in the steam cycle(through open or closed feed-water heaters) and seawater desalination(both optional). The heat collected at the lid is used for pre-heating the desalination feed-water [2]. For the desalination unit, the multi-effect distillation(MED)is preferred. The MED process consists of several consecutive stages(or effects)maintained at decreasing levels of pressure( and temperature), leading from the first(hot)stage to the last one(cold), as illustrated in Figure 2.
Each effect mainly consists of a multiphase heat exchanger. Seawater is introduced in the evaporator side and heating steam is introduced in the condenser side. As it flows down the evaporator surface, the seawater concentrates and produces brine at the bottom of each effect. The vapour raised by seawater evaporation is at a lower temperature than the vapour in the condenser. However, it can still be used as heating medium for the next effect where the process is repeated. The decreasing pressure from one effect to the next one allows brine and distillate to be drawn to the next effect where they will flash and release additional amounts of vapour at the lower pressure. This additional vapour will condense into distillate inside the next effect. In the last effect, the produced steam condenses on a conventional shell and tubes heat exchanger. This exchanger, called distillate condenser, is cooled by seawater. At the outlet of this condenser, one part of the warmed sea water is used as make-up water, while the other part is rejected to the sea. Brine and distillate are collected from effect to effect, up to the last one from where they are extracted by pumps [5].
Also, another alternative case of a receiver located on the ground [6], as illustrated in Figure 3, is examined. The advantages of utilizing ground-level receivers(made possible by hillsides)include the elimination of many significant costs and operating problems associated with tower systems, such as salt freezing in pipes, the capital cost and maintenance of high pressure pumps, and of course the capital cost of the tower. Additionally, terrain that is otherwise difficult to develop is suitable for hillside concentrated solar applications. As a result, the hillside heliostat field further decreases the capital cost relative to traditional CSP sites. A potential disadvantage of hillside sites is the increased cost of installing heliostats on a hillside terrain [6].
The solar receiver is the component that receives sunlight and converts it into heat. The heat is transferred through the HTF from the receiver to the storage unit, where it is accumulated for later use. The solar receiver to be used is the CSPonD design [5]. In this design, the receiver is a salt pond which also acts as the energy storage medium. The energy storage is designed such that the radiation heat losses from the salt are predominantly absorbed by a dome structure(the lid)covering the salt pond. The lid has an opening(the aperture)that the concentrated light passes through before it is absorbed by the salt pond [5].
Both the molten salt pond and the lid will exchange heat with each other and to the environment by radiation, convection and conduction; the primary heat transfer mechanism is through radiation. The system cover will be lined with refractory firebrick and backside cooled, so the salt vapor rises and condenses on the inner surface of the cover, akin to frost collecting on evaporator coils within a refrigerator. The resulting white surface will grow until the thickness results in a thermal resistance that condenses the salt vapor, but the surface continually melts and returns liquid salt to the pond. The liquid/solid interface is expected to act as a diffuse reflector to incoming light that reflects off the surface of the salt. Solidified salt has a very high reflectivity in the visible spectrum and behaves nearly as a Lambertian reflector. Liquefied salt will be subject to grazing- angle Fresnel surface reflections and as such, much of the light impinged onto the lid will be reflected back to the pond. The energy that is transferred to the lid is from lower-temperature, longer wavelength radiation from the salt surface. Only a small fraction of incoming photon energy is converted to thermal energy at the lid [2].
The top surface of the salt needs to remain at a constant level for consistent solar absorption; hence, the tank is split into two zones with a moving barrier plate. The top zone is the hot salt side, and the bottom zone is the cold salt side. An insulated creep and corrosion resistant alloy plate divides the two sides, providing a physical and thermal barrier between the thermally stratified hot and cold layers within the tank. The light will penetrate deeply and a small fraction of it will impact the highly absorbing divider plate causing convection currents, heating the hot side to a uniform high temperature. The near neutrally buoyant divider plate is moved axially by small actuators, with negligible power consumption, to maintain the hot and cold salt volumes required for continuous operation, as illustrated in Figure 4. As a result, high-temperature salt can be provided even as the average temperature in the tank decreases.
As the divider plate is lowered when the aperture is open and the tank is being heated by sunlight, colder salt from below moves past the annular clearance space between the barrier plate and tank wall to be reheated. Relative “blow-by” salt velocities are slow, accounting for the daily downward motion of the plate displacing fluid and pumped cold salt returning from the heat exchanger.
In order to calculate the financial indicators from the various c and idate CSP-DSW technologies, each plant operation is simulated using the IPP v2.1 software [3]. The software emerged from a continued research and development in the field of software development for the needs of power industry. This user-friendly software tool, the flowchart of which is given in Figure 5, can be used for the selection of an appropriate least cost power generation technology in competitive electricity markets. The software takes into account the capital cost, the fuel consumption and cost, the operation cost, the maintenance cost, the plant load factor, etc. All costs are discounted to a reference date at a given discount rate. Each run can h and le 50 different c and idate schemes simultaneously. Based on the above input parameters for each c and idate technology the algorithm calculates the least cost power generation configuration in real prices and the ranking order of the c and idate schemes [3].
The technical and economic parameters of each c and idate power generation technology are taken into account based on the cost function:
min(∂c∂k)=min{N∑j=0[∂CCj∂k+∂CFj∂k+∂COMFj∂k+∂COMVj∂k(1+i)j]N∑j=0[∂Pj∂k(1+i)j]} |
(1) |
where c is the final cost of electricity in €/kWh, in real prices, for the c and idate technology k, CCj is the capital cost function in €, CFj is the fuel cost function in €, COMFj is the fixed operation and maintenance(O&M)cost function in €, COMVj is the variable O&M cost function in €, Pj is the total electricity production in kWh, j=1, 2, …N is the periods(e.g., years)of installation and operation of the power generation technology and i is the discount rate. The least cost solution is calculated by:
leastcostsolution=min[∂c∂k] |
(2) |
During the simulations procedure the following financial feasibility indicators based on the individual case examined may be calculated:(a)electricity unit cost or benefit before tax(in €/kWh), (b)after tax cash flow(in €), (c)after tax NPV(net present value: the value of all future cash flows, discounted at the discount rate, in today’s currency), (d)after tax IRR(the discount rate that causes the NPV of the project to be zero and is calculated using the after tax cash flows. Note that the IRR is undefined in certain cases, notably if the project yields immediate positive cash flow in year zero) and (e)after tax PBP(the number of years it takes for the cash flow, excluding debt payments, to equal the total investment which is equal to the sum of debt and equity).
The main objective of this work is to investigate whether the installation of an innovative cogeneration of CSP-DSW technology in Cyprus is economically feasible. For the simulations, the IPP v2.1 software is used for calculating the electricity unit cost or benefit before tax from the selected CSP-DSW technologies. Other work related to the integration of large scale CSP plants in power generation systems can be found in [4,7,8,9,10,11].
The following generating technologies have been examined, (a)CSP-DSW technology 4 MWe, (b)CSP-DSW technology 10 MWe, (c)CSP-DSW technology 25 MWe and (d)CSP-DSW technology 50 MWe with or without CO2 trading and for two cases of electricity purchasing tariff. For each scenario under investigation, the simulations take into account the capital cost, the fuel consumption and cost, the operation cost, the maintenance cost, the plant load factor and it calculates the electricity unit cost or benefit before tax, as well as the after tax IRR and the PBP.
For all scenarios only the infrastructure required to operate the power block section is considered in the simulations. Therefore, only 80% of the total CSP-DSW plant specific capital cost and variable O&M cost is considered, assuming that the remaining 20% is required to operate the desalination unit and is not considered in this work. Regarding fixed O&M cost, 91% of the total CSP-DSW plant fixed O&M cost is considered. Furthermore, the capacity factor of the power block section is also 80% of the total capacity factor of the CSP-DSW plant.
In order to compare on equal basis the electricity unit cost or benefit before tax from the selected CSP-DSW technologies, the technical and economic input data and assumptions tabulated in Table. 1 and Table. 2 are used. For all scenarios, the capacity factor of the plant varies from 70-90%, in steps of 10%, due to the fact that for the CSP-DSW technologies it is assumed 24 h of full daily operation. As mentioned above, the capacity factor of the power block section is 80% of the capacity factor of the CSP-DSW plant. Therefore, capacity factors of 56%, 64% and 72% are used for the power block section for all scenarios, to reflect plant capacity factors of 70%, 80% and 90%.
Scenario | Capacity(MWe) | Efficiency(%) | Capacity Factor(%) |
CSP-DSW 4 MWe | 4 | 9.62 | 70-90 |
CSP-DSW 10 MWe | 10 | 11.9 | 70-90 |
CSP-DSW 25 MWe | 25 | 14.8 | 70-90 |
CSP-DSW 50 MWe | 50 | 17.0 | 70-90 |
Scenario | Specific Capital Cost(€/kWe) | Fixed O&M(€/kWe/month) | Capacity Factor(%) | Variable O&M(€/MWh) |
CSP-DSW 4 MWe | 5646 | 12.73 | 56 | 48.18 |
64 | 42.16 | |||
72 | 37.47 | |||
CSP-DSW 10 MWe | 5090 | 8.05 | 56 | 34.96 |
64 | 30.59 | |||
72 | 27.19 | |||
CSP-DSW 25 MWe | 3364 | 5.09 | 56 | 25.37 |
64 | 22.20 | |||
72 | 19.73 | |||
CSP-DSW 50 MWe | 2795 | 3.60 | 56 | 19.90 |
64 | 17.42 |
For the scenarios, a small plant of 4 MWe, a small to medium plant of 10 MWe, a medium plant of 25 MWe and a large plant of 50 MWe, are used with efficiencies that vary from 9.62% for the small plant up to 17% for the large plant.
Regarding the economic input data, the capital cost is assumed to be reduced from 5646€/kWe for the 4 MWe scenario to 2795€/kWe for the 50 MWe scenario. The fixed O&M cost, which includes staff salaries, insurance charges and fixed maintenance, is assumed to be reduced from 12.73€/kWe/month for the 4 MWe scenario to 3.60€/kWe/month for the 50 MWe scenario. As for the variable O&M cost, which includes spare parts, chemicals, oils, consumables and town water and sewage, is assumed to decrease from 37.47€/MWh for the 4 MWe scenario with capacity factor 72% to 15.48€/MWh for the 50 MWe scenario with the same capacity factor.
For the environmental benefit of the plants from the CO2 emissions trading system(ETS), two cases are examined for all scenarios, (a)the CO2 ETS price of 10€/tCO2 and (b)the CO2 ETS price of 0€/tCO2. Also, in order to calculate the financial feasibility indicators, two cases of electricity purchasing tariff are examined for all scenarios, (a)the current feed-in tariff for a CSP plant of 26€c/kWh and (b)the renewable energy sources for power generation(RES-E)purchasing tariff [12] for June 2013(for a fuel price of 572.95€/MT and connection at 132 kV/66 kV)of 12.83€c/kWh, as illustrated in Figure 6. Also, the economic life of the plants is assumed at 20 years. Throughout the simulations, a typical discount rate of 6% and an annual tax rate of 10% are assumed.
In order to compare on equal basis the electricity unit cost or benefit before tax from the selected CSP-DSW technologies, sixteen scenarios have been examined, which include the two cases of CO2 ETS price and the two cases of electricity purchasing tariff. For each scenario under investigation, the simulations took into account the capital cost, the fuel consumption and cost, the operation cost, the maintenance cost, the plant load factor, etc. For each scenario, the electricity unit cost or benefit before tax, as well as after tax IRR and PBP are calculated.
The results obtained concerning the electricity unit cost benefit, which is the difference between the electricity purchasing tariff minus the electricity production cost of the plant, for electricity purchasing tariff of 26€c/kWh for all scenarios in respect to the capacity factor of the plants, are illustrated in Figure 7.
It can be observed that the electricity unit cost benefit, which is the profit before tax in €c for every kWh produced by the CSP-DSW plant and delivered to the grid, increases with the increase of the capacity factor and the capacity size of the plant. Also, it can be observed that the additional benefit due to the CO2 ETS price of 10€/tCO2 for all scenarios is 0.8€c/kWh. Specifically, for the CSP-DSW of 4 MWe with no CO2 trading scenario and for capacity factors of the power block section of 56%, 64% and 72%, the electricity unit cost benefit is 8.03€c/kWh, 10.28€c/kWh and 12.03€c/kWh respectively. For the CSP-DSW of 4 MWe with CO2 trading, scenario and for capacity factors of 56%, 64% and 72%, the electricity unit cost benefit is 8.83€c/kWh, 11.08€c/kWh and 12.83€c/kWh respectively.
The after tax IRR and the PBP for each scenario are illustrated in Figure 8 and Figure 9 respectively. Specifically, for the CSP-DSW of 4 MWe with no CO2 trading scenario and for capacity factors of 56%, 64% and 72%, the after tax IRR is 12.88%, 16.19% and 19.36%, respectively. For the CSP-DSW of 4 MWe with CO2 trading, scenario and for capacity factors of 56%, 64% and 72%, the after tax IRR is 13.60%, 16.98% and 20.22% respectively. Concerning the after tax PBP results, it is observed that for the CSP-DSW of 4 MWe with no CO2 trading scenario and for capacity factors of 56%, 64% and 72%, the after tax PBP is almost 7 years, 6 years and 5 years respectively. For the CSP-DSW of 4 MWe with CO2 trading, scenario and for capacity factors of 56%, 64% and 72%, the after tax PBP is almost 6.8 years, 5.6 years and 4.8 years respectively. From these results, for the electricity purchasing tariff of 26€c/kWh case, it is obvious that the investment in CSP-DSW technology for every capacity size is very attractive.
For the electricity purchasing tariff of 12.83€c/kWh case, the electricity unit cost benefit for all scenarios is illustrated in Figure 10. It is observed that for this case for capacity sizes of 25 MWe and 50 MWe CSP-DSW plants, with or without CO2 trading, although there is benefit for every capacity factor, this is lower than the lowest benefit observed from the previous case of electricity purchasing tariff. Especially, for capacity size of 10 MWe and 4 MWe with or without CO2 trading, for some capacity factors, there is cost and not benefit. Specifically, for the CSP-DSW of 25 MWe with no CO2 trading scenario and for capacity factors of 56%, 64% and 72%, the electricity unit cost benefit is 3.07€c/kWh, 4.29€c/kWh and 5.24€c/kWh respectively. For the CSP-DSW of 25 MWe with CO2 trading, scenario and for capacity factors of 56%, 64% and 72%, the electricity unit cost benefit is 3.87€c/kWh, 5.09€c/kWh and 6.04€c/kWh respectively.
Despite the lower electricity unit cost benefit in the case of this electricity purchasing tariff, after a certain capacity size the investment in CSP-DSW technology is still attractive, as illustrated in Figure 11. Assuming that a commercially attractive after tax IRR of a CSP-DSW project should be higher than 10%, CSP-DSW plants with capacity sizes 25 MWe and 50 MWe, with or without CO2 trading, are satisfying this boundary.
The results obtained for the after tax PBP for the electricity purchasing tariff of 12.83€c/kWh case are illustrated in Figure 12. It can be observed that for the CSP-DSW of 25 MWe with no CO2 trading scenario and for capacity factors of 56%, 64% and 72%, the after tax PBP is almost 8.4 years, 7 years and 6 years respectively. For the CSP-DSW of 25 MWe with CO2 trading, scenario and for capacity factors of 56%, 64% and 72%, the after tax PBP is almost 7.7 years, 6.5 years and 5.5 years respectively.
In this work, an investigation whether the installation of an innovative cogeneration of CSP-DSW technology in Cyprus is economically feasible, was carried out. In order to compare on equal basis the electricity unit cost or benefit before tax from the selected CSP-DSW technologies, sixteen scenarios have been examined, including two cases of CO2 ETS price and two cases of electricity purchasing tariff. For each scenario under investigation, the simulations took into account the capital cost, the fuel consumption and cost, the operation cost, the maintenance cost, the plant load factor, etc. For each scenario, the electricity unit cost or benefit before tax, which is the difference between the electricity purchasing tariff minus the electricity production cost of the plant, as well as, the after tax IRR and the PBP were calculated.
The results indicated that the electricity unit cost or benefit for both cases of electricity purchasing tariff were decreased or increased with the increase of the capacity factor and the capacity size of the plant. Also, the additional benefit due to the CO2 ETS price of 10€/tCO2 for all scenarios was 0.8€c/kWh. Specifically, for the electricity purchasing tariff of 26€c/kWh case, the investment in CSP-DSW technology for every capacity size was very attractive, since, the CSP-DSW scenarios had high after tax IRR and low PBP.
Despite the lower electricity unit cost benefit in the case of electricity purchasing tariff of 12.83€c/kWh compared to that of the 26€c/kWh case, which in some cases there was cost and not benefit, for CSP-DSW plants of 25 MWe and 50 MWe, the investment in this technology was still attractive.
The relevant cost or economic benefit from the production of desalinated water is currently under investigation.
This work has been partially funded by the Cross-Border Cooperation Programme Greece-Cyprus 2007-2013, Contract No: k1_1_10.
All authors declare no conflicts of interest in this paper.
[1] | Solar thermal production of electricity and water (STEP-EW) official website. Available from: http://www.step-ew.eu/. |
[2] | Slocum A, Codd D, Buongiorno, et al. (2011) Concentrated solar power on demand. Sol Energy 85: 1519-1529. |
[3] | Poullikkas A (2009) A decouple optimization method for power technology selection in competitive markets. Energ Source 4: 199-211. |
[4] | Poullikkas A, Rouvas C, Hadjipaschalis I, et al. (2012) Optimum sizing of steam turbines for concentrated solar plants. Int J Energ Environ 3: 9-18. |
[5] | Ghobeity A, Noone C, Papanicolas C, et al. (2011) Optimal time-invariant of a power and water cogeneration solar-thermal plant. Sol Energy 85: 2295-2320. |
[6] | Noone C, Ghobeity A, Slocum A, et al. (2011) Site selection for hillside central receiver solar thermal plants. Sol Energy 85: 839-848. |
[7] | Poullikkas A (2009) Economic analysis of power generation from parabolic trough solar thermal plants for the Mediterranean region—A case study for the island of Cyprus. Renew Sust Energ Rev 13: 2474-2484. |
[8] | Poullikkas A, Hadjipaschalis I, Kourtis G (2010) The cost of integration of parabolic trough CSP plants in isolated Mediterranean power systems. Renew Sust Energ Rev 14: 1469-1476. |
[9] | Poullikkas A, Kourtis G, Hadjipaschalis I (2010) Parametric analysis for the installation of solar dish technologies in Mediterranean regions. Renew Sust Energ Rev 14: 2772-2783. |
[10] | Klaiv H, Kohne R, Nitsch J, et al. (1995) Solar thermal power plants for solar countries—technology, economics and market potential. Appl Energ 52: 165-183. |
[11] | Shinnar R, Citro F (2007) Solar thermal energy: the forgotten energy source. Technol Soc 29: 261-270. |
[12] | The renewable energy sources for power generation purchasing tariff. Available from: http://www.eac.com.cy/. |
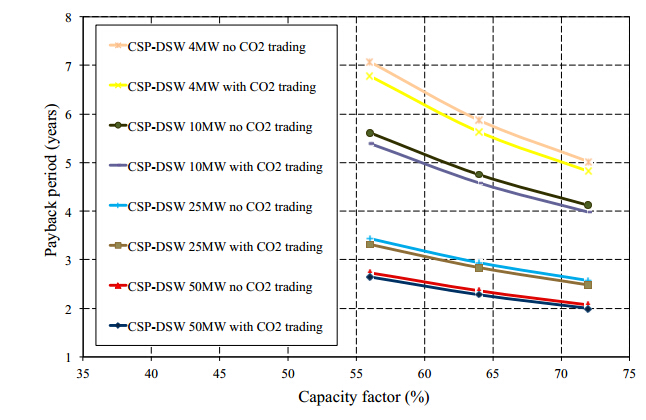
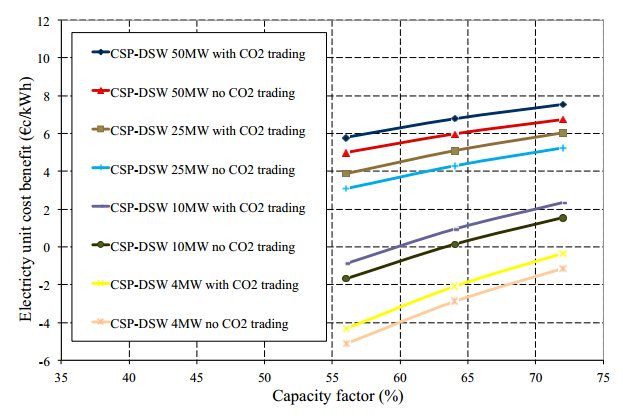
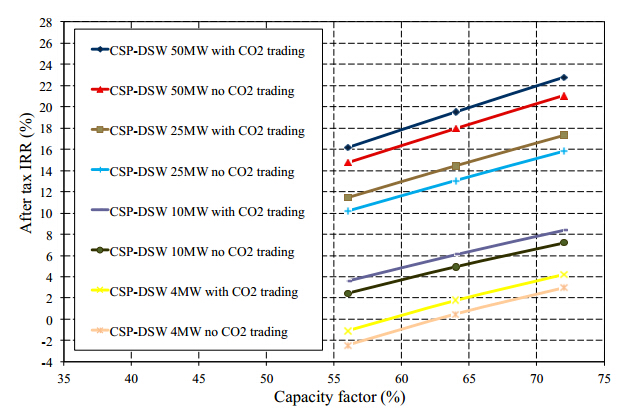
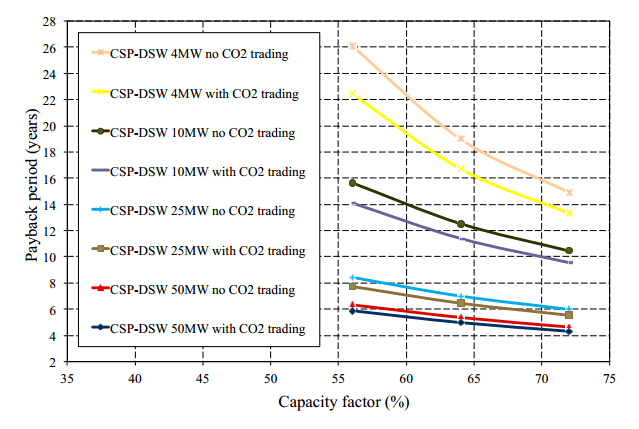
Scenario | Capacity(MWe) | Efficiency(%) | Capacity Factor(%) |
CSP-DSW 4 MWe | 4 | 9.62 | 70-90 |
CSP-DSW 10 MWe | 10 | 11.9 | 70-90 |
CSP-DSW 25 MWe | 25 | 14.8 | 70-90 |
CSP-DSW 50 MWe | 50 | 17.0 | 70-90 |
Scenario | Specific Capital Cost(€/kWe) | Fixed O&M(€/kWe/month) | Capacity Factor(%) | Variable O&M(€/MWh) |
CSP-DSW 4 MWe | 5646 | 12.73 | 56 | 48.18 |
64 | 42.16 | |||
72 | 37.47 | |||
CSP-DSW 10 MWe | 5090 | 8.05 | 56 | 34.96 |
64 | 30.59 | |||
72 | 27.19 | |||
CSP-DSW 25 MWe | 3364 | 5.09 | 56 | 25.37 |
64 | 22.20 | |||
72 | 19.73 | |||
CSP-DSW 50 MWe | 2795 | 3.60 | 56 | 19.90 |
64 | 17.42 |