Citation: Miguel García-Tecedor, Félix del Prado, Carlos Bueno, G. Cristian Vásquez, Javier Bartolomé, David Maestre, Tomás Díaz, Ana Cremades, Javier Piqueras. Tubular micro- and nanostructures of TCO materials grown by a vapor-solid method[J]. AIMS Materials Science, 2016, 3(2): 434-447. doi: 10.3934/matersci.2016.2.434
[1] | Elyas Elyasiani, Luca Gambarelli, Silvia Muzzioli . The Information Content of Corridor Volatility Measures During Calm and Turmoil Periods. Quantitative Finance and Economics, 2017, 1(4): 454-473. doi: 10.3934/QFE.2017.4.454 |
[2] | Chikashi Tsuji . The meaning of structural breaks for risk management: new evidence, mechanisms, and innovative views for the post-COVID-19 era. Quantitative Finance and Economics, 2022, 6(2): 270-302. doi: 10.3934/QFE.2022012 |
[3] | Tetsuya Takaishi . Volatility estimation using a rational GARCH model. Quantitative Finance and Economics, 2018, 2(1): 127-136. doi: 10.3934/QFE.2018.1.127 |
[4] | Lorna Katusiime . Time-Frequency connectedness between developing countries in the COVID-19 pandemic: The case of East Africa. Quantitative Finance and Economics, 2022, 6(4): 722-748. doi: 10.3934/QFE.2022032 |
[5] | Raéf Bahrini, Assaf Filfilan . Impact of the novel coronavirus on stock market returns: evidence from GCC countries. Quantitative Finance and Economics, 2020, 4(4): 640-652. doi: 10.3934/QFE.2020029 |
[6] | Wolfgang Schadner . Forward looking up-/down correlations. Quantitative Finance and Economics, 2021, 5(3): 471-495. doi: 10.3934/QFE.2021021 |
[7] | Keyue Yan, Ying Li . Machine learning-based analysis of volatility quantitative investment strategies for American financial stocks. Quantitative Finance and Economics, 2024, 8(2): 364-386. doi: 10.3934/QFE.2024014 |
[8] | Mitchell Ratner, Chih-Chieh (Jason) Chiu . Portfolio Effects of VIX Futures Index. Quantitative Finance and Economics, 2017, 1(3): 288-299. doi: 10.3934/QFE.2017.3.288 |
[9] | Mehmet F. Dicle . US Implied Volatility as A predictor of International Returns. Quantitative Finance and Economics, 2017, 1(4): 388-402. doi: 10.3934/QFE.2017.4.388 |
[10] | Mehmet F. Dicle, John D. Levendis . Hedging Market Volatility with Gold. Quantitative Finance and Economics, 2017, 1(3): 253-271. doi: 10.3934/QFE.2017.3.253 |
Undoubtedly, there are extremely more 'bad' than 'good' news during the bear market periods. Nelson (1991) points out that researchers beginning with Black (1976) have found the evidence that stock returns are negatively correlated with changes in returns volatility, i.e. volatility tends to rise in response to 'bad news' (excess returns lower than expected) and to fall in response to 'good news' (excess returns higher than expected).
The purpose of this paper is to investigate the asymmetric impact of innovations on volatility in the case of three largest European stock markets in the UK, France and Germany, using univariate EGARCH approach (Nelson, 1991). We try to deal with the 'nonsynchronous trading effect Ⅱ' (Olbrys, 2013a) by using a 'common trading window' procedure and estimating suitable EGARCH models based on daily percentage logarithmic returns for the major European stock market indexes: FTSE100 (London), CAC40 (Paris) and DAX (Frankfurt). The main goal is to obtain an overlapping information set in the case of all markets, as we plan to test the impact of common 'bad' and 'good' news. We compare empirical results for the whole sample period from January 2,2003 to December 30,2016 and three adjacent subsamples, each of equal size: 1) the pre-crisis, 2) the Global Financial Crisis (GFC) and 3) the post-crisis periods. The impact of 'bad' and 'good' news is described in terms of univariate EGARCH models. We observe pronounced negative asymmetry effects in the case of all investigated markets and the results turn out to be robust to the choice of the period.
The remainder of the study is organized as follows. Section 2 specifies a methodological background and a brief literature review. First, we stress the validity of nonsynchronous trading problems. Next, we use a formal statistical procedure of dividing market states into bullish and bearish markets to detect 'down market' (crisis) periods in the analyzed countries. A brief theoretical framework concerning EGARCH (p, q) models is also presented. In Section 3, we describe the data and discuss empirical results of the asymmetric impact of innovations on volatility in the group of investigated markets. Conclusion recalls the main findings and sums them up.
According to the literature, one can distinguish between two nonsynchronous trading effect problems (Olbrys, 2013a). The first problem, called 'nonsynchronous trading effect Ⅰ', occurs when we analyze one selected domestic stock market. Stock tradings do not occur in a synchronous manner. Different stocks have different trading frequencies and even for a single stock the trading intensity varies from hour to hour and from day to day. The actual time of last transaction of the stock varies from day to day. As such we incorrectly assume daily returns as an equally spaced time series with a 24-hour interval (Tsay, 2010). The non-trading effect induces potentially serious biases in the moments and co-moments of asset returns such as their means, variances, covariances, betas, autocorrelation and cross-autocorrelation coefficients (Campbell et al., 1997). The second and potentially serious problem, called 'nonsynchronous trading effect Ⅱ', occurs when we examine the relations between stock markets in various countries. The national stock markets are operating in diverse time zones with different opening and closing times, thereby making return observations nonsynchronous (Eun and Shim, 1989; Olbrys, 2013a). These differences arise naturally from the fact that trading days in different countries are subject to different national and religious holidays, unexpected events and so forth (Baumöhl and Výrost, 2010).
In this paper, we investigate the asymmetric impact of innovations on volatility in the case of three largest European stock markets in the UK, France and Germany. Therefore, we have to deal with the 'nonsynchronous trading effect Ⅱ'. Many studies attempted various methods to deal with this problem. Some researchers use weekly or monthly data to avoid the non-trading effect. Such solutions, however, may lead to small sample sizes and cannot capture the information transmission in shorter (daily) timeframes (Baumöhl and Výrost, 2010). Other papers present various daily data-matching procedures. We employ the following approach, also called a 'common trading window': the data are collected for the same dates across the stock markets, removing the data for those dates when any series has a missing value due to no trading (Eun and Shim, 1989; Booth et al., 1997; Olbrys, 2013a; Olbrys and Majewska, 2014b). It is important to note that the use of a wide range of time-series models could be questionable if non-synchronicities are not accounted for, especially because the current implementations of these models in most econometric software inherently assume synchronous data.
Direct quantitative identification of crisis periods is possible based on statistical procedures of dividing market states into bullish and bearish markets. Fabozzi and Francis (1977) stress that no just one definition of bull and bear markets exists. Therefore, they proposed three alternative definitions of bull and bear market conditions. The first categorization was based on market trends. The second partitioning procedure ignored market trends and viewed the market portfolio return every month independently. The third procedure partitioned the sample into three subsets: (1) months when the market moved up substantially, (2) months when the market moved down substantially and (3) months when the market moved neither up nor down substantially. Substantial moves were arbitrarily defined as months when the absolute value of market return was larger than half of one standard deviation of the market returns measured over the total sampled period (Fabozzi and Francis, 1977).
Pagan and Sossounov (2003) developed an algorithm that seemed to be successful in locating periods in time that were considered bull and bear markets in U.S. equity prices. They tested monthly data of the New York market index-S & P500, in the period from January 1835 to May 1997. Lee et al. (2011) use a modified version of the Pagan and Sossounov (2003) method of dividing market states into bullish and bearish markets. They analyze the Taiwanese market, in the period from January 1997 to December 2007. Lee et al. (2011) point out that investors usually cannot identify the present market state and they often refer to past market states as they make investment decisions.
We employ a three-stage procedure of dividing market states into up and down markets. Our methodology builds on Pagan and Sossounov (2003). In the first step, we conduct a preliminary identification of turning points, i.e., peaks and troughs, based on the conditions (1)–(2), respectively:
$ \ln {P_{t - 8}}, \ldots ,\ln {P_{t - 1}} < \ln {P_t} > \ln {P_{t + 1}}, \ldots ,\ln {P_{t + 8}} $ | (1) |
$ \ln {P_{t - 8}}, \ldots ,\ln {P_{t - 1}} > \ln {P_t} < \ln {P_{t + 1}}, \ldots ,\ln {P_{t + 8}} $ | (2) |
where Pt represents the market index of month t, and from successive peaks/troughs we choose the highest/deepest one, respectively. Pagan and Sossounov (2003) stress that in the business cycle literature an algorithm for describing turning points in time series was developed by Bry and Boschan (1971), but they modified this algorithm by taking the eight months window (instead of six) in marking the initial location of turning points. The main goal was not to smooth any of the monthly, already smoothed, data. In the second step, we rule out the phases (peak-trough or trough-peak) that last for less than four months and cycles (peak-trough-peak or trough-peak-trough) that last for less than sixteen months. Pagan and Sossounov (2003) point out that in business cycle dating the minimal cycle length is fifteen months, hence sixteen months were chosen to create a symmetric window of eight periods. Moreover, they advocated four months as the minimal length of a phase.
In the last step we calculate the amplitudes A for each phase (amplitude is the difference in the natural logs of the index value in subsequent turning points). During the bull/bear market period there must be a large enough (of at least 20%) rise/fall in the index value (Pagan and Sossounov, 2003). This means that the amplitude of a given phase must fulfill the condition A ≥ 0.18 or A ≤ -0.22 for the bull or bear market period, respectively. Indeed, if a growth of the index value in an up market period will equal at least to 20%, then (Olbrys and Majewska, 2014a):
$ A =\ln {P_{t + 1}} - \ln {P_t} =\ln \frac{{{P_{t + 1}}}}{{{P_t}}} > \ln \frac{{1.2 \cdot {P_t}}}{{{P_t}}} =\ln 1.2 \approx 0.18 $ | (3) |
By analogy, if a decline of the index value in a down market period will equal at least to 20%, then:
$ A =\ln {P_{t + 1}} - \ln {P_t} =\ln \frac{{{P_{t + 1}}}}{{{P_t}}} < \ln \frac{{0.8 \cdot {P_t}}}{{{P_t}}} =\ln 0.8 \approx - 0.22 $ | (4) |
The data consists of monthly logarithmic returns of three major developed European stock market indexes: FTSE100, CAC40 and DAX. Figures 1–3 present down market periods for the market indexes obtained from the procedure described above, in the whole sample from January 2003 to December 2016. The horizontal axis stands for time (months), and the vertical axis stands for the market index. Vertical lines and light grey areas stand for down market periods.
The obtained results reveal that October 2007—February 2009 was the Global Financial Crisis (GFC) period for the stock market in London. The GFC period for the Paris stock exchange was longer and it lasted from May 2007 to February 2009, while the crisis period for the Frankfurt stock market was shorter and it lasted from December 2007 to February 2009. Our results confirm February 2009 as the end of down markets in all investigated countries (Olbrys and Majewska, 2014a). The precise identification of market states is certainly important in practice, as many researchers found that profits to investment strategies depend critically on the state of the market. Moreover, it is instructive to formally identify crises, as it enables the examination of various relationships among international stock markets, taking into consideration the pre-, post-and crisis periods (Olbryś and Majewska, 2015).
Many researchers documented that stock return volatility tends to rise following 'good' and 'bad' news. This phenomenon was noted both for individual stocks and for market indexes (Braun et al., 1995). Since Nelson (1991) introduced the univariate Exponential Generalized Autoregressive Conditionally Heteroskedastic (EGARCH) model, some researchers employ this model to capture the asymmetric effect of innovations on volatility. Engle and Ng (1993) stress that the main advantage of EGARCH model is that it allows 'good' news and 'bad' news to have a different impact on volatility, while the standard GARCH model does not.
Several studies present various applications of univariate and multivariate EGARCH models. Koutmos and Booth (1995) investigate the transmission mechanism of price and volatility spillovers across the New York, Tokyo and London stock markets from three different time zones, using the EGARCH approach. Jane and Ding (2009) propose the multivariate extension of Nelson's univariate EGARCH model and compare their model with the existing one given by Koutmos and Booth (1995). Booth et al. (1997) provide the evidence on price and volatility spillovers among four Scandinavian (Nordic) stock markets. Bhar (2001) applies an extended bivariate EGARCH model to provide evidence of linkages between the equity market and the index futures market in Australia. Reyes (2001) examines volatility transfers between size–based indexes from the Tokyo Stock Exchange, using a bivariate EGARCH model. Tse et al. (2003) employ a bivariate EGARCH model that allows for both mean and variance spillovers between the US and Polish stock markets. Yang and Doong (2004) adopt a bivariate EGARCH framework to investigate price and volatility spillovers between stock prices and exchange rates in the group of the G-7 countries. Balaban and Bayar (2005) test the relationship between stock market returns and their forecast volatility derived from the symmetric and asymmetric GARCH-type models in 14 countries. Bhar and Nikolova (2009) investigate the level of integration and the dynamic relationship between the BRIC countries (i.e. Brazil, Russia, India and China) using bivariate EGARCH framework. Curto et al. (2009) employ the MSV-EGARCH specification to explore links between stock market returns, volatility and treading volume in the case of six major international stock market indexes. Lee and Stewart (2010) examine asymmetric effects on volatility in the case of the Baltic and Nordic major stock indexes, using both univariate and multivariate EGARCH models. Olbrys (2013a) investigates the interdependence of price volatility across the US developed stock market and two emerging Central and Eastern European (CEE) markets in Warsaw and Budapest using a multivariate modified EGARCH model. Abbas et al. (2013) analyze volatility transmission from one market to another in the case of selected Asian stock markets in Pakistan, China, Sri Lanka and India, as well as developed equity markets in the US, UK, Japan and Singapore. The authors employ bivariate EGARCH model and results show that volatility transmission is present especially between friendly countries in different regions with economic links. Kuttu (2014) uses MVAR-EGARCH model to examine the return and volatility dynamics between thin-traded adjusted equity returns from Ghana, Kenya, Nigeria, and South Africa. Dedi and Yavas (2016) explore linkages between equity market returns and volatility spillovers in the UK, Germany, China, Russia, and Turkey. They apply EGARCH model among various GARCH methodologies.
The asymmetric effects of innovations on volatility for one selected domestic stock market could be well described by the univariate EGARCH model (Olbryś, 2013b) although it is now widely accepted that a multivariate modeling framework (in the case of the group of markets) leads to more relevant empirical models than working with separate univariate models (Bauwens et al., 2006). But it is worth stressing that a multivariate EGARCH model estimation is particularly difficult due to the large number of estimated parameters, especially when we use a sample of a relatively small size.
The univariate time series $\{ {R_t}\} $ can be expressed as:
$ {R_t} ={\mu _t} + {\varepsilon _t}, $ | (5) |
where: ${\sigma _t} =Var({R_t}\left| {{F_{t -1}})} \right.$ is the conditional expectation of ${R_t}$ given the past information ${F_{t -1}}$, ${\varepsilon _t}$ is the innovation of the series at time t.
Nelson's univariate EGARCH (p, q) model can be represented as follows (Tsay, 2010):
$
$
|
(6) |
$ g({z_t}) =\theta \cdot {z_t} + \gamma \cdot {\rm{[}}\left| {{z_t}} \right| - E(\left| {{z_t}} \right|){\rm{]}}, $ | (7) |
where: ${\sigma _t} =Var({R_t}\left| {{F_{t -1}})} \right.$ is the conditional variance of ${R_t}$ given the past information ${F_{t -1}}$, ${\alpha _0}$ is a constant, B is the back-shift (or lag) operator such that $Bg({z_t}) =g({z_{t -1}})$, $1 + {\beta _1}B + \cdots + {\beta _{q -1}}{B^{q -1}}$ and $1 -{\alpha _1}B -\cdots -{\alpha _p}{B^p}$ are polynomials with zeros outside the unit circle and have no common factors.
The value of $g({z_t})$ depends on several elements. Nelson (1991) points out that to accommodate the asymmetric relation between stock returns and volatility changes, the value of $g({z_t})$ must be a function of both the magnitude and the sign of ${z_t}$. In Eq. (7), $g({z_t})$ is a linear combination of ${z_t}$ and $[\left| {{z_t}} \right| -E(\left| {{z_t}} \right|)]$ with coefficients $\theta $ and $\gamma $. The term in the bracket measures the magnitude effects and the coefficient $\gamma $ relates lagged standardized innovations to volatility in a symmetric way. The term $\theta \cdot {z_t}$ measures the sign effects and the coefficient $\theta $ relates standardized shocks to volatility in an asymmetric style. ${\{ g({z_t})\} _{t =-\infty, \infty }}$ is an i.i.d. random sequence with mean zero (Jane and Ding 2009). For $\theta < 0$ the future conditional variances will increase proportionally more as a result of a negative shock than for a positive shock of the same absolute magnitude (Bollerslev and Mikkelsen 1996). Both ${z_t}$ and $[\left| {{z_t}} \right| -E(\left| {{z_t}} \right|)]$ are zero mean i.i.d. random sequences with continuous distributions. The asymmetry of $g({z_t})$ can be easily seen by rewriting it as:
$
g({z_t}) =\left\{ { } \right.
$
|
(8) |
Since EGARCH (p, q) =EGARCH(1, 1) is a simple case, Eq. (6) becomes:
$ (1 - {\alpha _1}B) \cdot \ln (\sigma _t^2) =(1 - {\alpha _1}B) \cdot {\alpha _0} + g({z_{t - 1}}), $ | (9) |
Eq. (9) can be rewritten (subscript of ${\alpha _1}$ is omitted) and then:
$ \ln (\sigma _t^2) =\alpha _0^* + \alpha \cdot \ln (\sigma _{t - 1}^2) + g({z_{t - 1}}), $ | (10) |
where $\alpha _0^* =const$.
The parameter α in Eq. (10) determines the influence of the past conditional volatility on the current conditional volatility. For the conditional volatility process to be stationary, $\left| \alpha \right| < 1$ is required. The persistence of volatility may be also quantified by examination of the half–life (HL) defined by:
$ HL =\frac{{\ln (0.5)}}{{\ln \left| \alpha \right|}} $ | (11) |
which measures the time period required for the innovations to be reduced to one–half of their original size.
Let ${R_{i, t}}$ be the percentage logarithmic return at time t for market i (i = 1, 2, 3, where 1 = London, 2 = Paris, and 3 = Frankfurt). Then, the univariate AR (1)–EGARCH (1, 1) model for market i may be written as follows:
$
$
|
(12) |
The data consists of daily percentage logarithmic returns for major stock market indexes for London (FTSE100 index), Paris (CAC40 index), and Frankfurt (DAX index). As mentioned in Introduction, the goal was to obtain the overlapping information set in the case of all markets, as we planned to test the impact of common 'bad' and 'good' news. We used the 'common trading window' procedure and removed the data for those dates when any series has a missing value due to no trading (Olbrys and Majewska, 2014b). Thus all the data are collected for the same dates across three markets and finally there are 3509 observations for each series for the period beginning January 2,2003 and ending December 30,2016. It is worth stressing that the reduction in the number of observations is not substantial, as the group of markets is small (Olbrys and Majewska, 2014b). Table 1 reports summarized statistics for daily percentage logarithmic returns for three stock indexes (in order of decreasing value of market capitalization at the end of 2015), as well as statistics testing for normality and interdependence.
Several results in Table 1 are worth special notice. The sample means are not statistically different from zero. The measure for skewness shows that the FTSE100 return series is negatively and significantly skewed, while the measure for excess kurtosis shows that all return series and highly leptokurtic with respect to the normal distribution. The Doornik-Hansen (2008) test rejects normality for each of the return series at the 5 per cent level of significance. The Ljung-Box (1978) statistic at the lag q≈lnT, where T is the number of data points (Tsay, 2010), calculated for both the return and the squared return series, indicates the presence of significant linear and non-linear dependencies, respectively. The linear dependences may be due to the 'nonsynchronous trading effect Ⅰ' of the stocks that make up each index (Campbell et al., 1997). The non–linear dependences may be due to the autoregressive conditional heteroskedasticity (Nelson, 1991; Koutmos and Booth, 1995; Booth et al., 1997). Calculations have been conducted using the open-source computer software Gretl 1.10.1 (Adkins, 2014).
Index | Market Cap. EUR Billion, Dec 2015 | Mean | St. Dev. | Skewness | Excess kurtosis | Doornik-Hansen test | LB(8) | LB2(8) | |
1 | FTSE100 | 3009.5 | 0.017 | 1.169 | -0.119 [0.004] | 7.722 [0.000] | 2547.86 [0.000] | 46.81 | 2020.92 |
2 | CAC40 | 1911.2 | 0.014 | 1.432 | -0.009 [0.822] | 5.909 [0.000] | 1803.01 [0.000] | 37.20 | 1234.00 |
3 | DAX | 1781.6 | 0.039 | 1.428 | -0.015 [0.714] | 5.239 [0.000] | 1529.57 [0.000] | 18.54 | 1102.94 |
Source: Authors' calculations and http://sdw.ecb.europa.eu. Notes: The table is based on all sample observations during the period January 2,2003–December 30,2016. The test statistic for skewness and excess kurtosis is the conventional t-statistic. The |
To examine asymmetric effects between positive and negative index return innovations, we first estimate the univariate AR (1)–EGARCH (1, 1) models of three stock indexes: FTSE100 (London), CAC40 (Paris) and DAX (Frankfurt), in the whole sample period from January 2,2003 to December 30,2016. The robust QML (Bollerslev and Wooldridge, 1992) estimates of the parameters of the model (12) are presented in Table 2.
London (i=1) | Paris (i=2) | Frankfurt (i=3) | |
The distribution for the innovations (the best fitted model) | skewed t | skewed t | skewed t |
Conditional mean equation | |||
${\varphi _{i, 0}}$ | 0.006 (0.013) | 0.007 (0.017) | 0.035 (0.019) |
${\varphi _i}$ | -0.040* (0.017) | -0.051* (0.016) | -0.014 (0.025) |
Conditional variance equation | |||
$\alpha _{i, 0}^*$ | -0.103* (0.015) | -0.072* (0.010) | -0.089* (0.010) |
${\alpha _i}$ | 0.981* (0.004) | 0.977* (0.005) | 0.979* (0.004) |
${\theta _i}$ | -0.142* (0.014) | -0.163* (0.017) | -0.135* (0.016) |
${\gamma _i}$ | 0.129* (0.018) | 0.102* (0.014) | 0.125* (0.014) |
Conditional density parameters | |||
${\nu _i}$ | 13.568* (2.735) | 10.380* (1.715) | 9.219* (1.428) |
${\lambda _i}$ | -0.151* (0.023) | -0.138* (0.024) | -0.133* (0.021) |
Asymmetry effect for market i | |||
${\delta _i} = {\theta _i}/\gamma $ | -1.10 < 0 | -1.60 < 0 | -1.08 < 0 |
Half–life (HL) | 36.13 | 29.79 | 32.66 |
Log–likelihood | -4659.73 | -5503.42 | -5544.81 |
LB(20) | 11.55 [0.93] | 23.12 [0.28] | 20.58 [0.42] |
LB2(20) | 26.13 [0.16] | 7.84 [0.99] | 15.35 [0.76] |
Source: Authors' calculations Notes: * denotes significance at the 5 per cent level. The heteroskedastic consistent standard errors are in parentheses. The variance-covariance matrix of the estimated parameters is based on the QML algorithm. The distribution for the innovations is supposed to be skewed t; ν and λ are conditional density parameters (Lucchetti and Balietti, 2011). The asymmetry coefficient is defined in the text. The half-life is defined in the text and represents the time it takes for the shock to reduce its impact by one-half. LB (20) and LB2(20) denotes the Ljung-Box (1978) statistics for standardized innovations and squared standardized innovations, respectively (Baillie and Bollerslev, 1990). Numbers in brackets are p-values. |
In the case of all analyzed periods, the choice of an appropriate version of the EGARCH model was conducted based on the BIC and AIC information criterions, and distributions for the innovations were supposed to be normal, t-Student, or skewed t. As it turned out, the univariate AR (1)–EGARCH (1, 1) models with skewed t as the distribution for the innovations are the most adequate for all series in the whole sample period. Calculations concerning EGARCH models have been done using GAUSS package with FANPAC MT 3.0 module.
For model checking, the Ljung-Box statistics LB (20) for the standardized innovation process and LB2(20) for the squared standardized innovations have been applied (Baillie and Bollerslev, 1990). The evidence is that there is no serial correlation or conditional heteroskedasticity in the standardized innovations of the fitted models in the whole sample period. Therefore we can conclude that the estimated AR (1)–EGARCH (1, 1) models are adequate (Tsay, 2010).
Several results presented in Table 2 are worth a comment. The autoregressive coefficients φi are negative and statistically significant for the London and Paris markets. The conditional variance is a function of past conditional variances and past innovations. The relevant coefficients αi, θi and γi are statistically significant at the 5 per cent level in the case of all models. In addition, all of the γicoefficients are positive. For positive γi, if δi =θi/ γi < 0, then negative innovations have a higher impact on volatility than positive innovations. If δi = 0 (θi = 0 and γi > 0), then the magnitude terms raises (lowers) volatility when the magnitude of market movements is large (small). If 0 < δi < 1, then positive innovations would increase volatility but negative innovations decrease volatility. These pronounced negative asymmetry effects are present in Table 2. For London, Paris, and Frankfurt, negative innovations increase volatility considerably more than positive innovations. Our findings suggest that the investigated stock markets are more sensitive to 'bad' than 'good' news.
The persistence of volatility may be interpreted by using the half-life concept (11), which measures the time it takes for an innovation to reduce its impact by one half. Numerically, the HL coefficients for the London, Paris, and Frankfurt indexes are equal to: 36.13, 29.79 and 32.66 days, respectively. It is worth stressing that the half–life coefficients are rather high, however Olbryś (2013b) documents that half–life coefficients for the New York, Warsaw, Prague, and Budapest indexes are equal to: 31.16, 40.43, 29.79, and 32.66 days, respectively. Moreover, Scheicher (2001) documents half–life coefficients for the CTX, HTX, and PTX indexes, which are equal to: 16.39, 1.95, and ∞ (!) days. Bhar (2001) reports half–life coefficients equal to 2.63 and 3.86 days for two Australian spot and futures markets.
Subsequent Tables 3–5 present details concerning further numerical results from the AR(1)–EGARCH(1, 1) models of three stock indexes in three adjacent subsamples, each of equal size: (1) the pre-GFC (Table 3), (2) the GFC (Table 4) and (3) the post-GFC (Table 5) periods, respectively. As mentioned in subsection 2.2, we have obtained different GFC periods for analyzed stock markets (see Figures 1–3), hence the corresponding adjacent subperiods are different as well.
The results in Tables 3–5 reveal that the asymmetric effects between positive and negative index return innovations are presented for all markets and turn out to be robust to the choice of the period. Almost all of the γi coefficients are significantly positive and almost all of the θi coefficients are significantly negative (at the 5 percent level). Hence, the corresponding δi =θi/γi coefficients are negative, except for the DAX index during the post-GFC period, which is reported in Table 5. However, the DAX best fitted EGARCH model is qualitatively rather poor. Therefore, we can conclude that negative innovations have a higher impact on the volatility than positive innovations. This evidence confirms that the investigated European stock markets are more sensitive to 'bad' than 'good' news, regardless of the subperiod choice. The half-life coefficients (11), which measure the persistence of volatility for the London, Paris, and Frankfurt indexes during the pre-, crisis and post-crisis periods are equal to: (1) 16.98, 12.98 and 8.54 days (for the pre-GFC period – Table 3), (2) 22.76, 23.55 and 24.40 days (for the GFC period–Table 4) and (3) 16.15, 10.48 and 692.80 days (for the post-GFC period–Table 5), respectively. However, as mentioned, the quality of the best fitted EGARCH model for the Frankfurt Stock Exchange is rather low (for details see Table 5). Excluding the DAX index, the results for FTSE100 and CAC40 indexes during the pre-and post-GFC periods are quantitatively almost the same, while during the GFC period the HL values, which inform about time required for innovations to be reduced to one–half of their original size, are slightly higher for all stock markets.
London (i=1) | Paris (i=2) | Frankfurt (i=3) | |
Pre-GFC period | 11.07.2006–30.10.2007 331 daily observations | 1.09.2005–30.05.2007 439 daily observations | 30.10.2006–27.12.2007 292 daily observations |
The distribution for the innovations (the best fitted model) | normal | t-Student | skewed t |
Conditional mean equation | |||
${\varphi _{i, 0}}$ | 0.003 (0.042) | 0.070 (0.039) | 0.074 (0.053) |
${\varphi _i}$ | 0.020 (0.054) | -0.121* (0.048) | -0.043 (0.064) |
Conditional variance equation | |||
$\alpha _{i, 0}^*$ | -0.116 (0.060) | -0.032 (0.039) | -0.094* (0.047) |
${\alpha _i}$ | 0.960* (0.021) | 0.948* (0.020) | 0.922* (0.051) |
${\theta _i}$ | -0.171* (0.042) | -0.196* (0.037) | -0.158* (0.064) |
${\gamma _i}$ | 0.127 (0.069) | 0.013 (0.045) | 0.111 (0.058) |
Conditional density parameters | |||
${\nu _i}$ | – | 16.189 (13.063) | 8.957 (5.524) |
${\lambda _i}$ | – | – | -0.206* (0.087) |
Asymmetry effect for market i | |||
${\delta _i} = {\theta _i}/{\gamma _i}$ | -1.35 < 0 | -15.08 < 0 | -1.42 < 0 |
Half–life (HL) | 16.98 | 12.98 | 8.54 |
Log–likelihood | -391.26 | -527.81 | -382.62 |
LB(20) | 16.96 [0.66] | 17.98 [0.59] | 14.19 [0.82] |
LB2(20) | 8.01 [0.99] | 14.78 [0.79] | 13.95 [0.83] |
Source: Authors' calculations. Notes: See Table 2 for explanations. |
London (i=1) | Paris (i=2) | Frankfurt (i=3) | |
GFC period | 31.10.2007–27.02.2009 331 daily observations | 31.05.2007–27.02.2009 439 daily observations | 28.12.2007–27.02.2009 292 daily observations |
The distribution for the innovations (the best fitted model) | normal | normal | skewed t |
Conditional mean equation | |||
${\varphi _{i, 0}}$ | -0.233* (0.094) | -0.199* (0.000) | -0.224* (0.000) |
${\varphi _i}$ | -0.119* (0.052) | -0.087* (0.000) | -0.030* (0.000) |
Conditional variance equation | |||
$\alpha _{i, 0}^*$ | -0.059 (0.034) | -0.086* (0.033) | -0.030 (0.037) |
${\alpha _i}$ | 0.970* (0.013) | 0.971* (0.010) | 0.972* (0.010) |
${\theta _i}$ | -0.136* (0.032) | -0.193* (0.040) | -0.177* (0.033) |
${\gamma _i}$ | 0.128* (0.045) | 0.151* (0.038) | 0.085* (0.041) |
Conditional density parameters | |||
${\nu _i}$ | – | – | 11.092 (7.300) |
${\lambda _i}$ | – | – | -0.061 (0.077) |
Asymmetry effect for market i | |||
${\delta _i} = {\theta _i}/{\gamma _i}$ | -1.06 < 0 | -1.28 < 0 | -2.08 < 0 |
Half–life (HL) | 22.76 | 23.55 | 24.40 |
Log–likelihood | -667.62 | -853.18 | -599.32 |
LB(20) | 17.01 [0.65] | 17.00 [0.65] | 8.91 [0.98] |
LB2(20) | 21.33 [0.38] | 33.59 [0.03] | 35.59 [0.02] |
Source: Authors' calculations. Notes: See Table 2 for explanations. |
London (i=1) | Paris (i=2) | Frankfurt (i=3) | |
Post-GFC period | 2.03.2009–28.06.2010 331 daily observations | 2.03.2007–26.11.2010 439 daily observations | 2.03.2009–30.04.2010 292 daily observations |
The distribution for the innovations (the best fitted model) | normal | normal | normal |
Conditional mean equation | |||
${\varphi _{i, 0}}$ | 0.070 (0.061) | 0.030 (0.060) | 0.152 (0.089) |
${\varphi _i}$ | -0.020 (0.062) | -0.060 (0.049) | -0.060 (0.071) |
Conditional variance equation | |||
$\alpha _{i, 0}^*$ | -0.135* (0.034) | -0.093* (0.038) | -0.027 (0.076) |
${\alpha _i}$ | 0.958* (0.022) | 0.936* (0.028) | 0.999* (0.006) |
${\theta _i}$ | -0.144* (0.056) | -0.185* (0.059) | 0.019 (0.045) |
${\gamma _i}$ | 0.190* (0.044) | 0.182* (0.044) | 0.030 (0.099) |
Asymmetry effect for market i | |||
${\delta _i} = {\theta _i}/{\gamma _i}$ | -0.76 < 0 | -1.02 < 0 | 0.63 > 0 |
Half–life (HL) | 16.15 | 10.48 | 692.80 |
Log–likelihood | -531.96 | -779.07 | -523.18 |
LB(20) | 22.06 [0.34] | 15.53 [0.75] | 14.41 [0.81] |
LB2(20) | 30.57 [0.06] | 40.06 [0.005] | 30.64 [0.06] |
Source: Authors' calculations. Notes: See Table 2 for explanations. |
The aim of this study was to explore the asymmetric impact of innovations on volatility on the major developed European stock markets in the UK, France and Germany, by using the EGARCH based approach. The sample covered the period from January 2003 to December 2016, and it included the 2007 U.S. subprime crisis. The robustness analysis of empirical results was provided with respect to the whole sample and three adjacent subsamples, each of equal size: 1) the pre-GFC, 2) the GFC, and 3) the post-GFC periods. Our research confirmed the pronounced asymmetric impact of innovations on volatility in the case of all analyzed stock markets. We conclude that negative innovations have a higher impact on volatility than positive innovations. Our findings are rather consistent with the literature and suggest that the investigated stock markets are more sensitive to 'bad' than 'good' news, regardless of the subsample choice. From an investor's point of view it is important that these findings are also in accordance with the investor's intuition. Moreover, the results are essentially not surprising if we take into account that the major European financial markets are strongly connected 'every day', not only during financial crises. Due to the importance of the problem, a possible direction for further research would be an investigation of asymmetry effects in the case of the European stock markets in terms of other asymmetric GARCH-type models (Engle, 2000; Bauwens et al., 2006).
The contribution of the first named author was supported by a grant S/WI/1/2014 from Bialystok University of Technology and founded from the resources for research by Ministry of Science and Higher Education.
All authors declare no conflict of interest.
[1] |
Iijima S (1991) Helical microtubules of graphitic carbon. Nature 354: 56–58. doi: 10.1038/354056a0
![]() |
[2] |
Rivaldo-Gómez CM, Cabrera-Pasca GA, Zuniga A, et al. (2015) Hierarchically structured nanowires on and nanosticks in ZnO microtubes. Sci Rep 5: 15128. doi: 10.1038/srep15128
![]() |
[3] |
Wang S, He Y, Liu X, et al. (2011) Large scale synthesis of tungsten single crystal microtubes via vapor-deposition process. J Cryst Growth 316: 137–144. doi: 10.1016/j.jcrysgro.2010.10.222
![]() |
[4] | Eustache E, Tilmant P, Morgenroth L, et al. (2014) Silicon-microtube scaffold decorated with anatase TiO2 as a negative electrode for a 3D Lithium-Ion Microbattery. Adv Energy Mater 4: 1301612. |
[5] |
Lang L, Xu Z (2013) Controllable synthesis of porous alpha-Fe2O3 microtube and tube in tube by non coaxial electrospinning. Chem Lett 42: 750–752. doi: 10.1246/cl.130167
![]() |
[6] |
Wen Z, Wang Q, Zhang Q, et al. (2007) In situ growth of mesoporous SnO2 on multiwalled carbon nanotubes: a novel composite with porous-tube structure as anode for Lithium batteries. Adv Funct Mater 17: 2772–2778. doi: 10.1002/adfm.200600739
![]() |
[7] |
Bae C,Yoo H, Kim S, et al. (2008) Template-directed synthesis of oxide nanotubes: fabrication, characterization, and applications. Chem Mater 20: 756–767. doi: 10.1021/cm702138c
![]() |
[8] |
Maestre D, Cremades A, Piqueras J (2005) Growth and luminescence properties of micro- and nanotubes in sintered tin oxide. J Appl Phys 97: 044316. doi: 10.1063/1.1851602
![]() |
[9] |
Vásquez C, Peche-Herrero A, Maestre D, et al. (2013) Cr doped titania microtubes and microrods synthesized by a vapor-solid method. Cryst Eng Comm 15: 5490–5495. doi: 10.1039/c3ce40513c
![]() |
[10] |
Maestre D, Haeussler D, Cremades, et al. (2011) Nanopipes in In2O3 nanorods grown by a thermal treatment. Cryst Growth Des 11: 1117–1121. doi: 10.1021/cg101350f
![]() |
[11] |
Wu Y, Yang P (2001) Direct observation of vapor-liquid-solid nanowires growth. J Am Chem Soc 123: 3165–3166. doi: 10.1021/ja0059084
![]() |
[12] | Ruffino F, Censabella M, Torrisi V, et al. (2014) Size selected growth of unltrathin SiO2 nanowires on surface and their decoration by Au nanoparticles. Mater Res Exp 2: 025003. |
[13] |
Yang W, Wan P, Jia MY, et al. (2015) A novel electronic nose based on porous microtubes sensor arrays for the discrimination of VOCs. Biosens Bioelectron 64: 547–553. doi: 10.1016/j.bios.2014.09.081
![]() |
[14] |
Zhao XY, Liu B, Cao MH. (2015) Engineering microtubular SnO2 architecture assembled by interconnected nanosheets for high lithium storage capacity. RSC Advances 5:30053–30061. doi: 10.1039/C5RA02452H
![]() |
[15] |
Lee HU, Lee SC, Lee YC, et al. (2014) Innovative three-dimensional (3D) eco-TiO2 photocatalyst for practical environmental and biomedical applications. Sci Reports 4: 6740. doi: 10.1038/srep06740
![]() |
[16] | Dong H, Sun S, Sun L, et al. (2012) Thermodynamic-effect-induced growth, optical modulation and UV lasing of hierarchical ZnO Fabry–Pérot resonators J Mater Chem 22: 3069–3074. |
[17] | Ortega Y, Dieker C, Jäger W, et al. (2010) Voids, nanochannels and formation of nanotubes with mobile Sn fillings in Sn doped ZnO nanorods. Nanotechnology 21: 222604. |
[18] | Zhan J, Dong H, Sun S, et al. (2015) Surface-energy-driven growth of ZnO hexagonal microtube optical resonators. Adv Opt Mater 4: 126–134. |
[19] |
Maestre D, Hernandez E, Cremades A, et al. (2012) Synthesis and characterization of small dimensional structures of Er-doped SnO2 and Erbium-Tin-Oxide. Cryst Growth Des 12: 2478–2484. doi: 10.1021/cg300106k
![]() |
[20] |
Dai ZR, Pan ZW, Wang ZL, et al. (2001) Ultra-long single crystalline nanoribbons of tin oxide. Solid State Commun 118: 351–354. doi: 10.1016/S0038-1098(01)00122-3
![]() |
[21] |
Oliver PM, Watson GM, Kelsey ET, et al. (1997) Atomistic simulation of the surface structure of the TiO2 polymorphs rutile and anatase. J Mater Chem 7: 563–568. doi: 10.1039/a606353e
![]() |
[22] |
Beltran A, Andrés J, Longo E, et al. (2003) Thermodynamic argument about SnO2 nanoribbon growth. Appl Phys Lett 83: 635. doi: 10.1063/1.1594837
![]() |
[23] |
Maestre D, Cremades A, Piqueras J (2004) Cathodoluminescence of defects in sintered tin oxide. J Appl Phys 95: 3027–3030. doi: 10.1063/1.1647267
![]() |
[24] | Zhou XT, Heigl F, Murphy MW, et al. (2006) Time-resolved x-ray excited optical luminescence from SnO2nanoribbons: Direct evidence for the origin of the blue luminescence and the role of surface states. Appl Phys Lett 89: 213109. |
[25] | Kar A, Kundu S, Patra A (2011) Surface Defect-Related Luminescence Properties of SnO2 Nanorods and Nanoparticles. J Phys Chem C 115: 118–124. |
[26] | Nogales E, García JA, Méndez B, et al. (2007) Red luminescence of Cr in β-Ga2O3nanowires. J Appl Phys 101: 033517-1–033517-4. |
[27] | Fernández I, Cremades A, Piqueras J (2005) Cathodoluminescence study of defects in deformed (110) and (100) surfaces of TiO2 single crystals. Semicond Sci Technol 20: 239–243. |
[28] |
Urbieta A, Fernandez P, Piqueras J (2001) Cathodoluminescence microscopy of hydrothermal and flux grown ZnO single crystals. J Phys D-Appl Phys 34: 2945–2949. doi: 10.1088/0022-3727/34/19/303
![]() |
[29] | Dong H, Chen Z, Sun L, et al. (2010) Single-crystalline hexagonal ZnO microtube optical resonators, J Mater Chem 20: 5510–551. |
[30] | Magdas DA, Cremades A, Piqueras J (2006) Growth and luminescence of elongated In2O3 micro- and nanostructures in thermally treated InN. Appl Phys Lett 88: 113107. |
[31] |
Yin W, Cao M, Luo S, et al. (2009) Controllable synthesis of various In2O3 submicron nanostructures using chemical vapor deposition. Cryst Growth Des 9: 2173–2178. doi: 10.1021/cg8008199
![]() |
[32] |
Zeng F, Zhang X, Wang J, et al. (2004) Large scale growth of In2O3 nanowires and their optical properties. Nanotechnology 15: 596. doi: 10.1088/0957-4484/15/5/033
![]() |
[33] |
Frank FC (1951) Capillary equilibria of dislocated crystals. Acta Crystallogr 4: 497–501. doi: 10.1107/S0365110X51001690
![]() |
[34] |
Sears GW (1955) A growth mechanism for mercury whiskers. Acta Metall 3: 361–366. doi: 10.1016/0001-6160(55)90041-9
![]() |
[35] | Bierman MJ, Lau YKA, Kvit AV, et al. (2008) Dislocation-driven nanowires growth and Eshelby twist. Science 320: 1060–1063. |
[36] |
Wang ZL (2000) Transmission electron microscopy of shape controlled nanocrystals and their assemblies. J Phys Chem B 104: 1153–1175. doi: 10.1021/jp993593c
![]() |
[37] |
Yan Y, Zhou L, Zhang J, et al. (2008) Large scale synthesis of In2O3 nanocubes under nondynamic equilibrium model. Cryst Growth Des 8: 3285–3289. doi: 10.1021/cg800105h
![]() |
[38] | Tang Q, Zhou W, Zhang W, et al. (2005) Size controllable growth of single crystal In(OH)3 and In2O3 nanocubes. Cryst Growth Des 5: 147–150. |
[39] |
Qian W, Rohrer GS, Skowronski M, et al. (1995) Open core screw dislocations in GaN epilayers observed by scanning forces microscopy and high resolution transmission electron microscopy. Appl Phys Lett 67: 2284–2286. doi: 10.1063/1.115127
![]() |
[40] |
Chen Y, Takeuchi T, Amano H, et al. (1998) Pit formation in GaInN quantum wells. Appl Phys Lett 72: 710–712. doi: 10.1063/1.120853
![]() |
[41] |
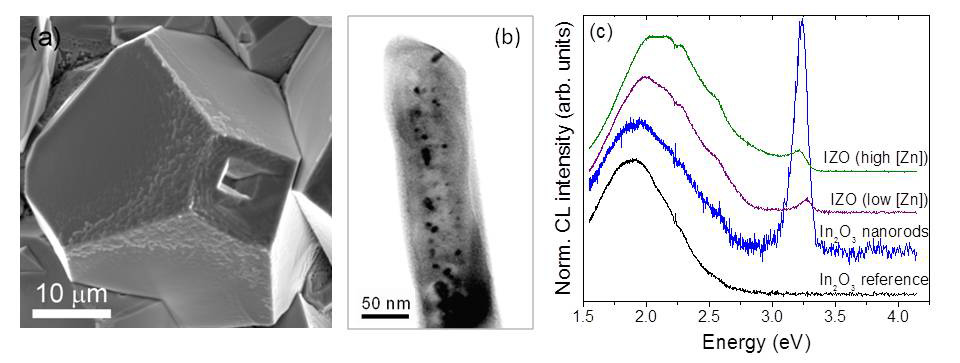
Bartolome J, Maestre D, Cremades A, et al. (2013) Composition-dependent electronic properties of indium-zinc-oxide elongated microstructures. Acta Materialia 61: 1932–1943. doi: 10.1016/j.actamat.2012.12.014
![]() |
[42] | Maestre D, Haeussler D, Cremades A, et al. (2011) Complex defect structure in the core of Sn-doped In2O3 nanorods and its relationship with a dislocation-driven growth mechanism. J Phys Chem C 115: 18083–18087. |
[43] | Mazeera M, Zha M, Calestani D, et al. (2007) Low temperature In2O3 nanowire luminescence properties as a function of oxidizing thermal treatments. Nanotechnology 18: 355707. |
[44] |
Wu X, Hong J, Han Z, et al. (2003) Fabrication and photoluminescence characteristics of single crystalline In2O3 nanowires. Chem Phys Lett 373: 28–32. doi: 10.1016/S0009-2614(03)00582-7
![]() |
[45] |
Kumar M, Singh VN, Singh F, et al. (2008) On the origin of photoluminescence in indium oxide octahedron structures. Appl Phys Lett 92:171907. doi: 10.1063/1.2910501
![]() |
[46] |
Korotcenkov G, Nazarov M, Zamoryanskaya M, et al. (2007) Cathodoluminescence emission study of nanocrystalline indium oxide films deposited b spray pyrolysis. Thin Solid Films 515: 8065–8071. doi: 10.1016/j.tsf.2007.03.186
![]() |
1. | Venus Khim-Sen Liew, The effect of novel coronavirus pandemic on tourism share prices, 2020, ahead-of-print, 2055-5911, 10.1108/JTF-03-2020-0045 | |
2. | Deby Fakhriyana, Kartika Fithriasari, 2019, 2194, 0094-243X, 020025, 10.1063/1.5139757 | |
3. | Mesfer Mahdi Al Mesfer Al Ajmi, The Impact of the Covid-19 Pandemic on Boursa Kuwait Return Volatility, 2021, 9, 2347-4696, 473, 10.37391/IJBMR.090411 | |
4. | Sinem ATICI USTALAR, Selim ŞANLISOY, COVID-19 Krizi’nin Türkiye ve G7 Ülkelerinin Borsa Oynaklıkları Üzerindeki Etkisi, 2021, 16, 1306-6730, 446, 10.17153/oguiibf.884895 | |
5. | Bartłomiej Lisicki, The impact of the COVID-19 pandemic on the equity market risk measured by the beta coefficient, 2023, 68, 2543-8476, 1, 10.5604/01.3001.0016.2360 | |
6. | Elena Villar-Rubio, María-Dolores Huete-Morales, Federico Galán-Valdivieso, Using EGARCH models to predict volatility in unconsolidated financial markets: the case of European carbon allowances, 2023, 2190-6483, 10.1007/s13412-023-00838-5 | |
7. | Muhammad Mohsin, Li Naiwen, Muhammad Zia-UR-Rehman, Sobia Naseem, Sajjad Ahmad Baig, The volatility of bank stock prices and macroeconomic fundamentals in the Pakistani context: an application of GARCH and EGARCH models, 2020, 11, 2353-1827, 609, 10.24136/oc.2020.025 | |
8. | Yuriy Bibik, Forecasting in Stock Markets Using the Formalism of Statistical Mechanics, 2023, 22, 2713-3206, 1499, 10.15622/ia.22.6.9 | |
9. | Bartłomiej Lisicki, Differentiation of Beta Coefficients during COVID-19 Pandemic – the Example of Stocks of the Largest Companies Listed on the Warsaw Stock Exchange, 2023, 2545-3238, 11, 10.15678/ZNUEK.2022.0998.0401 | |
10. | Sungjae Yoon, Hiroshi Takahashi, Intraday Trading Dynamics of Characteristics and Sentiment Tendencies of Past News in the Tokyo Stock Exchange Market, 2025, 0927-7099, 10.1007/s10614-024-10768-1 |
Index | Market Cap. EUR Billion, Dec 2015 | Mean | St. Dev. | Skewness | Excess kurtosis | Doornik-Hansen test | LB(8) | LB2(8) | |
1 | FTSE100 | 3009.5 | 0.017 | 1.169 | -0.119 [0.004] | 7.722 [0.000] | 2547.86 [0.000] | 46.81 | 2020.92 |
2 | CAC40 | 1911.2 | 0.014 | 1.432 | -0.009 [0.822] | 5.909 [0.000] | 1803.01 [0.000] | 37.20 | 1234.00 |
3 | DAX | 1781.6 | 0.039 | 1.428 | -0.015 [0.714] | 5.239 [0.000] | 1529.57 [0.000] | 18.54 | 1102.94 |
Source: Authors' calculations and http://sdw.ecb.europa.eu. Notes: The table is based on all sample observations during the period January 2,2003–December 30,2016. The test statistic for skewness and excess kurtosis is the conventional t-statistic. The |
London (i=1) | Paris (i=2) | Frankfurt (i=3) | |
The distribution for the innovations (the best fitted model) | skewed t | skewed t | skewed t |
Conditional mean equation | |||
${\varphi _{i, 0}}$ | 0.006 (0.013) | 0.007 (0.017) | 0.035 (0.019) |
${\varphi _i}$ | -0.040* (0.017) | -0.051* (0.016) | -0.014 (0.025) |
Conditional variance equation | |||
$\alpha _{i, 0}^*$ | -0.103* (0.015) | -0.072* (0.010) | -0.089* (0.010) |
${\alpha _i}$ | 0.981* (0.004) | 0.977* (0.005) | 0.979* (0.004) |
${\theta _i}$ | -0.142* (0.014) | -0.163* (0.017) | -0.135* (0.016) |
${\gamma _i}$ | 0.129* (0.018) | 0.102* (0.014) | 0.125* (0.014) |
Conditional density parameters | |||
${\nu _i}$ | 13.568* (2.735) | 10.380* (1.715) | 9.219* (1.428) |
${\lambda _i}$ | -0.151* (0.023) | -0.138* (0.024) | -0.133* (0.021) |
Asymmetry effect for market i | |||
${\delta _i} = {\theta _i}/\gamma $ | -1.10 < 0 | -1.60 < 0 | -1.08 < 0 |
Half–life (HL) | 36.13 | 29.79 | 32.66 |
Log–likelihood | -4659.73 | -5503.42 | -5544.81 |
LB(20) | 11.55 [0.93] | 23.12 [0.28] | 20.58 [0.42] |
LB2(20) | 26.13 [0.16] | 7.84 [0.99] | 15.35 [0.76] |
Source: Authors' calculations Notes: * denotes significance at the 5 per cent level. The heteroskedastic consistent standard errors are in parentheses. The variance-covariance matrix of the estimated parameters is based on the QML algorithm. The distribution for the innovations is supposed to be skewed t; ν and λ are conditional density parameters (Lucchetti and Balietti, 2011). The asymmetry coefficient is defined in the text. The half-life is defined in the text and represents the time it takes for the shock to reduce its impact by one-half. LB (20) and LB2(20) denotes the Ljung-Box (1978) statistics for standardized innovations and squared standardized innovations, respectively (Baillie and Bollerslev, 1990). Numbers in brackets are p-values. |
London (i=1) | Paris (i=2) | Frankfurt (i=3) | |
Pre-GFC period | 11.07.2006–30.10.2007 331 daily observations | 1.09.2005–30.05.2007 439 daily observations | 30.10.2006–27.12.2007 292 daily observations |
The distribution for the innovations (the best fitted model) | normal | t-Student | skewed t |
Conditional mean equation | |||
${\varphi _{i, 0}}$ | 0.003 (0.042) | 0.070 (0.039) | 0.074 (0.053) |
${\varphi _i}$ | 0.020 (0.054) | -0.121* (0.048) | -0.043 (0.064) |
Conditional variance equation | |||
$\alpha _{i, 0}^*$ | -0.116 (0.060) | -0.032 (0.039) | -0.094* (0.047) |
${\alpha _i}$ | 0.960* (0.021) | 0.948* (0.020) | 0.922* (0.051) |
${\theta _i}$ | -0.171* (0.042) | -0.196* (0.037) | -0.158* (0.064) |
${\gamma _i}$ | 0.127 (0.069) | 0.013 (0.045) | 0.111 (0.058) |
Conditional density parameters | |||
${\nu _i}$ | – | 16.189 (13.063) | 8.957 (5.524) |
${\lambda _i}$ | – | – | -0.206* (0.087) |
Asymmetry effect for market i | |||
${\delta _i} = {\theta _i}/{\gamma _i}$ | -1.35 < 0 | -15.08 < 0 | -1.42 < 0 |
Half–life (HL) | 16.98 | 12.98 | 8.54 |
Log–likelihood | -391.26 | -527.81 | -382.62 |
LB(20) | 16.96 [0.66] | 17.98 [0.59] | 14.19 [0.82] |
LB2(20) | 8.01 [0.99] | 14.78 [0.79] | 13.95 [0.83] |
Source: Authors' calculations. Notes: See Table 2 for explanations. |
London (i=1) | Paris (i=2) | Frankfurt (i=3) | |
GFC period | 31.10.2007–27.02.2009 331 daily observations | 31.05.2007–27.02.2009 439 daily observations | 28.12.2007–27.02.2009 292 daily observations |
The distribution for the innovations (the best fitted model) | normal | normal | skewed t |
Conditional mean equation | |||
${\varphi _{i, 0}}$ | -0.233* (0.094) | -0.199* (0.000) | -0.224* (0.000) |
${\varphi _i}$ | -0.119* (0.052) | -0.087* (0.000) | -0.030* (0.000) |
Conditional variance equation | |||
$\alpha _{i, 0}^*$ | -0.059 (0.034) | -0.086* (0.033) | -0.030 (0.037) |
${\alpha _i}$ | 0.970* (0.013) | 0.971* (0.010) | 0.972* (0.010) |
${\theta _i}$ | -0.136* (0.032) | -0.193* (0.040) | -0.177* (0.033) |
${\gamma _i}$ | 0.128* (0.045) | 0.151* (0.038) | 0.085* (0.041) |
Conditional density parameters | |||
${\nu _i}$ | – | – | 11.092 (7.300) |
${\lambda _i}$ | – | – | -0.061 (0.077) |
Asymmetry effect for market i | |||
${\delta _i} = {\theta _i}/{\gamma _i}$ | -1.06 < 0 | -1.28 < 0 | -2.08 < 0 |
Half–life (HL) | 22.76 | 23.55 | 24.40 |
Log–likelihood | -667.62 | -853.18 | -599.32 |
LB(20) | 17.01 [0.65] | 17.00 [0.65] | 8.91 [0.98] |
LB2(20) | 21.33 [0.38] | 33.59 [0.03] | 35.59 [0.02] |
Source: Authors' calculations. Notes: See Table 2 for explanations. |
London (i=1) | Paris (i=2) | Frankfurt (i=3) | |
Post-GFC period | 2.03.2009–28.06.2010 331 daily observations | 2.03.2007–26.11.2010 439 daily observations | 2.03.2009–30.04.2010 292 daily observations |
The distribution for the innovations (the best fitted model) | normal | normal | normal |
Conditional mean equation | |||
${\varphi _{i, 0}}$ | 0.070 (0.061) | 0.030 (0.060) | 0.152 (0.089) |
${\varphi _i}$ | -0.020 (0.062) | -0.060 (0.049) | -0.060 (0.071) |
Conditional variance equation | |||
$\alpha _{i, 0}^*$ | -0.135* (0.034) | -0.093* (0.038) | -0.027 (0.076) |
${\alpha _i}$ | 0.958* (0.022) | 0.936* (0.028) | 0.999* (0.006) |
${\theta _i}$ | -0.144* (0.056) | -0.185* (0.059) | 0.019 (0.045) |
${\gamma _i}$ | 0.190* (0.044) | 0.182* (0.044) | 0.030 (0.099) |
Asymmetry effect for market i | |||
${\delta _i} = {\theta _i}/{\gamma _i}$ | -0.76 < 0 | -1.02 < 0 | 0.63 > 0 |
Half–life (HL) | 16.15 | 10.48 | 692.80 |
Log–likelihood | -531.96 | -779.07 | -523.18 |
LB(20) | 22.06 [0.34] | 15.53 [0.75] | 14.41 [0.81] |
LB2(20) | 30.57 [0.06] | 40.06 [0.005] | 30.64 [0.06] |
Source: Authors' calculations. Notes: See Table 2 for explanations. |