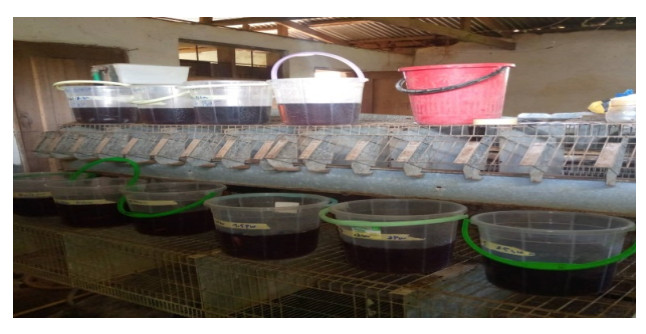
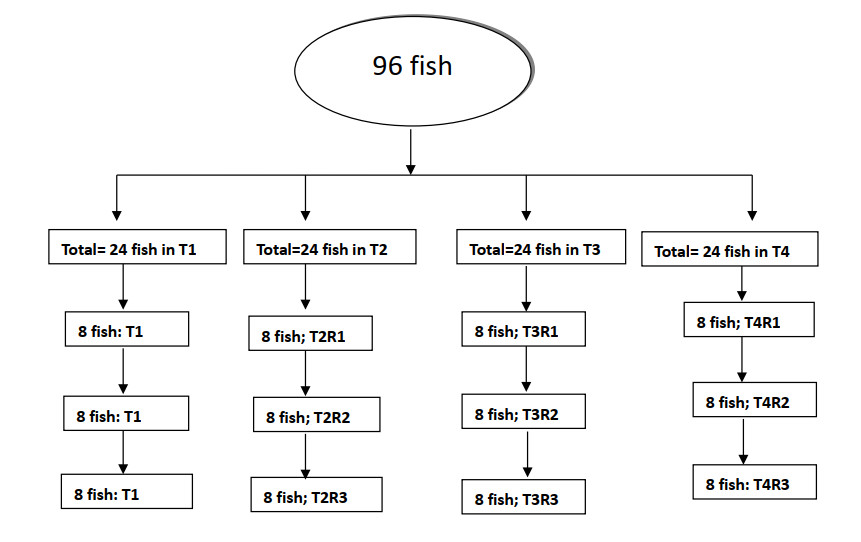
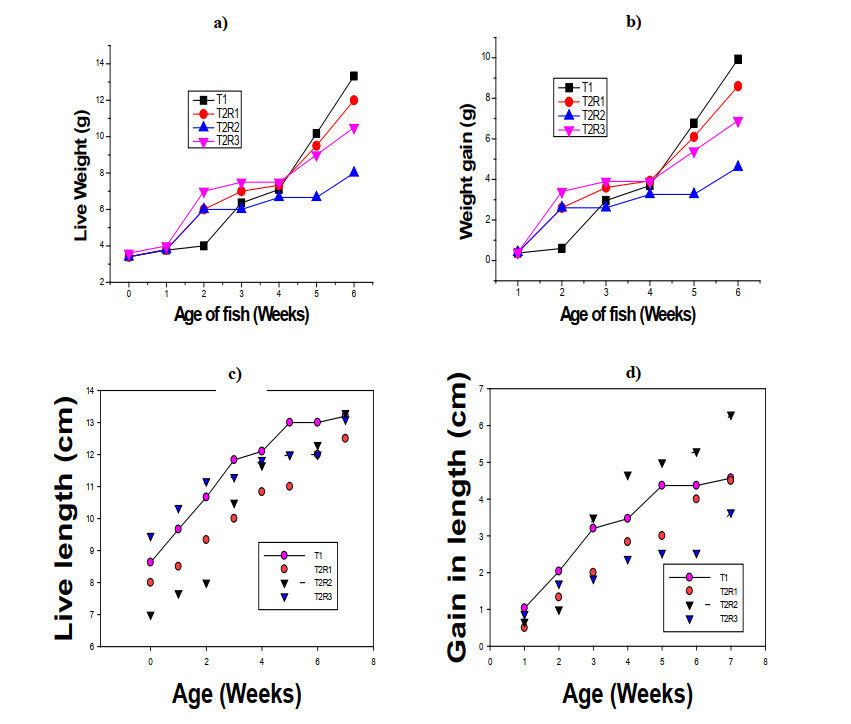
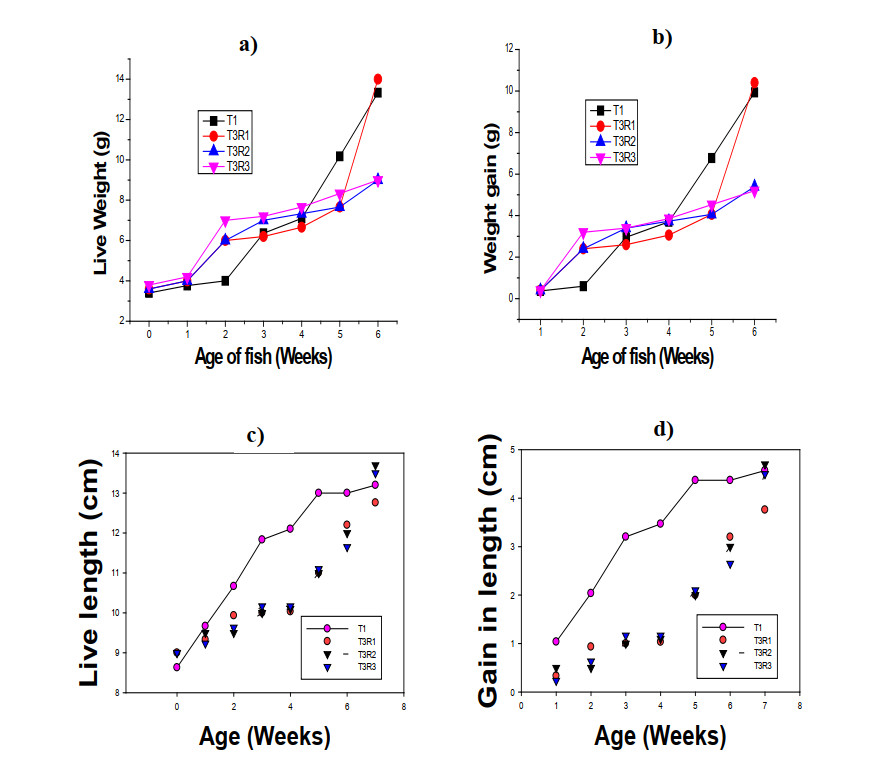
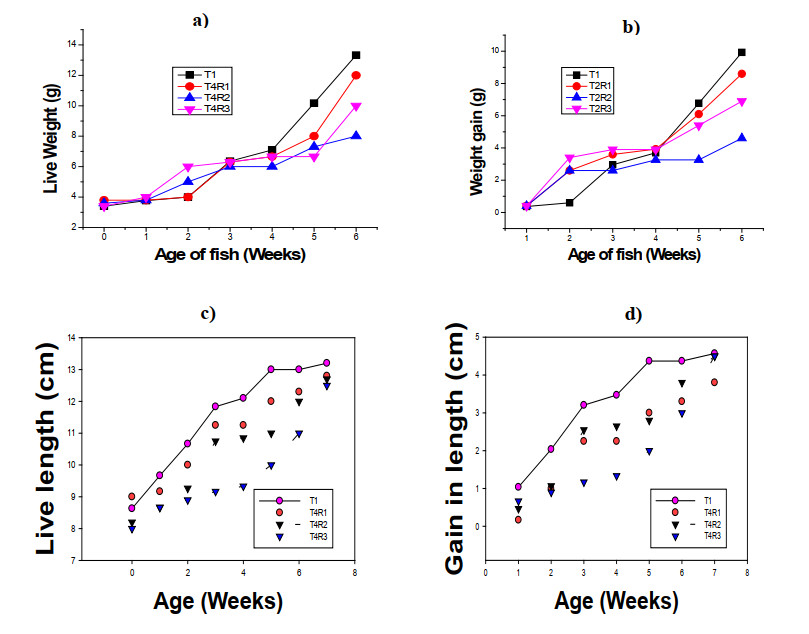
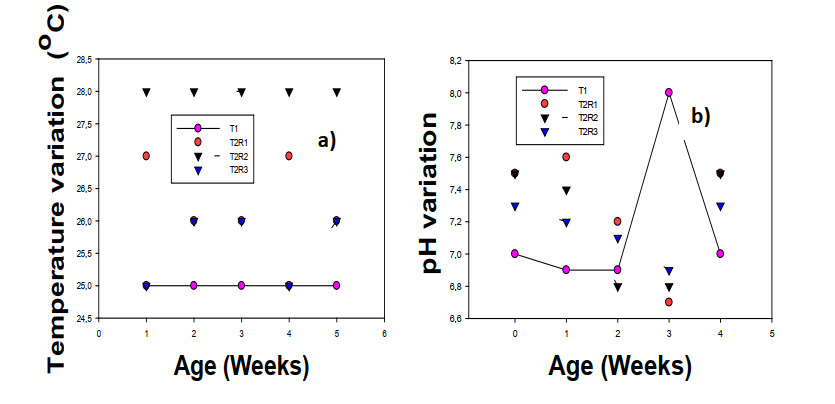
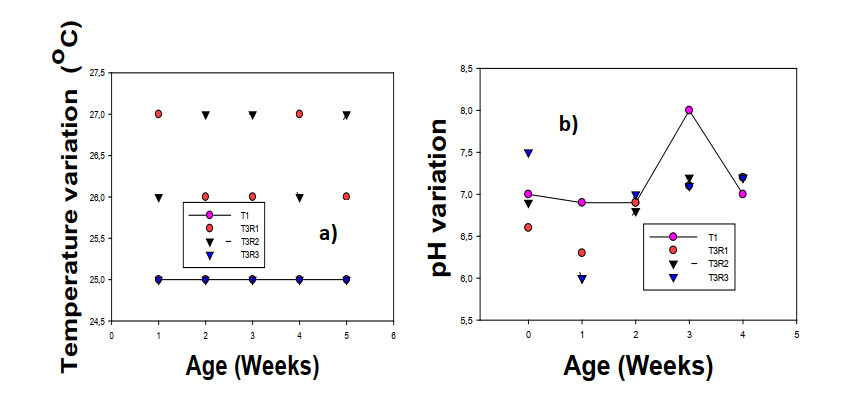
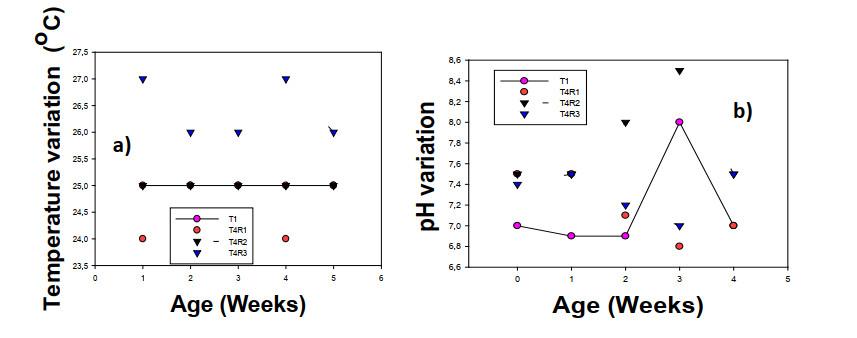
Integrating fish farming with wastewater recycling can improve fish farming programs, ensuring environmental sustainability while improving cost of fish farming. This study examines the influence of wastewaters from slaughterhouses and palm oil mils on the growth performance of catfish. Artificial ponds created with transparent buckets, where the fingerlings were grown for six weeks, contained each wastewater type comprising 30%, 40% and 50% wastewater, the rest being tap water. Tap water was used as the control. Live body weight, weight gain, live length and gain in length of fish were used to monitor fish growth performance on a weekly basis. Pond temperature and pH were also monitored weekly. The physicochemical parameters of the water in the ponds were above the standards required for fishponds. There was no significant difference between the growth performance parameters in the control and other treatments during the entire period of study. There was also a strong correlation (r ≈ 1) between the growth performance and the duration of study for all the treatments, indicating the fish could survive in the ponds for as long as necessary. Highest live weight of 14 g in T3R1, 13.33 g for control, 12 g for T2R1 and T4R1 were obtained. Highest live length values of 13.70, 13.50, 13.30, 13.20, 13.10 cm were obtained for T3R2, T3R3, T2R2, control and T2R3 respectively. Temperature in the adapted ponds ranged from 24–28 ℃, and pH raged from 6–8. A low mortality rate of 4.16% (4 deaths) was obtained in the case of T3R3 only for the first week, but there no other mortality in other treatments throughout the period of the study. Results obtained show that wastewaters from slaughterhouses and palm oil mills can effectively be used to grow fish, reducing cost of fish farming and ensuring environmental sustainability from dumping of the wastewaters.
Citation: Cornelius Tsamo, Tita Mangi Germaine, Adjia Henriette Zangue. Reuse of wastewaters from slaughterhouse and palm oil mill: Influence on the growth performance of catfish (Clarias gariepinus)[J]. AIMS Environmental Science, 2023, 10(6): 743-763. doi: 10.3934/environsci.2023041
Integrating fish farming with wastewater recycling can improve fish farming programs, ensuring environmental sustainability while improving cost of fish farming. This study examines the influence of wastewaters from slaughterhouses and palm oil mils on the growth performance of catfish. Artificial ponds created with transparent buckets, where the fingerlings were grown for six weeks, contained each wastewater type comprising 30%, 40% and 50% wastewater, the rest being tap water. Tap water was used as the control. Live body weight, weight gain, live length and gain in length of fish were used to monitor fish growth performance on a weekly basis. Pond temperature and pH were also monitored weekly. The physicochemical parameters of the water in the ponds were above the standards required for fishponds. There was no significant difference between the growth performance parameters in the control and other treatments during the entire period of study. There was also a strong correlation (r ≈ 1) between the growth performance and the duration of study for all the treatments, indicating the fish could survive in the ponds for as long as necessary. Highest live weight of 14 g in T3R1, 13.33 g for control, 12 g for T2R1 and T4R1 were obtained. Highest live length values of 13.70, 13.50, 13.30, 13.20, 13.10 cm were obtained for T3R2, T3R3, T2R2, control and T2R3 respectively. Temperature in the adapted ponds ranged from 24–28 ℃, and pH raged from 6–8. A low mortality rate of 4.16% (4 deaths) was obtained in the case of T3R3 only for the first week, but there no other mortality in other treatments throughout the period of the study. Results obtained show that wastewaters from slaughterhouses and palm oil mills can effectively be used to grow fish, reducing cost of fish farming and ensuring environmental sustainability from dumping of the wastewaters.

| [1] | Resources Department, Wastewater as a resource, EIB Projects Directorante - SECTOR PAPERS, European Investment Bank, (2022) ISBN 978-92-861-5335-8; 1–29. file: ///C: /Users/TSANGO/Downloads/wastewater-as-a-resource-en.pdf (Accessed 10 August 2023) |
| [2] |
Sato T, Qadir M, Yamamoto S, et al. (2013) Global, regional, and country level need for data on wastewater generation, treatment, and use. Agric Water Manag 130: 1–13. http://dx.doi.org/10.1016/j.agwat.2013.08.007 doi: 10.1016/j.agwat.2013.08.007

|
| [3] | Bustillo-Lecompte C, Mehrvar M (2017) Slaughterhouse wastewater: Treatment, management and resource, recovery. In book: Physico-Chemical Wastewater Treatment and Resource Recovery Chapter: 8 Publisher: InTech Open Access Publisher, Editors: Robina Farooq, Zaki Ahmad. http://dx.doi.org/10.5772/65499 |
| [4] |
Tsamo C, Assabe M, Argue J, et al. (2019) Discoloration of methylene blue and slaughter house wastewater using maize cob biochar produced using a constructed burning chamber: A comparative study. Sci Afr 3: 1–13. https://doi.org/10.1016/j.sciaf.2019.e00078 doi: 10.1016/j.sciaf.2019.e00078
|
| [5] |
Dangwang Dikdim JM, Germain VD, Tsamo C (2022) Batch mode treatment of wastewater from the Maroua artisanal tannery using silica extracted from rice husks and silica/sand mixture. Equilibrium J Chem Eng 6. https://doi.org/10.20961/equilibrium.v6i1.61211 doi: 10.20961/equilibrium.v6i1.61211
|
| [6] | Hasanudin U, Setiadi T (2016) Sustainable Wastewater Management in Palm Oil Mills, Green Technologies for Sustainable Water Management, Editor: Ngo et al 2016: 955–973, ASCE Publisher http://dx.doi.org/10.1061/9780784414422 |
| [7] |
Kospa HSD, Lulofs KRD, Asdak C (2017) Estimating Water Footprint of Palm Oil Production in PTP Mitra Ogan Baturaja, South Sumatera. Int J Adv Sci Eng Inf Technol 7: 2115–2121. https://doi.org/10.18517/ijaseit.7.6.2451 doi: 10.18517/ijaseit.7.6.2451
|
| [8] |
Bashir MJK, Sheen OS, Ng CA, et al. (2022) Advanced Treatment of Palm Oil Mill Effluent Using Thermally Activated Persulfate Oxidation. Separations. 9: 171. https://doi.org/10.3390/separations9070171 doi: 10.3390/separations9070171
|
| [9] |
Ng M, Dalhatou S, Wilson J, et al. (2022) Characterization of Slaughterhouse Wastewater and Development of Treatment Techniques: A Review. Processes, 10: 1300. https://doi.org/10.3390/pr10071300 doi: 10.3390/pr10071300
|
| [10] |
Jones ER, van Vliet MTH, Qadir M, et al. (2021) Country-level and gridded estimates of wastewater production, collection, treatment and reuse. Earth Syst Sci Data 13: 237–254, https://doi.org/10.5194/essd-13-237-2021. doi: 10.5194/essd-13-237-2021
|
| [11] |
Rus˘anescu CO, Rus˘anescu M, Constantin GA (2022) Wastewater Management in Agriculture. Water. 14: 3351. https://doi.org/10.3390/w14213351 doi: 10.3390/w14213351
|
| [12] |
Al-Hazmi HE, Mohammadi A, Hejna A, et al. (2023) Wastewater reuse in agriculture: Prospects and challenges. Environ Res 236: 116711. https://doi.org/10.1016/j.envres.2023.116711 doi: 10.1016/j.envres.2023.116711
|
| [13] |
Heck S, Béné C, Reyes-Gaskin R (2007) Investing in African fisheries; building links to the Millenium Development Goals. Fish Fish 8: 211–226. https://doi.org/10.1111/j.1467-2679.2007.00251.x doi: 10.1111/j.1467-2679.2007.00251.x
|
| [14] |
Christopher D, Gardner JC, Hartle RD, et al. (2019). Maximizing the intersection of human health and the health of the environment with regard to the amount and type of protein produced and consumed in the United States. Nutr Rev 77:197–215. https://doi.org/10.1093/nutrit/nuy073 doi: 10.1093/nutrit/nuy073
|
| [15] | Edwards P (1992) Reuse of Human Wastes in Aquaculture.Washington, D.C.: UNDP-World Bank Water and Sanitation Program. https://www.susana.org/_resources/documents/default/3-3062-7-1521807299.pdf |
| [16] | (WHO) World Health Organization, (2006). Guidelines for the Safe Use of Wastewater, Excreta and Greywater. Volume 3: Wastewater and Excreta Use in Aquaculture. Geneva: World Health Organization. |
| [17] | Awoke JS, Oti EE, Nwakpa JN (2023) Effect of Different Water Media on Growth and Production Performance Parameters of African Catfish Clarias gariepinus (Burchell 1822) Fry Oceanogr Fish Open Access J 16. |
| [18] |
Ssekyanzi A Nevejan N, Kabbiri R, Wesana J, et al. (2023) Knowledge, Attitudes, and Practices of Fish Farmers Regarding Water Quality and Its Management in the Rwenzori Region of Uganda. Water 15: 42. https://doi.org/10.3390/w15010042 doi: 10.3390/w15010042
|
| [19] | Yosmaniar Y, Sumiati T, Mulyasari M (2021) Growth Performance and Survival Rate of Catfish (Pangasius sp) with the Application of the Nitrifying and Denitrifying Bacteria, IOP Conf Ser: Earth Environ. 934: 012004. https://doi.org/10.1088/1755-1315/934/1/012004 |
| [20] | Krishnakumar A, Anton ESP, Jayawardena UA (2020) Water hardness influenced variations in reproductive potential of two freshwater fish species; Poecilia reticulata and Betta splendens, BMC Res Notes 13: 542. https://doi.org/10.1186/s13104-020-05382-x |
| [21] | Ghozlan AA, Zaki MM, Gaber MM, et al. (2018) Effect of Different Water Sources on Survival Rate (%) Growth Performance, Feed Utilization, Fish Yield, and Economic Evaluation on Nile Tilapia (Oreochromis niloticus) Monosex Reared in Earthen Ponds. J Oceanogr 6. https://doi.org/10.19080/OFOAJ.2018.05.555676 |
| [22] | Elnady M.A, Abdel-Wahed RK, Salem MA, et al. (2021) Influence of Water Temperature and Salinity on Rearing of Nile Tilapia Fry under Biofloc Culture System. Egyptian Journal of Aquatic Biology & Fisheries, Oceanogr Fish Open Access J 25: 61–77. https://doi.org/10.21608/ejabf.2021.210384 |
| [23] | Jemal F, Van Hulle SWH (2020) Wastewater reclamation and reuse potentials in agriculture: towards environmental sustainability. Environ Dev Sustain https://doi.org/10.1007/s10668-020-00732-y |
| [24] | Girard JJ (2011) Feasibility of Wastewater Reuse for Fish Production in Small Communities in a Developing World Setting, Graduate Theses and Dissertations https://scholarcommons.usf.edu/etd/3119 |
| [25] | APHA, AWWA & WPCF (1998) Standard methods for the examination of water and wastewater 20th Edition. APHA, NY, USA. |
| [26] |
Ogunji JO, Awoke J (2017) Effect of environmental regulated water temperature variations on survival, growth performance and haematology of African catfish, Clarias gariepinus. Our Nature 15: 26–33. https://doi.org/10.3126/on.v15i1-2.18791 doi: 10.3126/on.v15i1-2.18791
|
| [27] |
Kasihmuddin SM, Ghaffar MA, Das SK (2021) Rising Temperature Effects on Growth and Gastric Emptying Time of Freshwater African Catfish (Clarias Gariepinus) Fingerlings. Animals 11: 3497. https://doi.org/10.3390/ani11123497 doi: 10.3390/ani11123497
|
| [28] |
Akinwole AO, Dauda AB, Ololade OA (2016) Growth Performance of African Catfish (Clarias gariepinus) Juveniles Reared in Wastewater Treated with Alum and Moringa oleifera Seed. J Aquac Res Development 7: 12. https://doi.org/10.4172/2155-9546.1000460 doi: 10.4172/2155-9546.1000460
|
| [29] | Ubuoh EA, Akhionbare SMO, Onifade AO (2013) Potential of Moringa oleifera seed powder as a coagulation agent for refinery wastewater treatment in warri, delta State, Nigeria. IJABR 3: 17–20. |
| [30] | Isyaku B, Solomon JR (2016) Effect of detergent on the growth of African catfish (Clarias gariepinus) DRJAFS. 4: 351–360. |
| [31] |
Esenowo IK, Ugwurnba OA (2010). Growth response of catfish exposed to water soluble fraction of detergent and diesel oil. Environ Res 4: 298–301. https://doi.org/10.3923/erj.2010.298.301 doi: 10.3923/erj.2010.298.301
|
| [32] |
Copatti CE, de Oliveira Garcia L, Kochhann D, et al. (2011) Low water hardness and pH affect growth and survival of silver catfish juveniles. Cienc Rural Santa Maria 41: 1482–1487. https://doi.org/10.1590/S0103-84782011005000101 doi: 10.1590/S0103-84782011005000101
|
| [33] | Neyjan F, Khalesi MK, Eskandari KE (2023: Effects of different water hardness levels on, growth indices, survival rate, hematological parameters and culture water quality of Caspian kutum fingerlings (Rutilus frisii). J Util Cultiva Aquatics 11: 61–80. |
| [34] |
Kasihmuddin SM, Ghaffar MA, Das SK (2021) Rising Temperature Effects on Growth and Gastric Emptying Time of Freshwater African Catfish (Clarias Gariepinus) Fingerlings. Animals 11: 3497. https://doi.org/10.3390/ani11123497 doi: 10.3390/ani11123497
|
| [35] |
Britz P J, Hecht T (1987) Temperature preferences and optimum temperature for growth of African sharptooth catfish (Clark gariepinus) larvae and postlarvae. Aquac 63: 205–214. https://doi.org/10.1016/0044-8486(87)90072-X doi: 10.1016/0044-8486(87)90072-X
|
| [36] | Santhosh B, Singh NP (2007) Guidelines for water quality management for fish culture in Tripura. ICAR Research Complex for NEH Region, Tripura Center, Publication 29 |
| [37] |
Bhatnagar B, Devi P (2013) Water quality guidelines for the management of pond fish culture, Int. J Environ Sci 3: 1980–2009. doi: 10.6088/ijes.2013030600019 doi: 10.6088/ijes.2013030600019
|
| [38] |
Kay RNB, Sharman GAM, Hamilton WJ, et al. (1981) Carcass characteristics of young red deer farmed on hill pasture. J Agric Sci 96: 79–87. https://doi.org/10.1017/S0021859600031890 doi: 10.1017/S0021859600031890
|
| [39] | Jamabo NA (2008) Ecology of Tympanotonusfuscatus (Linnaeus, 1758) in the Mangrove Swamps of the Upper Bonny River, Niger Delta, Nigeria. Ph.D. Thesis, Rivers State University of Science and Technology, Port Harcourt, Nigeria, 231. |
Figures(8) / Tables(3)

Cornelius Tsamo, Tita Mangi Germaine, Adjia Henriette Zangue. Reuse of wastewaters from slaughterhouse and palm oil mill: Influence on the growth performance of catfish (Clarias gariepinus)[J]. AIMS Environmental Science, 2023, 10(6): 743-763. doi: 10.3934/environsci.2023041


 DownLoad: