Watersheds are naturally prone to environmental disasters such as flooding. The purpose of the study was to analyze the potential impact of flooding on the Nabaoy River Watershed using Geographic Information System (GIS) remote sensing. Secondary data for flood factors such as slope, elevation, land cover, surface run-off, rainfall, and soil were used and reclassified using the critical scale of factors of flood vulnerability ratings and weighting overlay using the GIS environment to create geospatial data on the potential impact to flooding. Data revealed the following percentages of the susceptibility of the watershed to flooding: very low (8.06%), very highly (19.79%), moderate (22.15%), high (22.84%), and low (27.16%). The main result showed that the upstream area of the Nabaoy river watershed such as Nabaoy, Napaan, Pawa, and Tag-osip was within low to very low flood vulnerability. Meanwhile, the inundation vulnerability intimidation on the downstream side of the Nabaoy river watershed such Cubay Sur, Motag, and low-lying areas of Nabaoy, Napaan, and Tag-osip have moderate to very highly susceptibility to flooding. The results obtained can help the concerned agencies and stakeholders to craft policy and water management plans, adaptive capacity, conservation measures, and resilience programs in response to severe flooding.
Citation: Gene T. Señeris. Nabaoy River Watershed potential impact to flooding using Geographic Information System remote sensing[J]. AIMS Environmental Science, 2022, 9(3): 381-402. doi: 10.3934/environsci.2022024
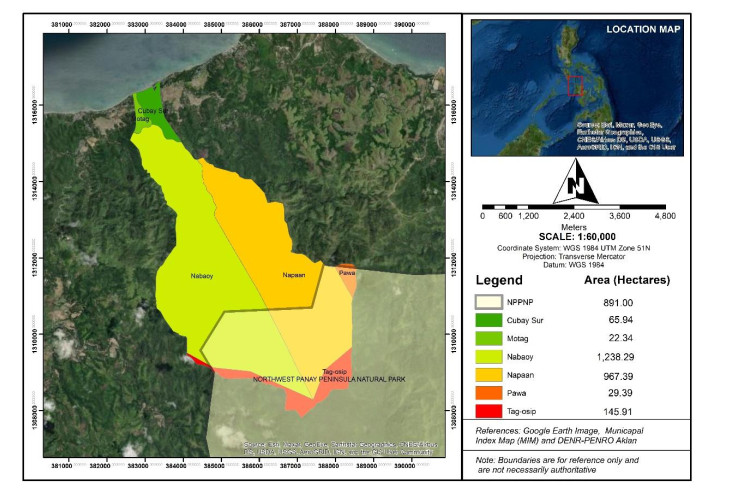
Watersheds are naturally prone to environmental disasters such as flooding. The purpose of the study was to analyze the potential impact of flooding on the Nabaoy River Watershed using Geographic Information System (GIS) remote sensing. Secondary data for flood factors such as slope, elevation, land cover, surface run-off, rainfall, and soil were used and reclassified using the critical scale of factors of flood vulnerability ratings and weighting overlay using the GIS environment to create geospatial data on the potential impact to flooding. Data revealed the following percentages of the susceptibility of the watershed to flooding: very low (8.06%), very highly (19.79%), moderate (22.15%), high (22.84%), and low (27.16%). The main result showed that the upstream area of the Nabaoy river watershed such as Nabaoy, Napaan, Pawa, and Tag-osip was within low to very low flood vulnerability. Meanwhile, the inundation vulnerability intimidation on the downstream side of the Nabaoy river watershed such Cubay Sur, Motag, and low-lying areas of Nabaoy, Napaan, and Tag-osip have moderate to very highly susceptibility to flooding. The results obtained can help the concerned agencies and stakeholders to craft policy and water management plans, adaptive capacity, conservation measures, and resilience programs in response to severe flooding.

| [1] | Ecosystems Research, Development Bureau, Manual on Vulnerability Assessment of Watersheds. Department of Environment and Natural Resources, College, Laguna, 2011. Available from: https://erdb.denr.gov.ph/wp-content/uploads/2015/06/VA%20Manual.pdf. |
| [2] |
Mirza MQ (2002) Global warming and changes in the probability of occurrence of floods in Bangladesh and implications. Global Environ Change 12: 127-138. https://doi.org/10.1016/S0959-3780(02)00002-X doi: 10.1016/S0959-3780(02)00002-X

|
| [3] |
Azmeri, Yulianur A, Rizalihadi M, et al. (2015) Hydrologic response unit analysis using avswat 200 for keuliling reservoir watershed. Aceh Int J Sci Technol 4: 31-40. https://doi.org/10.13170/aijst.4.1.2317 doi: 10.13170/aijst.4.1.2317
|
| [4] | Penna D, Borga M, Zoccatelli D, et al. (2013) Analysis of Flash-Flood Runoff Response, with Examples from Major European Events. Treatise on Geomorphology 7: 95-104. https://doi.org/0.1016/B978-0-12-374739-6.00153-6 |
| [5] | Schmidt-Thomé P, Integration of Natural Hazards, Risks and Climate Change Into Spatial Planning Practices. Geological Survey of Finland, Espoo, Finland, 2006. Available from: https://helda.helsinki.fi/bitstream/handle/10138/21183/integrat.pdf?sequence=2&isAllowed=y. |
| [6] | Dewan AM (2013) Floods in a Megacity: Geospatial Techniques in Assessing Hazards, Risk and Vulnerability. Springer Dordrecht and Springer Heidelberg, New York and London. http://dx.doi.org/10.1007/978-94-007-5875-9 |
| [7] |
Khailani DK, Perera R (2013) Mainstreaming disaster resilience attributes in local development plans for the adaptation to climate change induced flooding: A study based on the local plan of Shah Alam City, Malaysia. Land Use Policy 30: 615-627. https://doi.org/10.1016/j.landusepol.2012.05.003 doi: 10.1016/j.landusepol.2012.05.003
|
| [8] | Pei-Wen LU (2014) Spatial Planning and Urban Resilience in the Context of Flood Risk: Acomparative Study of Kaohsiung, Tainan and Rotterdam. Architecture and the Built Environment. https://doi.org/10.7480/abe.2014.7 |
| [9] |
Alfasi N, Almagor J, Benenson I (2012) The actual impact of comprehensive land-use plans: insights from high resolution observations. Land Use Policy 29: 862-877. https://doi.org/10.1016/j.landusepol.2012.01.003 doi: 10.1016/j.landusepol.2012.01.003
|
| [10] |
Uddin K, Gurung DR, Giriraj A et al. (2013) Application of Remote Sensing and GIS for Flood Hazard Management: A Case Study from Sindh Province, Pakistan. American Journal of Geographic Information System 2: 1-5. https://doi.org/10.5923/j.ajgis.20130201.01 doi: 10.5923/j.ajgis.20130201.01
|
| [11] |
Samela CR, Sole A, Manferda S(2018) A GIS tool for Cost-effective delination of flood-prone areas. Comput Environ Urban Syst 70: 43-52. https://doi.org/10.1016/j.compenvurbsys.2018.01.013 doi: 10.1016/j.compenvurbsys.2018.01.013
|
| [12] | Zerger A, Smith DI (2003) Impediments to using GIS for real-time disaster decision support. Comput. Environ Urban Syst 27: 123-141. https://doi.org/10.1016/S0198-9715(01)00021-7 |
| [13] |
Marchi L, Borga M, Preciso E, et al. (2010) Characterization of selected extreme flash floods in Europe and implications for flood risk management. J Hydrol (Amst) 394: 118-133. https://doi.org/10.1016/j.jhydrol.2010.07.017 doi: 10.1016/j.jhydrol.2010.07.017
|
| [14] | Sayers P, Yuanyuan L, Galloway G, et al. (2013) Flood Risk Management: A Strategic Approach. |
| [15] | Wondim YK (2016) Flood Hazard and Risk Assessment Using GIS and Remote Sensing in Lower Awash Sub-basin. Ethiopia. Journal of Environment and Earth Science 6: 69-86. |
| [16] | Osti RP, Here's how governments can reduce the impacts of Asia's devastating flash floods. Asian Development Blog, 2021. Available from: https://blogs.adb.org/blog/how-governments-can-reduce-impacts-of-asia-s-devastating-flash-floods. |
| [17] | Aguirre J, Eco-Business. Planned dam in Philippine National Park draws flak from activists, officials. Eco-Business, 2021. Available from: https://www.eco-business.com/news/planned-dam-in-philippine-national-park-draws-flak-from-activists-officials/. |
| [18] | DENR-FMB technical bulletin No. 16-A, Forest Management Bureau. Google Docs, 2019. Available from: https://drive.google.com/file/d/1fzc75__TyQiY0ltD-OAbuLc2b9X2fmEp/view. |
| [19] | Brunner P, Advance in Hydrological Engineering. Unsteady Flow Hydraulics Model of Lower Columbia River System, 2015. Available from: https://www.hec.usace.army.mil/newsletters/HEC_Newsletter_Spring2013.pdf |
| [20] | Abebe FC, Flood Hazard Assessment Using GIS in Bacho Plain, Upper Awash Valley. Southwest of Addis Ababa, 2007. Addis Ababa University. Available from: http://etd.aau.edu.et/bitstream/handle/123456789/4707/Abebe%20Feyissa.pdf?sequence=1&isAllowed=y. |
| [21] | Chibssa AF (2007) Flood Hazard Assessment Using GIS in Bacho Plain, Upper Awash Valley, Southwest of Addis Ababa. Master of Science Thesis. Addis Ababa University, Addis Ababa. |
| [22] |
Ogato GS, Bantider A, Abebe K, et al. (2020) Geographic information system (GIS)-Based multicriteria analysis of flooding hazard and risk in Ambo Town and its watershed, West shoa zone, oromia regional State, Ethiopia. Journal of Hydrology: Regional Studies 27: 100659. https://doi.org/10.1016/j.ejrh.2019.100659 doi: 10.1016/j.ejrh.2019.100659
|
| [23] | Desalegn H, Mulu A (2021) Flood vulnerability assessment using GIS at Fetam watershed, upper Abbay basin, Ethiopia. Heliyon 7: e05865. https://doi.org/10.1016/j.heliyon.2020.e05865 |
| [24] | Gamesby R. Flooding, River flooding-why it happens and patterns. Coolgeography.co.uk. Available from: https://www.coolgeography.co.uk/GCSE/AQA/Water%20aon%20the%20Land/Flooding/Flooding.htm. |
| [25] | Office of disaster preparedness and management-ODPM, Welcome to Office of Disaster Preparedness and Management-ODPM Office of Disaster Preparedness and Management-ODPM. Flooding, 2021. Available from: https://www.odpm.gov.tt/node/16. |
| [26] | Gigovixc L, Pamuˇcar D, Bajixc Z, et al. (2017) Application of GIS-Interval rough AHP methodology for flood hazard mapping in urban areas. Water 9: 1-26. https://doi.org/10.3390/w9060360 |
| [27] |
Hall J, Arheimer B, Borga M, et al. (2014) Understanding flood regime changes in Europe: a state-of-the-art assessment. Hydrol Earth Syst Sci Discuss 18: 2735-2772. https://doi.org/10.5194/hess-18-2735-2014 doi: 10.5194/hess-18-2735-2014
|
| [28] |
Ouma YO, Tateishi R (2014) Urban flood vulnerability and risk mapping using integrated multi-parametric AHP and GIS: methodological overview and case study assessment. Water 6: 1515-1545. https://doi.org/10.3390/w6061515 doi: 10.3390/w6061515
|
| [29] | Few R, Ahern M, Matthies F, et al. (2004) Floods, health and climate change: a strategic review. |
| [30] |
Guo E, Zhang J, Ren X, et al. (2014) Integrated risk assessment of flood disaster based on improved set pair analysis and the variable fuzzy set theory in central Liaoning Province, China. Nat Hazards 74: 947-965. https://doi.org/10.1007/s11069-014-1238-9 doi: 10.1007/s11069-014-1238-9
|
| [31] |
Dang NM, Babel MS, Luong HT (2011) Evaluation of flood risk parameters in the day river flood diversion area, Red River Delta, vietnam. Nat Hazards Dordr 56: 169-194. https://doi.org/10.1007/s11069-010-9558-x doi: 10.1007/s11069-010-9558-x
|
| [32] | The Global New Light of Myanmar, Impact of flash floods, taking effective long-term measures. Reliefweb, 2018. Available from: https://.int/report/myanmar/impact-flash-floods-taking-effective-long-term-measures#:~:text=A%20flash%20flood%20occurs%20when,rivers%20to%20overflow%20their%20banks. |
| [33] | Tucci CE (2007) Urban flood management. WMO and Capnet. |
| [34] | Jha AK, Bloch R, Lamond J (2012) Cities and flooding: a guide to integrated urban flood risk management for the 21st century, World Bank Publications. |
| [35] |
Mngutyo ID, Ogwuche JA (2013) Urban development, flood and disaster management: challenges of contemporary urban planning perspectives. International Journal of Innovative Environmental Studies Research 1: 1-6. https://doi.org/10.4172/2324-9315.1000113 doi: 10.4172/2324-9315.1000113
|
| [36] | Fura GD (2013) Analysing and modelling urban land cover change for run-off modelling in Kampala, Uganda (Master's thesis, University of Twente). |
| [37] |
Rogger M, Agnoletti M, Alaoui A, et al. (2017) Land use change impacts on floods at the catchment scale: Challenges and opportunities for future research. Water Resour Res 53: 5209-5219. https://doi.org/10.1002/2017WR020723 doi: 10.1002/2017WR020723
|
| [38] |
Bradshaw CJA, Sodhi NS, Peh KSH, et al (2007) Global evidence that deforestation amplifies flood risk and severity in the developing world. Glob Chang Biol 13: 2379-2395. https://doi.org/10.1111/j.1365-2486.2007.01446.x doi: 10.1111/j.1365-2486.2007.01446.x
|
| [39] |
Hoa NT, Vinh NQ (2018) The notions of resilience in spatial planning for drought-flood coexistence (DFC) at regional scale. In IOP Conference Series: Earth and Environmental Science 143: 012066. https://doi.org/10.1088/1755-1315/143/1/012066 doi: 10.1088/1755-1315/143/1/012066
|
| [40] |
Wheater H, Evans E (2009) Land use, water management and future flood risk. Land Use Policy 26: 251-264. https://doi.org/10.1016/j.landusepol.2009.08.019 doi: 10.1016/j.landusepol.2009.08.019
|
| [41] | Curell Christina, Why is soil water holding capacity important? Michigan State University Extension, 2011. Available from: https://www.canr.msu.edu/news/why_is_soil_water_holding_capacity_important#:~:text=Soil%20water%20holding%20capacity%20is,maximum%20for%20the%20entire%20field. |
| [42] | Vanderlinde C, How you can improve clay garden soil. The Spruce, 2021. Available from: https://www.thespruce.com/understanding-and-improving-clay-soil-2539857. |
| [43] | Knoop BAJ (2013) Climate Change and Territorial Effects on Regions and Local Economies. ESPON Climate. |
| [44] |
Crawford MH, Crowley K, Potter SH, et al. (2018) Risk modelling as a tool to support natural hazard risk management in New Zealand local government. International Journal of Disaster Risk Reduction 28: 610-619. https://doi.org/10.1016/j.ijdrr.2018.01.011 doi: 10.1016/j.ijdrr.2018.01.011
|


Figures(15) / Tables(3)

Gene T. Señeris. Nabaoy River Watershed potential impact to flooding using Geographic Information System remote sensing[J]. AIMS Environmental Science, 2022, 9(3): 381-402. doi: 10.3934/environsci.2022024


 DownLoad: