Beta-thalassemia major (β-TM) is a genetic disorder, prevalent especially in the Mediterranean region, Southeast Asia, and the Indian subcontinent. With improvements in management over the years, β-TM has transitioned from a fatal childhood disease to a chronic condition. However, in Pakistan, there is still a lack of a comprehensive national policy and strategic plan, which has resulted in a growing number of β-TM patients, placing a substantial burden on individuals and the national healthcare system. This scoping review is aimed to understand obstacles faced by β-TM patients in Pakistan. For this review, 26 unique articles were identified by using the PRISMA flow guidelines. PubMed and Google Scholar were used with the MESH term Beta-Thalassemia Major AND Pakistan, and the duration was set between 2012–2022. Then, the reviewers created a spreadsheet using Microsoft Excel to add in the data from the studies selected. Inductive and deductive approaches were used for thematic analysis. Additionally, we critically analyzed the current landscape of β-TM in Pakistan. The main challenges in β-TM care in Pakistan are suboptimal transfusion services and a poor complication management. Due to the need of chronic blood transfusions, transfusion-transmitted infection (TTI) incidence within this patient population is high. These largely include hepatitis C, hepatitis B, and the Human immunodeficiency virus (HIV). TTIs impact the quality of life of these patients and their overall survival. Furthermore, psychosocial morbidities are also prevalent in β-TM patients, with increased levels of hostility, anxiety, and depressive symptoms, thus emphasizing the critical need for sustained psychological support. Access to quality treatments is constrained, with notable disparities between public and private sector hospitals. Additionally, the financial burden on β-TM patients is considerable, which contributes to economic strain and more hardships on the already suffering families. The review concludes that the absence of a unified national policy exacerbates these challenges, which results in an escalating burden of β-TM nationwide. To address these issues, essential recommendations include the following: the implementation of a standardized protocol for β-TM care, the enhancement of access to quality care, the provision of iron chelation therapy, and safeguarding safe blood transfusion practices. Prevention programs, along with increased public awareness and education about β-TM and carrier screening, are pivotal. Collaborative efforts with international partners and drawing insights from successful strategies in countries with similar β-TM burdens can aid in mitigating the overall impact of β-TM in Pakistan and improving the quality of life of the affected individuals.
Citation: Ali Hussain Ansari, Saqib Hussain Ansari, Mubarak Jabeen Salman, Muhammad Usman Hussain Ansari, Rawshan Jabeen. A scoping review on the obstacles faced by beta thalassemia major patients in Pakistan- Matter of policy investment[J]. AIMS Public Health, 2024, 11(4): 1105-1124. doi: 10.3934/publichealth.2024057
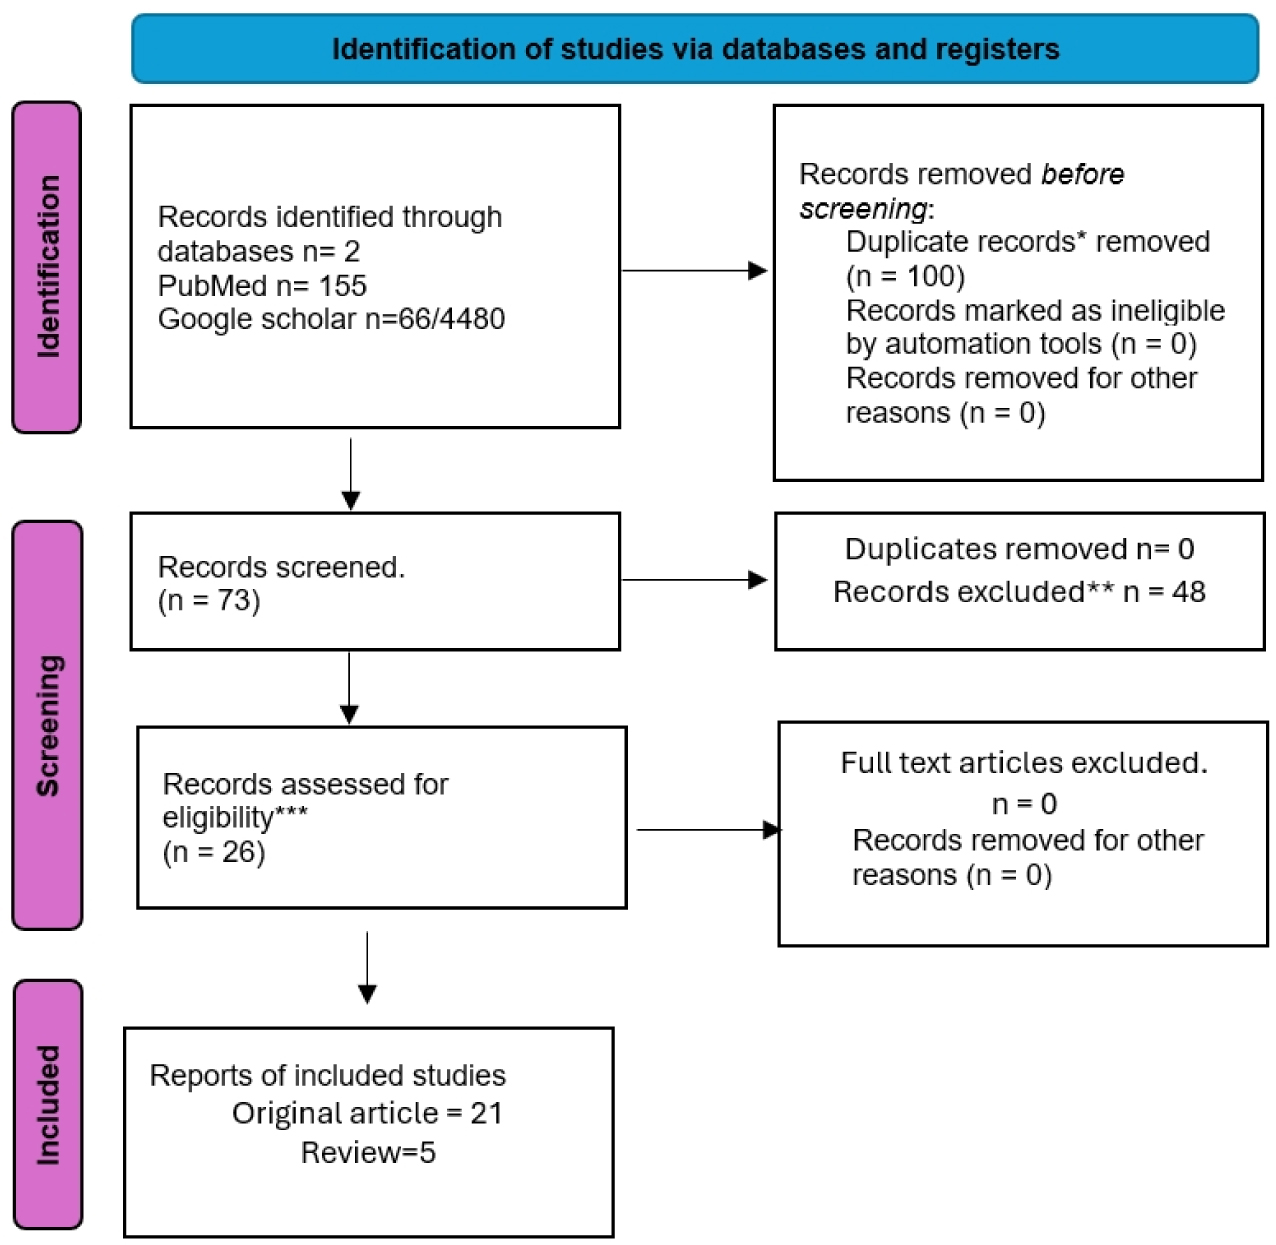
Beta-thalassemia major (β-TM) is a genetic disorder, prevalent especially in the Mediterranean region, Southeast Asia, and the Indian subcontinent. With improvements in management over the years, β-TM has transitioned from a fatal childhood disease to a chronic condition. However, in Pakistan, there is still a lack of a comprehensive national policy and strategic plan, which has resulted in a growing number of β-TM patients, placing a substantial burden on individuals and the national healthcare system. This scoping review is aimed to understand obstacles faced by β-TM patients in Pakistan. For this review, 26 unique articles were identified by using the PRISMA flow guidelines. PubMed and Google Scholar were used with the MESH term Beta-Thalassemia Major AND Pakistan, and the duration was set between 2012–2022. Then, the reviewers created a spreadsheet using Microsoft Excel to add in the data from the studies selected. Inductive and deductive approaches were used for thematic analysis. Additionally, we critically analyzed the current landscape of β-TM in Pakistan. The main challenges in β-TM care in Pakistan are suboptimal transfusion services and a poor complication management. Due to the need of chronic blood transfusions, transfusion-transmitted infection (TTI) incidence within this patient population is high. These largely include hepatitis C, hepatitis B, and the Human immunodeficiency virus (HIV). TTIs impact the quality of life of these patients and their overall survival. Furthermore, psychosocial morbidities are also prevalent in β-TM patients, with increased levels of hostility, anxiety, and depressive symptoms, thus emphasizing the critical need for sustained psychological support. Access to quality treatments is constrained, with notable disparities between public and private sector hospitals. Additionally, the financial burden on β-TM patients is considerable, which contributes to economic strain and more hardships on the already suffering families. The review concludes that the absence of a unified national policy exacerbates these challenges, which results in an escalating burden of β-TM nationwide. To address these issues, essential recommendations include the following: the implementation of a standardized protocol for β-TM care, the enhancement of access to quality care, the provision of iron chelation therapy, and safeguarding safe blood transfusion practices. Prevention programs, along with increased public awareness and education about β-TM and carrier screening, are pivotal. Collaborative efforts with international partners and drawing insights from successful strategies in countries with similar β-TM burdens can aid in mitigating the overall impact of β-TM in Pakistan and improving the quality of life of the affected individuals.

| [1] | Hashim S, Sarwar M, Arsalan A, et al. (2018) Frequency of carrier screening and preventive orientation among first degree relatives of Thalassaemia patients. J Pak Med Assoc 68: 50-54. |
| [2] | Debnath M (2021) Prevalence of thalassemia in Indian population-A review. North Bengal Anthropologist 2021: 99-112. |
| [3] | Khalid A, Butt AMK, Shahid R, et al. (2020) Thalassemia: Current Situation in Pakistan. Lahore Garrison Univ J Life Sci 4: 309-318. https://doi.org/10.54692/lgujls.2020.0404126 |
| [4] |
Ali N, Moiz B, Bin Azhar W, et al. (2012) Carrier detection for beta-thalassemia trait in general Pakistani population: a way forward. Hematology 17: 237-240. https://doi.org/10.1179/1607845412Y.0000000002 
|
| [5] | Safdar S, Mirbahar A, Sheikh MA, et al. (2017) Economic Burden of Thalassemia on Parents of Thalassemic Children: A Multi-Centre Study. Pakistan J Med Res . |
| [6] |
Black ML, Sinha S, Agarwal S, et al. (2010) A descriptive profile of β-thalassaemia mutations in India, Pakistan and Sri Lanka. J Community Genet 1: 149-157. https://doi.org/10.1007/s12687-010-0026-9
|
| [7] |
Waheed U, Saba N, Wazeer A, et al. (2021) A systematic review and meta-analysis on the epidemiology of hepatitis B and hepatitis C virus among beta-thalassemia major patients in Pakistan. J Lab Physicians 13: 270-276. https://doi.org/10.1055/s-0041-1731110
|
| [8] |
Riaz M, Tiller J, Ajmal M, et al. (2019) Implementation of public health genomics in Pakistan. Eur J Hum Genet 27: 1485-1492. https://doi.org/10.1038/s41431-019-0428-z
|
| [9] | Ejaz MS, Baloch S, Arif F (2015) Efficacy and adverse effects of oral chelating therapy (deferasirox) in multi-transfused Pakistani children with β-thalassemia major. Pakistan J Med Sci 31: 621. https://doi.org/10.12669/pjms.313.6972 |
| [10] | Sharif Y, Irshad S, Muazzam A, et al. (2021) Assessment of patients with β-thalassemia major, undergoing tertiary care at a regional thalassemia center in Pakistan. Pakistan J Zool 53: 245. https://doi.org/10.17582/journal.pjz/20190630160603 |
| [11] | Asif N, Hassan K (2016) Management of thalassemia in Pakistan. J Islamabad Med Dent Coll 5: 152-153. |
| [12] |
Ahmed Kiani R, Anwar M, Waheed U, et al. (2016) Epidemiology of transfusion transmitted infection among patients with β-thalassaemia major in Pakistan. J Blood Transfus 2016: 8135649. https://doi.org/10.1155/2016/8135649
|
| [13] | Nazir S, Faraz A, Shahzad N, et al. (2014) Prevalence of HCV in β-thalassemia major patients visiting tertiary care hospitals in Lahore–Pakistan. Adv Life Sci 1: 197-201. |
| [14] |
Ehsan H, Wahab A, Shafqat MA, et al. (2020) Prevalence of transfusion transmissible infections in beta-thalassemia major patients in Pakistan: a systematic review. Blood 136: 23-25. https://doi.org/10.1182/blood-2020-138911
|
| [15] |
Yasmeen H, Hasnain S (2018) Quality of life of Pakistani children with β-thalassemia major. Hemoglobin 42: 320-325. https://doi.org/10.1080/03630269.2018.1553183
|
| [16] | Adil A, Sobani ZA, Jabbar A, et al. (2012) Endocrine complications in patients of beta thalassemia major in a tertiary care hospital in Pakistan. J Pak Med Assoc 62: 307-310. |
| [17] | Khalil S, Khan HS, Akhtar P (2016) Status of hepatitis B and C in beta thalassemia major patients. J Islamabad Med Dent Coll 5: 71-73. |
| [18] |
Ahmed S, Ayub M, Naeem M, et al. (2021) Thalassemia patients from baluchistan in Pakistan are infected with multiple hepatitis B or C virus strains. Am J Trop Med Hyg 104: 1569. https://doi.org/10.4269/ajtmh.20-0740
|
| [19] |
Manzoor A, Khizar N, Abbasi NB, et al. (2022) Frequency of Hypoparathyroidism in Children Presenting with Beta-Thalassemia Major in Tertiary Care Center. Pak J Med Health Sci 16: 955-958. https://doi.org/10.53350/pjmhs22161955
|
| [20] | Siddiqui SH, Ishtiaq R, Sajid F, et al. (2014) Quality of life in patients with thalassemia major in a developing country. J Coll Physicians Surg Pak 24: 477-480. |
| [21] |
Hoodbhoy Z, Ehsan L, Alvi N, et al. (2020) Establishment of a thalassaemia major quality improvement collaborative in Pakistan. Arch Dis Child 105: 487-493. https://doi.org/10.1136/archdischild-2018-315743
|
| [22] | Khan AM, Abbas Z, Ramzan S, et al. (2021) Social epidemiological analysis of risk factors and psychosocial burden of beta thalassemia major (BTM) in Pakistan. Elem Educ Online 20: 2682. |
| [23] | Batool I, Ishfaq K, Bajwa RS (2017) Psychosocial burden among thalassemia major patients: An exploratory investigation of south Punjab, Pakistan. Pakistan Ped J 41: 158-162. |
| [24] | Sultana R, Humayun S, Noor T, et al. (2016) Impact of thalassaemia on quality of Life. J Soc Obstetricians Gynaecologists Pakistan 6: 156-160. |
| [25] | Ishfaq K, Diah NM, Ali J, et al. (2018) Psychosocial problems faced by thalassemia major patients of district Multan, Pakistan. Pakistan Ped J 42: 22-26. |
| [26] |
Tanveer T, Masud H, Butt ZA (2018) Are people getting quality thalassemia care in twin cities of Pakistan? A comparison with international standards. Int J Qual Health Care 30: 200-207. https://doi.org/10.1093/intqhc/mzx198
|
| [27] | Saleem N, Anwar A, Shahid NUA, et al. (2021) Perception of parents of thalassemic child to thalassemia in Pakistan. Cureus 13: e17615. https://doi.org/10.7759/cureus.17615 |
| [28] |
Biswas B, Naskar NN, Basu K, et al. (2022) Transfusion-transmitted infections, its risk factors and impact on quality of life: An epidemiological study among β-thalassemia major children. Asian J Transfus Sci 16: 99. https://doi.org/10.4103/ajts.AJTS_74_18
|
| [29] |
Zaheer HA, Waheed U, Abdella YE, et al. (2020) Thalassemia in Pakistan: A forward-looking solution to a serious health issue. Glob J Transfus Med 5: 108-110. https://doi.org/10.4103/GJTM.GJTM_72_19
|
| [30] | Bukhari GMJ (2022) Quality of life among beta-thalassemic major children presenting at Federal Government Hospital Islamabad, Pakistan. J Pak Med Assoc 72: 2241-2244. https://doi.org/10.47391/JPMA.5248 |
| [31] |
Qamar MK, Shaikh BT (2022) Out of Pocket Expenditure on Thalassemia Major and Its Implications on The Household Economics. J Ayub Med Coll Abbottabad 34: 91-94. https://doi.org/10.55519/JAMC-01-8332
|
| [32] | Al-Moshary M, Al-Mussaed E, Khan A (2019) Prevalence of transfusion transmitted infections and the quality of life in β-thalassemia major patients. Cureus 11: e6129. https://doi.org/10.7759/cureus.6129 |
| [33] | Adib-Hajbaghery M, Ahmadi M, Poormansouri S (2015) Health related quality of life, depression, anxiety and stress in patients with beta-thalassemia major. Iran J Ped Hematol Oncol 5: 193. |
| [34] |
Ali SA, Azim D, Hassan H, et al. (2021) The impact of COVID-19 on transfusion-dependent thalassemia patients of Karachi, Pakistan: A single-center experience. Transfus Clin Biol 28: 60-67. https://doi.org/10.1016/j.tracli.2020.10.006
|
| [35] |
Ahmed S, Jafri H, Faran M, et al. (2022) Cascade screening for beta-thalassaemia in Pakistan: relatives' experiences of a decision support intervention in routine practice. Eur J Hum Genet 30: 406-412. https://doi.org/10.1038/s41431-021-00974-y
|
| [36] |
Khaliq SJH (2022) Thalassemia in Pakistan. Hemoglobin 46: 12-14. https://doi.org/10.1080/03630269.2022.2059670
|
| [37] |
Reed-Embleton H, Arambepola S, Dixon S, et al. (2020) A cost-of-illness analysis of β-Thalassaemia major in children in Sri Lanka–experience from a tertiary level teaching hospital. BMC Pediatr 20: 257. https://doi.org/10.1186/s12887-020-02160-3
|
| [38] |
Nhac-Vu HT, Tran VTN, Nguyen TDT, et al. (2023) Economic burden of Thalassemia treatment: An analysis from the Vietnam Social Security perspective. PLoS One 18: e0293916. https://doi.org/10.1371/journal.pone.0293916
|
| [39] |
Alaei K, Sarwar M, Alaei A (2018) The urgency to mitigate the spread of hepatitis C in Pakistan through blood transfusion reform. Int J Health Policy Manag 7: 207. https://doi.org/10.15171/ijhpm.2017.120
|
| [40] | Ghafoor M, Sabar MF, Sabir F (2021) Prevention programmes and prenatal diagnosis for beta thalassemia in Pakistan: A narrative review. J Pak Med Assoc 71: 326-331. |
| [41] |
Gambari R, Waziri AD, Goonasekera H, et al. (2024) Pharmacogenomics of Drugs Used in β-Thalassemia and Sickle-Cell Disease: From Basic Research to Clinical Applications. Int J Mol Sci 25: 4263. https://doi.org/10.3390/ijms25084263
|
| [42] | Rehman MEU, Sabir B, Fazal F, et al. (2022) Impact of COVID-19 restrictions on healthcare delivery for thalassemia major patients: A perspective from Pakistan. Ann Med Surg 82: 104636. https://doi.org/10.1016/j.amsu.2022.104636 |
| [43] | Hammad M, Arif R, Bano S, et al. (2023) Aftermath of the COVID-19 pandemic on mental health and well-being of patients with thalassemia major in Pakistan: a qualitative study. Cureus 15: e35048. https://doi.org/10.7759/cureus.35048 |
| [44] | Nashwan AJ, Yassin MA, Babu GDJ, et al. (2018) Quality of life among adolescents aged 14 to 18 years with beta-thalassemia major (TM) in Qatar. Acta Biomed 89: 16-26. |
| [45] |
ul Hassan Rashid MA, Abbasi SRS, Manzoor MM (2020) Socio-religious prognosticators of psychosocial burden of beta thalassemia major. J Relig Health 59: 2866-2881. https://doi.org/10.1007/s10943-020-01069-6
|
| [46] |
Ahmed S, Saleem M, Sultana N, et al. (2000) Prenatal diagnosis of beta-thalassaemia in Pakistan: experience in a Muslim country. Prenat Diagn 20: 378-383. https://doi.org/10.1002/(SICI)1097-0223(200005)20:5<378::AID-PD815>3.0.CO;2-7
|
| [47] |
Ali G, Tariq MA, Shahid K, et al. (2021) Advances in genome editing: The technology of choice for precise and efficient β-thalassemia treatment. Gene Ther 28: 6-15. https://doi.org/10.1038/s41434-020-0153-9
|
| [48] |
Hardouin G, Antoniou P, Martinucci P, et al. (2023) Adenine base editor–mediated correction of the common and severe IVS1-110 (G> A) β-thalassemia mutation. Blood 141: 1169-1179. https://doi.org/10.1182/blood.2022016629
|
| [49] |
Abbas Z, Rahman A, Aslam B, et al. (2024) Precision genome editing offers hope for treatment of β-thalassemia and other genetic disorders. Mol Ther Nucleic Acids 35: 102204. https://doi.org/10.1016/j.omtn.2024.102204
|
| [50] |
Arif T, Farooq A, Ahmad FJ, et al. (2023) Prime editing: A potential treatment option for β-thalassemia. Cell Biol Int 47: 699-713. https://doi.org/10.1002/cbin.11972
|
| [51] |
Halim-Fikri BH, Lederer CW, Baig AA, et al. (2022) Global globin network consensus paper: classification and stratified roadmaps for improved thalassaemia care and prevention in 32 countries. J Pers Med 12: 552. https://doi.org/10.3390/jpm12040552
|
Figures(1) / Tables(1)

Ali Hussain Ansari, Saqib Hussain Ansari, Mubarak Jabeen Salman, Muhammad Usman Hussain Ansari, Rawshan Jabeen. A scoping review on the obstacles faced by beta thalassemia major patients in Pakistan- Matter of policy investment[J]. AIMS Public Health, 2024, 11(4): 1105-1124. doi: 10.3934/publichealth.2024057


 DownLoad: