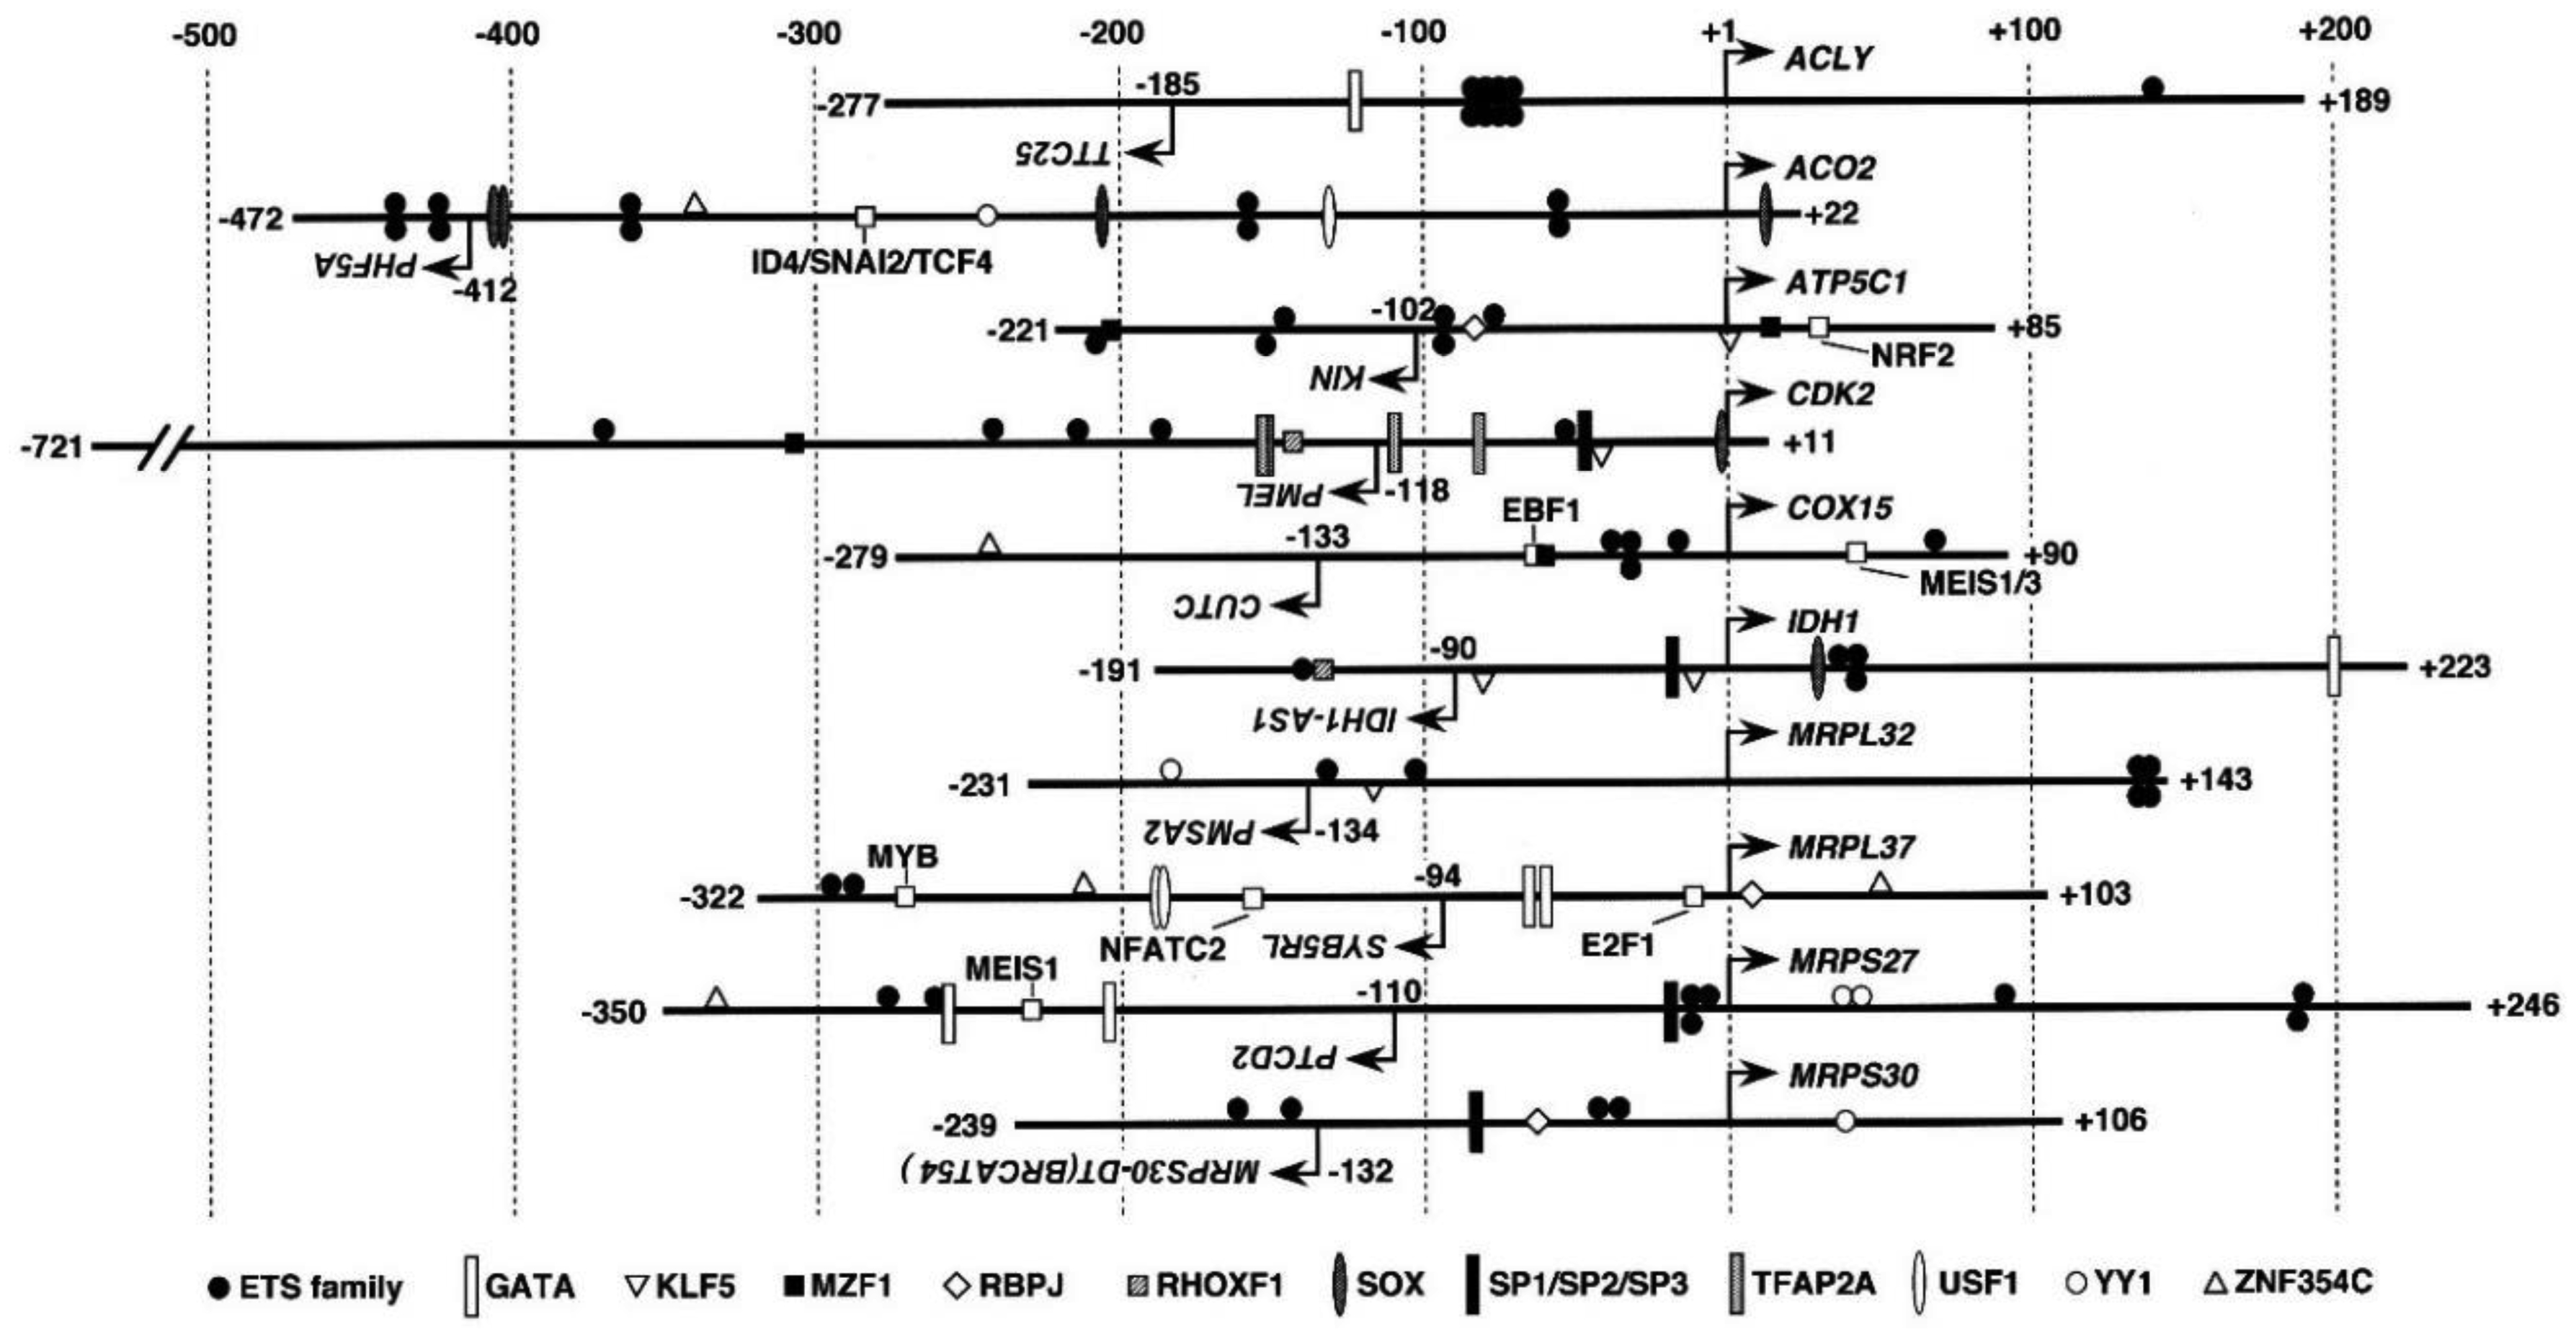
In cancer, the production of ATP depends mainly on glycolysis, usually accompanied by the dysfunction of the tricarboxylic acid (TCA) cycle and oxidative phosphorylation (OXPHOS). Nicotinamide adenine dinucleotide (NAD+) is a coenzyme for various biological enzymatic reactions such as those involved in the TCA cycle. To investigate the molecular mechanisms involved in carcinogenesis, the transcription system of genes associated with mitochondrial function should be elucidated. In this study, we isolated several mitochondrial function-associated bidirectional promoters and tested whether they responded to NAD+-metabolism regulating compounds, namely, trans-resveratrol (Rsv), 2-deoxy-D-glucose (2DG), 3-amino benzamide (3AB), and olaparib (OLA), in HeLa S3 cells. Transient transfection and luciferase (Luc) reporter assay showed that the IDH1 promoter was prominently activated by these compounds. The IDH1 gene, which encodes a nicotinamide adenine dinucleotide phosphate (NADP+) dependent isocitrate dehydrogenase, is frequently mutated in glioma and leukemia cells. In this study, RT-PCR showed that IDH1 gene and protein expression was induced in response to the NAD+-regulating drugs Rsv and 3AB. However, IDH1 protein amount was rather stable at control level. The result suggested that a post-transcriptional controlling system works to keep IDH1 at a stable level.
Citation: Yutaka Takihara, Ryuji Otani, Takuro Ishii, Shunsuke Takaoka, Yuki Nakano, Kaori Inoue, Steven Larsen, Yoko Ogino, Masashi Asai, Sei-ichi Tanuma, Fumiaki Uchiumi. Characterization of the human IDH1 gene promoter[J]. AIMS Molecular Science, 2023, 10(3): 186-204. doi: 10.3934/molsci.2023013
In cancer, the production of ATP depends mainly on glycolysis, usually accompanied by the dysfunction of the tricarboxylic acid (TCA) cycle and oxidative phosphorylation (OXPHOS). Nicotinamide adenine dinucleotide (NAD+) is a coenzyme for various biological enzymatic reactions such as those involved in the TCA cycle. To investigate the molecular mechanisms involved in carcinogenesis, the transcription system of genes associated with mitochondrial function should be elucidated. In this study, we isolated several mitochondrial function-associated bidirectional promoters and tested whether they responded to NAD+-metabolism regulating compounds, namely, trans-resveratrol (Rsv), 2-deoxy-D-glucose (2DG), 3-amino benzamide (3AB), and olaparib (OLA), in HeLa S3 cells. Transient transfection and luciferase (Luc) reporter assay showed that the IDH1 promoter was prominently activated by these compounds. The IDH1 gene, which encodes a nicotinamide adenine dinucleotide phosphate (NADP+) dependent isocitrate dehydrogenase, is frequently mutated in glioma and leukemia cells. In this study, RT-PCR showed that IDH1 gene and protein expression was induced in response to the NAD+-regulating drugs Rsv and 3AB. However, IDH1 protein amount was rather stable at control level. The result suggested that a post-transcriptional controlling system works to keep IDH1 at a stable level.

| [1] |
Seyfried TN (2015) Cancer as a mitochondrial metabolic disease. Front Cell Dev Biol 3: 43. https://doi.org/10.3389/fcell.2015.00043 
|
| [2] |
Yaku K, Okabe K, Nakagawa T (2018) NAD metabolism: Implications in aging and longevity. Ageing Res Rev 47: 1-17. https://doi.org/10.1016/j.arr.2018.05.006
|
| [3] | Takihara Y, Sudo D, Arakawa J, et al. (2018) Nicotinamide adenine dinucleotide (NAD+) and cell aging. New research on cell aging and death : 131-158. Available from: https://novapublishers.com/wp-content/uploads/2018/11/978-1-53613-626-5_short_commentary.pdf |
| [4] |
Stefani M, Markus MA, Lin RCY, et al. (2007) The effect of resveratrol on a cell model of human aging. Ann NY Acad Sci 1114: 407-418. https://doi.org/10.1196/annals.1396.001
|
| [5] |
Saiko P, Szakmary A, Jaeger W, et al. (2008) Resveratrol and its analogs: defense against cancer, coronary disease and neurodegenerative maladies or just a fad?. Mutat Res/Rev Mutat Res 658: 68-94. https://doi.org/10.1016/j.mrrev.2007.08.004
|
| [6] |
Kundu JK, Surh YJ (2008) Cancer chemopreventive and therapeutic potential of resveratrol: Mechanistic perspectives. Cancer Lett 269: 243-261. https://doi.org/10.1016/j.canlet.2008.03.057
|
| [7] |
Pezzuto JM (2008) Resveratrol as an inhibitor of carcinogenesis. Pharm Biol 46: 443-573. https://doi.org/10.1080/13880200802116610
|
| [8] |
Jang M, Cai L, Udeani GO, et al. (1997) Cancer chemopreventive activity of resveratrol, a natural product derived from grapes. Science 275: 218-220. https://doi.org/10.1126/science.275.5297.218
|
| [9] |
Ben Sahra I, Laurent K, Giuliano S, et al. (2010) Targeting cancer cell metabolism: The combination of metformin and 2-deoxyglucose induces p53-dependent apoptosis in prostate cancer cells. Cancer Res 70: 2465-2475. https://doi.org/10.1158/0008-5472.CAN-09-2782
|
| [10] |
Raez LE, Papadopoulos K, Ricart AD, et al. (2013) A phase I dose-escalation trial of 2-deoxy-D-glucose alone or combined with docetaxel in patients with advanced solid tumors. Cancer Chemother Pharmacol 71: 523-530. https://doi.org/10.1007/s00280-012-2045-1
|
| [11] |
Inal V, Mas MR, Isik AT, et al. (2015) A new combination therapy in severe acute pancreatitis—hyperbaric oxygen plus 3-Aminobenzamide. Pancreas 44: 326-330. http://doi.org/10.1097/MPA.0000000000000240
|
| [12] | Meng X, Song W, Deng B, et al. (2015) 3-aminobenzamide, one of poly (ADP-ribose) polymerase-1 inhibitors, rescues apoptosis in rat models of spinal cord injury. Int J Clin Exp Pathol 8: 12207-12215. |
| [13] |
Tanuma S, Sato A, Oyama T, et al. (2016) New insights into the roles of NAD+-poly(ADP-ribose) metabolism and poly(ADP-ribose) glycohydrolase. Curr Protein Pep Sci 17: 668-682. https://doi.org/10.2174/1389203717666160419150014
|
| [14] |
Jiang X, Li X, Li W, et al. (2019) PARP inhibitors in ovarian cancer: Sensitivity prediction and resistance mechanisms. J Cell Mol Med 23: 2303-2313. https://doi.org/10.1111/jcmm.14133
|
| [15] |
Arun B, Akar U, Gutierrez-Barrera AM, et al. (2015) The PARP inhibitor AZD2281 (Olaparib) induces autophagy/mitophagy in BRCA1 and BRCA2 mutant breast cancer cells. Int J Oncol 47: 262-268. https://doi.org/10.3892/ijo.2015.3003
|
| [16] | Uchiumi F, Larsen S, Tanuma S (2014) Application of DEAE-dextran to an efficient gene transfer system. Dextran: Chemical structure, application and potential side effects : 143-156. Available from: http://novapublishers.com/wp-content/uploads/2019/05/978-1-62948-960-5_ch5.pdf |
| [17] |
Uchiumi F, Shoji K, Sasaki Y, et al. (2016) Characterization of the 5′-flanking region of the human TP53 gene and its response to the natural compound, Resveratrol. J Biochem 159: 437-447. https://doi.org/10.1093/jb/mvv126
|
| [18] |
Desquiret-Dumas V, Gueguen N, Leman G, et al. (2013) Resveratrol induces a mitochondrial complex I-dependent increase in NADH oxidation responsible for sirtuin activation in liver cells. J Biol Chem 288: 36662-36675. https://doi.org/10.1074/jbc.M113.466490
|
| [19] |
Di LJ, Fernandez AG, de Siervi A, et al. (2010) Transcriptional regulation of BRCA1 expression by a metabolic switch. Nat Struct Mol Biol 17: 1406-1413. https://doi.org/10.1038/nsmb.1941
|
| [20] |
Herceg Z, Wang ZQ (1999) Failure of poly(ADP-ribose) polymerase cleavage by caspases leads to induction of necrosis and enhanced apoptosis. Mol Cell Biol 19: 5124-5133. https://doi.org/10.1128/MCB.19.7.5.5124
|
| [21] |
Hamada H, Goto Y, Arakawa J, et al. (2019) Characterization of the human E2F4 promoter region and its response to 12-O-tetradecanoylphorbol-13-acetate. J Biochem 166: 363-373. https://doi.org/10.1093/jb/mvz047
|
| [22] |
Uchiumi F, Watanabe T, Tanuma S (2010) Characterization of various promoter regions of the human DNA helicase-encoding genes and identification of duplicated ets (GGAA) motifs as an essential transcription regulatory element. Exp Cell Res 316: 1523-1534. https://doi.org/10.1016/j.yexcr.2010.03.009
|
| [23] |
Livak KJ, Schmittgen TD (2001) Analysis of relative gene expression data using real-time quantitative PCR and the 2−ΔΔCT method. Methods 25: 402-408. https://doi.org/10.1006/meth.2001.1262
|
| [24] |
Uchiumi F, Fujikawa M, Miyazaki S, et al. (2014) Implication of bidirectional promoters containing duplicated GGAA motifs of mitochondrial function-associated genes. AIMS Mol Sci 1: 1-26. https://doi.org/10.3934/molsci.2013.1.1
|
| [25] |
Krell D, Assoku M, Galloway M, et al. (2011) Screen for IDH1, IDH2, IDH3, D2HGDH and L2HGDH mutations in glioblastoma. PLoS One 6: e19868. https://doi.org/10.1371/journal.pone.0019868
|
| [26] |
Cai Q, Zhao M, Liu X, et al. (2017) Reduced expression of citrate synthase leads to excessive superoxide formation and cell apoptosis. Biochem Biophys Res Commun 485: 388-394. https://doi.org/10.1016/j.bbrc.2017.02.067
|
| [27] |
Wang T, Yu Q, Li J, et al. (2017) O-GlcNAcylation of fumarase maintains tumor growth under glucose deficiency. Nat Cell Biol 19: 833-843. https://doi.org/10.1038/ncb3562
|
| [28] | Uchiumi F, Larsen S, Masumi A, et al. (2013) The putative implications of duplicated GGAA-motifs located in the human interferon regulated genes (ISGs). Genomics I-humans, animals and plants : 87-105. |
| [29] | Uchiumi F, Larsen S, Tanuma S (2015) Transcriptional regulation of the human genes that encode DNA repair- and mitochondrial function-associated proteins. Advances in DNA repair : 129-167. https://doi.org/10.5772/59588 |
| [30] |
Yang C, Bolotin E, Jiang T, et al. (2007) Prevalence of the initiator over the TATA box in human and yeast genes and identification of DNA motifs enriched in human TATA-less core promoters. Gene 389: 52-65. https://doi.org/10.1016/j.gene.2006.09.029
|
| [31] | Hamada H, Yamamura M, Ohi H, et al. (2019) Characterization of the human zinc finger nfx-1-type containing 1 gene promoter and its response to 12-O-tetradecanoyl-13-acetate in HL-60 cells. Int J Oncol 55: 869-974. https://doi.org/10.3892/ijo.2019.4860 |
| [32] |
Uchiumi F, Arakawa J, Iwakoshi S, et al. (2016) Characterization of the 5′-flanking region of the human DNA helicase B (HELB) gene and its response to trans-resveratrol. Sci Rep 6: 24510. https://doi.org/10.1038/srep24510
|
| [33] |
Uchiumi F, Katsuda C, Akui M, et al. (2020) Effect of the natural compound trans-resveratrol on human MCM4 gene transcription. Oncol Rep 44: 283-292. https://doi.org/10.3892/or.2020.7598
|
| [34] |
Wünschiers R (2012) Carbohydrate metabolism and citrate cycle. Biochemical pathways: An atlas of biochemistry and molecular biology : 37-58.
|
| [35] | Jahn M, Jahn D (2012) Electron transfer reactions and oxidative phosphorylation. Biochemical pathways: An atlas of biochemistry and molecular biology : 183-188. |
| [36] |
Goldschmidt-Reisin S, Kitakawa M, Herfurth E, et al. (1998) Mammalian mitochondrial ribosomal proteins. N-terminal amino acid sequencing, characterization, and identification of corresponding gene sequences. J Biol Chem 273: 34828-34836. https://doi.org/10.1074/jbc.273.52.34828
|
| [37] |
Lightowlers RN, Chrzanowska-Lightowlers ZM (2013) Human pentatricopeptide proteins: Only a few and what do they do?. RNA Biol 10: 1433-1438. https://doi.org/10.4161/rna.24770
|
| [38] |
Muley P, Olinger A, Tummala H (2015) 2-Deoxyglucose induces cell cycle arrest and apoptosis in colorectal cancer cells independent of its glycolysis inhibition. Nutr. Cancer 67: 514-522. https://doi.org/10.1080/01635581.2015.1002626
|
| [39] |
Seyfried TN, Shelton LM (2010) Cancer as a metabolic disease. Nutr. Metab 7: 7. https://doi.org/10.1186/1743-7075-7-7
|
| [40] |
Gomes AP, Price NL, Ling AJ, et al. (2013) Declining NAD+ induces a pseudohypoxic state disrupting nuclear-mitochondrial communication during aging. Cell 155: 1624-1638. https://doi.org/10.1016/j.cell.2013.11.037
|
| [41] |
Chu B, Wu T, Miao L, et al. (2015) MiR-181a regulates lipid metabolism via IDH1. Sci Rep 5: 8801. https://doi.org/10.1038/srep08801
|
| [42] |
Liu WS, Chan SH, Chang HT, et al. (2018) Isocitrate dehydrogenase 1-snail axis dysfunction significantly correlates with breast cancer prognosis and regulates cell invasion ability. Breast Cancer Res 20: 25. https://doi.org/10.1186/s13058-018-0953-7
|
| [43] |
Tanaka H, Sasayama T, Tanak K, et al. (2013) MicroRNA-183 upregulates HIF-1α by targeting isocitrate dehydrogenase 2 (IDH2) in glioma cells. J Neurooncol 111: 273-283. https://doi.org/10.1007/s11060-012-1027-9
|
| [44] | Han L, Zhang Y, Zhao B, et al. (2022) MicroRNA 101 attenuated NSCLC proliferation through IDH2/HIFα axis suppression in the Warburg effect. Oxid Med Cell Longev 2022: 4938811. https://doi.org/10.1155/2022/4938811 |
| [45] |
Metallo CM, Gameiro PA, Bell EL, et al. (2011) Reductive glutamine metabolism by IDH1 mediates lipogenesis under hypoxia. Nature 481: 380-384. https://doi.org/10.1038/nature10602
|
| [46] |
Widłak W, Vydra N, Dudaladava V, et al. (2007) The GC-box is critical for high level expression of the testis-specific Hsp70.2/Hst70 gene. Acta Biochim Pol 54: 107-112.
|
| [47] |
Bajpai R, Nagaraju GP (2017) Specificity protein 1: Its role in colorectal cancer progression and metastasis. Crit Rev Oncol Hematol 113: 1-7. https://doi.org/10.1016/j.critrevonc.2017.02.024
|
| [48] |
Kim SY, Park JW (2010) Modulation of hypoxia-inducible factor-1α expression by mitochondrial NADP+-dependent isocitrate dehydrogenase. Biochimie 92: 1908-1913. https://doi.org/10.1016/j.biochi.2010.08.004
|
| [49] |
Li X, Liu X, Xu Y, et al. (2014) KLF5 promotes hypoxia-induced survival and inhibits apoptosis in non-small cell lung cancer cells via HIF-1α. Int J Oncol 45: 1507-1514. https://doi.org/10.3892/ijo.2014.2544
|
| [50] |
Uchiumi F, Miyazaki S, Tanuma S (2011) The possible functions of duplicated ets (GGAA) motifs located near transcription start sites of various human genes. Cell Mol Life Sci 68: 2039-2051. https://doi.org/10.1007/s00018-011-0674-x
|
| [51] |
Shen Y, Kapfhamer D, Minnella AM, et al. (2017) Bioenergetic state regulates innate inflammatory responses through the transcriptional co-repressor CtBP. Nat Commun 8: 624. https://doi.org/10.1038/s41467-017-00707-0
|
| [52] |
Kim JH, Youn HD (2009) C-terminal binding protein maintains mitochondrial activities. Cell Death Differ 16: 584-592. https://doi.org/10.1038/cdd.2008.186
|
| [53] |
Hu R, Sharma SM, Bronisz A, et al. (2007) Eos, MITF, and PU.1 recruit corepressors to osteoclast-specific genes in committed myeloid progenitors. Mol Cell Biol 27: 4018-4027. https://doi.org/10.1128/MCB.01839-06
|
| [54] |
Yamamoto H, Kihara-Negishi F, Yamada T, et al. (1999) Physical and functional interactions between the transcription factor PU.1 and the coactivator CBP. Oncogene 18: 1495-1501. https://doi.org/10.1038/sj.onc.1202427
|
| [55] |
Calvert AE, Chalastainis A, Wu Y, et al. (2017) Cancer-associated IDH1 promotes growth and resistance to targeted therapies in the absence of mutation. Cell Rep 19: 1858-1873. https://doi.org/10.1016/j.celrep.2017.05.014
|
| [56] |
Jo SH, Son MK, Koh HJ, et al. (2001) Control of mitochondrial redox balance and cellular defense against oxidative damage by mitochondrial NADP+-dependent isocitrate dehydrogenase. J Biol Chem 276: 16168-16176. https://doi.org/10.1074/jbc.M010120200
|
| [57] |
Son MJ, Ryu JS, Kim JY, et al. (2017) Upregulation of mitochondrial NAD+ levels impairs the clonogenicity of SSEA1+ glioblastoma tumor-initiating cells. Exp Mol Med 49: e344. https://doi.org/10.1038/emm.2017.74
|
| [58] |
Tummala KS, Gomes AL, Yilmaz M, et al. (2014) Inhibition of de novo NAD+ synthesis by oncogenic URI causes liver tumorigenesis through DNA damage. Cancer Cell 26: 826-839. https://doi.org/10.1016/j.ccell.2014.10.002
|
| [59] |
Molenaar RJ, Maciejewski JP, Wilmink JW, et al. (2018) Wild-type and mutated IDH1/2 enzymes and therapy responses. Oncogene 37: 1949-1960. https://doi.org/10.1038/s41388-017-0077-z
|
| [60] |
Heo J, Lim J, Lee S, et al. (2017) Sirt1 regulates DNA methylation and differentiation potential of embryonic stem cells by antagonizing Dnmt3l. Cell Rep 18: 1930-1945. https://doi.org/10.1016/j.celrep.2017.01.074
|
| [61] | Uchiumi F, Arakawa J, Takihara Y, et al. (2018) A new insight into the development of novel anti-cancer drugs that improve the expression of mitochondrial function-associated genes. Mitochondrial diseases : 107-134. https://doi.org/10.5772/intechopen.71095 |
| [62] |
Weinberg SE, Chandel NS (2015) Targeting mitochondria metabolism for cancer therapy. Nat Chem Biol 11: 9-15. https://doi.org/10.1038/nchembio.1712
|
| [63] |
Uchiumi F, Sato A, Asai M, et al. (2020) An NAD+ dependent/sensitive transcription system: Toward a novel anti-cancer therapy. AIMS Mol Sci 7: 12-28. https://doi.org/10.3934/molsci.2020002
|
 molsci-10-03-013-s001.pdf molsci-10-03-013-s001.pdf |
 |


Figures(7) / Tables(2)

Yutaka Takihara, Ryuji Otani, Takuro Ishii, Shunsuke Takaoka, Yuki Nakano, Kaori Inoue, Steven Larsen, Yoko Ogino, Masashi Asai, Sei-ichi Tanuma, Fumiaki Uchiumi. Characterization of the human IDH1 gene promoter[J]. AIMS Molecular Science, 2023, 10(3): 186-204. doi: 10.3934/molsci.2023013


 DownLoad: