Extended-spectrum beta-lactamase (ESBL)-producing Enterobacteriaceae including Escherichia coli (E. coli), are recognized as a global public health threat due to their multidrug-resistant (MDR) phenotypes and their rapid dissemination in aquatic environments. Nevertheless, studies investigating the prevalence and antimicrobial resistance (AMR) profile of ESBL-producing E. coli in Lebanese surface water are limited.
This study aimed to assess the physicochemical properties and microbial contamination load and to determine the distribution of AMR patterns of ESBL-producing E. coli in surface water samples from different sites in the North Governorate of Lebanon.
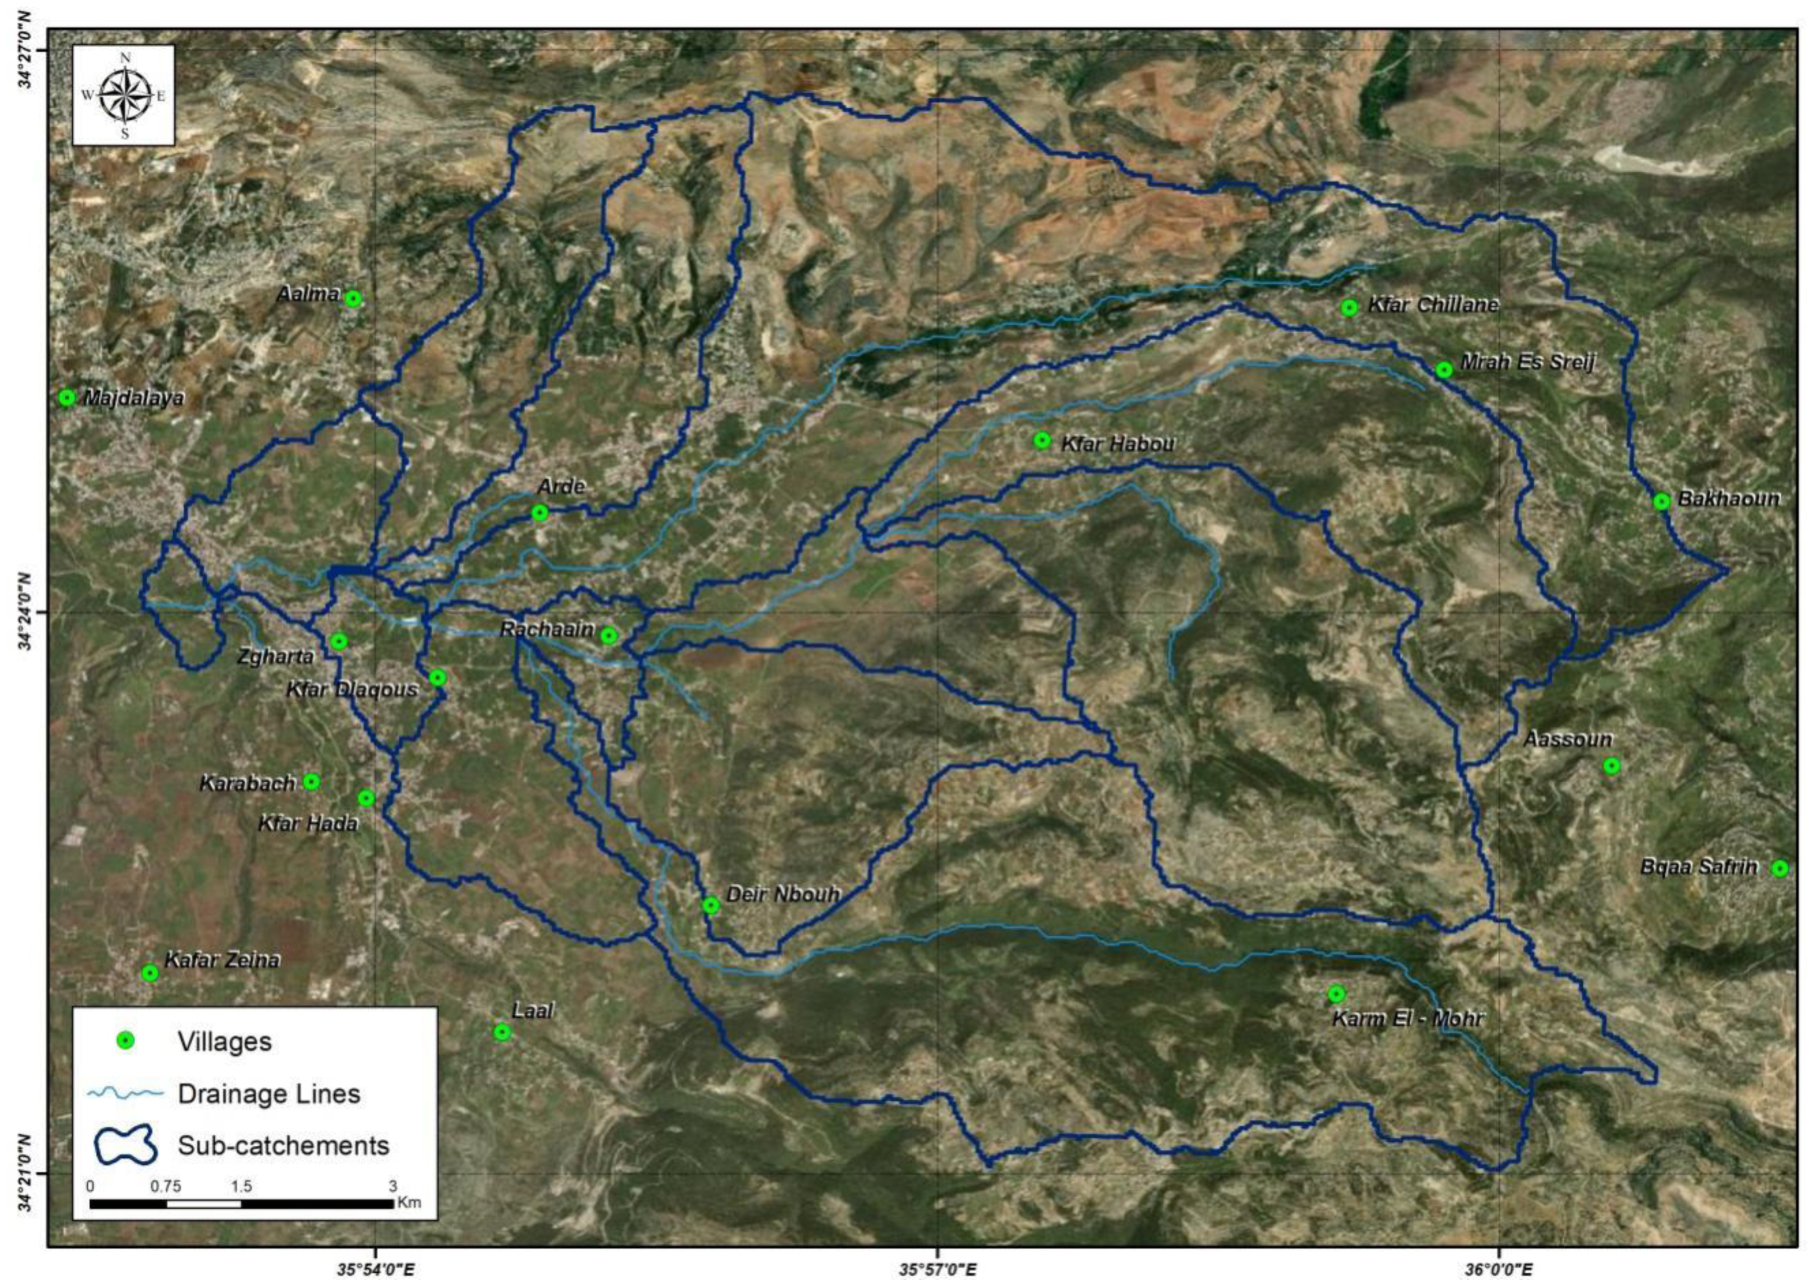
Water samples were collected from 25 major sites in North Lebanon. These samples were analyzed for the presence of total coliforms, E. coli, and fecal enterococci. Phenotypic and genetic characterizations were then performed for E. coli isolates to determine their resistance patterns and phylogenetic groups.
Fifty-six samples out of 100 samples were positive for ESBL-producing E. coli, mostly harboring blaCTX-M (40/56, 71%) including blaCTX-M-15 (33/40, 82%), blaTEM gene (36/56, 64%), blaSHV (20/56, 36%), and blaOXA (16/56, 29%) including blaOXA-48 gene (11/16, 69%). Most ESBL-producing E. coli isolates belonged to the extra-intestinal pathogenic phylogroup B2 (40/56, 71.4%) while 10/56 (17.9%) belonged to the commensal phylogroup A.
Our results highlight the need to implement effective water monitoring strategies to control transmission of ESBL-producing E. coli in surface water and thus reduce the burden on human and animal health.
Citation: Rosette Mansour, Mohammad H. El-Dakdouki, Sara Mina. Phylogenetic group distribution and antibiotic resistance of Escherichia coli isolates in aquatic environments of a highly populated area[J]. AIMS Microbiology, 2024, 10(2): 340-362. doi: 10.3934/microbiol.2024018
Extended-spectrum beta-lactamase (ESBL)-producing Enterobacteriaceae including Escherichia coli (E. coli), are recognized as a global public health threat due to their multidrug-resistant (MDR) phenotypes and their rapid dissemination in aquatic environments. Nevertheless, studies investigating the prevalence and antimicrobial resistance (AMR) profile of ESBL-producing E. coli in Lebanese surface water are limited.
This study aimed to assess the physicochemical properties and microbial contamination load and to determine the distribution of AMR patterns of ESBL-producing E. coli in surface water samples from different sites in the North Governorate of Lebanon.
Water samples were collected from 25 major sites in North Lebanon. These samples were analyzed for the presence of total coliforms, E. coli, and fecal enterococci. Phenotypic and genetic characterizations were then performed for E. coli isolates to determine their resistance patterns and phylogenetic groups.
Fifty-six samples out of 100 samples were positive for ESBL-producing E. coli, mostly harboring blaCTX-M (40/56, 71%) including blaCTX-M-15 (33/40, 82%), blaTEM gene (36/56, 64%), blaSHV (20/56, 36%), and blaOXA (16/56, 29%) including blaOXA-48 gene (11/16, 69%). Most ESBL-producing E. coli isolates belonged to the extra-intestinal pathogenic phylogroup B2 (40/56, 71.4%) while 10/56 (17.9%) belonged to the commensal phylogroup A.
Our results highlight the need to implement effective water monitoring strategies to control transmission of ESBL-producing E. coli in surface water and thus reduce the burden on human and animal health.

| [1] |
Li J, Cao J, Zhu YG, et al. (2018) Global survey of antibiotic resistance genes in air. Environ Sci Technol 52: 10975-10984. https://doi:10.1021/acs.est.8b02204 
|
| [2] |
Ben Said L, Jouini A, Klibi N, et al. (2015) Detection of extended-spectrum beta-lactamase (ESBL)-producing Enterobacteriaceae in vegetables, soil and water of the farm environment in Tunisia. Int J Food Microbiol 203: 86-92. https://doi:10.1016/j.ijfoodmicro.2015.02.023
|
| [3] |
Kusi J, Ojewole CO, Ojewole AE, et al. (2022) Antimicrobial resistance development pathways in surface waters and public health implications. Antibiotics (Basel) 11: 821. https://doi:10.3390/antibiotics11060821
|
| [4] |
Osińska A, Korzeniewska E, Harnisz M, et al. (2017) The prevalence and characterization of antibiotic-resistant and virulent Escherichia coli strains in the municipal wastewater system and their environmental fate. Sci Total Environ 577: 367-375. https://doi:10.1016/j.scitotenv.2016.10.203
|
| [5] |
Wang Y, Yang Y, Liu X, et al. (2021) Interaction of microplastics with antibiotics in aquatic environment: distribution, adsorption, and toxicity. Environ Sci Technol 55: 15579-15595. https://doi.org/10.1021/acs.est.1c04509
|
| [6] |
Magiorakos AP, Srinivasan A, Carey RB, et al. (2012) Multidrug-resistant, extensively drug-resistant and pandrug-resistant bacteria: an international expert proposal for interim standard definitions for acquired resistance. Clin Microbiol Infect 18: 268-281. https://doi.org/10.1111/j.1469-0691.2011.03570.x
|
| [7] |
Lin L, Yang H, Xu X (2022) Effects of water pollution on human health and disease heterogeneity: a review. Front Environ Sci 10: 880246. https://doi.org/10.3389/fenvs.2022.880246
|
| [8] | Ye Q, Wu Q, Zhang S, et al. (2017) Antibiotic-resistant Extended Spectrum ß-Lactamase- and Plasmid-Mediated AmpC-Producing Enterobacteriaceae isolated from retail food products and the Pearl River in Guangzhou, China. Front Microbiol 8: 96. https://doi.org/10.3389/fmicb.2017.00096 |
| [9] |
Bezabih YM, Bezabih A, Dion M, et al. (2022) Comparison of the global prevalence and trend of human intestinal carriage of ESBL-producing Escherichia coli between healthcare and community settings: a systematic review and meta-analysis. JAC Antimicrob Resist 4: dlac048. https://doi:10.1093/jacamr/dlac048
|
| [10] | Ghafourian S, Sadeghifard N, Soheili S, et al. (2015) Extended spectrum beta-lactamases: definition, classification and epidemiology. Curr Issues Mol Biol 17: 11-21. https://doi.org/10.21775/cimb.017.011 |
| [11] |
Michaelis C, Grohmann E (2023) Horizontal gene transfer of antibiotic resistance genes in biofilms. Antibiotics (Basel) 12: 328. https://doi:10.3390/antibiotics12020328
|
| [12] |
Li R, Xu H, Tang H, et al. (2023) The characteristics of Extended-Spectrum β-Lactamases (ESBLs)-producing Escherichia coli in bloodstream infection. Infect Drug Resist 16: 2043-2060. https://doi:10.2147/IDR.S400170
|
| [13] |
Carvalho I, Carvalho JA, Martínez-Álvarez S, et al. (2021) Characterization of ESBL-producing Escherichia coli and Klebsiella pneumoniae isolated from clinical samples in a Northern Portuguese hospital: predominance of CTX-M-15 and high genetic diversity. Microorganisms 9: 1914. https://doi:10.3390/microorganisms9091914
|
| [14] |
Biggel M, Hoehn S, Frei A, et al. (2023) Dissemination of ESBL-producing E. coli ST131 through wastewater and environmental water in Switzerland. Environ Pollut 337: 122476. https://doi:10.1016/j.envpol.2023.122476
|
| [15] |
Rhea S, Gensler C, Atlaw N, et al. (2024) Presence of Extended-Spectrum Beta-Lactamase-Producing Escherichia coli in food-producing and companion animals and wildlife on small-holder farms of Floreana Island, Galápagos Islands. Vector Borne Zoonotic Dis 24: 36-45. https://doi:10.1089/vbz.2023.0044
|
| [16] |
Tokajian S, Moghnieh R, Salloum T, et al. (2018) Extended-spectrum β-lactamase-producing Escherichia coli in wastewaters and refugee camp in Lebanon. Future Microbiol 13: 81-95. https://doi:10.2217/fmb-2017-0093
|
| [17] |
Daou C, Salloum M, Legube B, et al. (2018) Characterization of spatial and temporal patterns in surface water quality: a case study of four major Lebanese rivers. Environ Monit Assess 190: 485. https://doi:10.1007/s10661-018-6843-8
|
| [18] |
Karnib A (2016) Assessing population coverage of safely managed wastewater systems: a case study of Lebanon. J Water Sanit Hyg Dev 6: 313-319. https://doi.org/10.2166/washdev.2016.009
|
| [19] |
Merhabi F, Gomez E, Amine H, et al. (2021) Occurrence, distribution, and ecological risk assessment of emerging and legacy contaminants in the Kadicha river in Lebanon. Environ Sci Pollut Res Int 28: 62499-62518. https://doi:10.1007/s11356-021-15049-0
|
| [20] |
Merhaby D, Ouddane B, Net S, et al. (2020) Assessment of persistent organic pollutants in surface sediments along Lebanese coastal zone. Mar Pollut Bull 153: 110947. https://doi:10.1016/j.marpolbul.2020.110947
|
| [21] |
Diab M, Hamze M, Bonnet R, et al. (2018) Extended-spectrum beta-lactamase (ESBL)- and carbapenemase-producing Enterobacteriaceae in water sources in Lebanon. Vet Microbiol 217: 97-103. https://doi:10.1016/j.vetmic.2018.03.007
|
| [22] | SOER (State Of the Environment Report)Report Lebanon state of the environment and future outlook: turning the crises into opportunities (2021). Available from: https://www.unicef.org/lebanon/media/7161/file/SOER_Report_EN.pdf |
| [23] |
Manini E, Baldrighi E, Ricci F, et al. (2022) Assessment of spatio-temporal variability of faecal pollution along coastal waters during and after rainfall events. Water 14: 502. https://doi.org/10.3390/w14030502
|
| [24] | Environmental Protection Agency (EPA)Water Quality Standards Handbook: Chapter 3: Water Quality Criteria. EPA-823-B-17-001. EPA Office of Water, Office of Science and Technology, Washington, DC (2017). Available from: https://www.epa.gov/sites/production/files/2014-10/documents/handbook-chapter3.pdf |
| [25] | European Comission.Commission notice on guidance document on addressing microbiological risks in fresh fruits and vegetables at primary production through good hygiene. Off J Eur Union C (2017) 163: 1-40. |
| [26] | CLSIPerformance Standards for Antimicrobial Susceptibility Testing. 32nd Edition (Wayne, PA: CLSI). CLSI supplement M100 (2022). |
| [27] |
Clermont O, Christenson JK, Denamur E, et al. (2013) The Clermont Escherichia coli phylo-typing method revisited: improvement of specificity and detection of new phylo-groups. Environ Microbiol Rep 5: 58-65. https://doi:10.1111/1758-2229.12019
|
| [28] |
Jamil A, Zahoor MA, Nawaz Z, et al. (2022) Genetic diversity of Escherichia coli Coharboring mcr-1 and Extended Spectrum Beta-Lactamases from poultry. Biomed Res Int 2022: 8224883. https://doi:10.1155/2022/8224883
|
| [29] |
Gurung S, Kafle S, Dhungel B, et al. (2020) Detection of OXA-48 gene in carbapenem-resistant Escherichia coli and Klebsiella pneumoniae from Urine samples. Infect Drug Resist 13: 2311-2321. https://doi:10.2147/IDR.S259967
|
| [30] | WHOGuidelines for Drinking-Water Quality, 4 eds (2017). Available from: http://www.who.int/water_sanitation_health/publications/drinking-water-quality-guidelines-4-including-1st-addendum/en/ |
| [31] |
Dagher LA, Hassan J, Kharroubi S, et al. (2021) Nationwide assessment of water quality in rivers across lebanon by quantifying fecal indicators densities and profiling antibiotic resistance of Escherichia coli. Antibiotics (Basel) 10: 883. https://doi:10.3390/antibiotics10070883
|
| [32] | McHeik A, Awad A, Fadel A, et al. (2018) Effect of irrigation water quality on the microbial contamination of fresh vegetables in the Bekaa Valley, Lebanon. Am J Agric For 6: 191-197. http://dx.doi.org/10.11648/j.ajaf.20180606.16 |
| [33] |
Miyittah MK, Tulashie SK, Tsyawo FW, et al. (2020) Assessment of surface water quality status of the Aby Lagoon System in the Western Region of Ghana. Heliyon 6: e04466. https://doi:10.1016/j.heliyon.2020.e04466
|
| [34] |
Nair NV, Nayak PK (2023) Exploring water quality as a determinant of small-scale fisheries vulnerability. Sustainability 15: 13238. https://doi.org/10.3390/su151713238
|
| [35] |
Sinha K, Dwivedi J, Singh P, et al. (2022) Spatio-temporal dynamics of water quality in river sources of drinking water in Uttarakhand with reference to human health. Environ Sci Pollut Res Int 29: 64756-64774. https://doi:10.1007/s11356-022-20302-1
|
| [36] |
Bong CW, Low KY, Chai LC, et al. (2022) Prevalence and diversity of antibiotic resistant Escherichia coli from anthropogenic-impacted Larut River. Front Public Health 10: 794513. https://doi:10.3389/fpubh.2022.794513
|
| [37] |
D'Onofrio V, Cartuyvels R, Messiaen PEA, et al. (2023) virulence factor genes in invasive Escherichia coli are associated with clinical outcomes and disease severity in patients with sepsis: a prospective observational cohort study. Microorganisms 11: 1827. https://doi:10.3390/microorganisms11071827
|
| [38] |
Figueira V, Serra E, Manaia CM (2011) Differential patterns of antimicrobial resistance in population subsets of Escherichia coli isolated from waste- and surface waters. Sci Total Environ 409: 1017-1023. https://doi:10.1016/j.scitotenv.2010.12.011
|
| [39] |
Pereira A, Santos A, Tacão M, et al. (2013) Genetic diversity and antimicrobial resistance of Escherichia coli from Tagus estuary (Portugal). Sci Total Environ 461–462: 65-71. https://doi:10.1016/j.scitotenv.2013.04.067
|
| [40] |
Ghaderpour A, Ho WS, Chew LL, et al. (2015) Diverse and abundant multi-drug resistant E. coli in Matang mangrove estuaries, Malaysia. Front Microbiol 6: 977. https://doi:10.3389/fmicb.2015.00977
|
| [41] |
Alwash MS, Al-Rafyai HM (2019) Antibiotic resistance patterns of diverse Escherichia coli phylogenetic groups isolated from the Al-Hillah River in Babylon Province, Iraq. Sci World J 2019: 5927059. https://doi:10.1155/2019/5927059
|
| [42] |
Alhaj Sulaiman AA, Kassem II (2020) First report of the plasmid-borne colistin resistance gene (mcr-1) in Proteus mirabilis isolated from domestic and sewer waters in Syrian refugee camps. Travel Med Infect Dis 33: 101482. https://doi:10.1016/j.tmaid.2019.101482
|
| [43] | Marinescu F, Marutescu L, Savin I, et al. (2015) Antibiotic resistance markers among Gram-negative isolates from wastewater and receiving rivers in South Romania. Rom Biotechnol Lett 20: 10055-10069. |
| [44] |
Belachew T, Mihret A, Legesse T, et al. (2018) High level of drug resistance by gram-negative bacteria from selected sewage polluted urban rivers in Addis Ababa, Ethiopia. BMC Res Notes 11: 524. https://doi:10.1186/s13104-018-3622-0
|
| [45] |
Chakraborty A, Saralaya V, Adhikari P, et al. (2015) Characterization of Escherichia coli Phylogenetic Groups Associated with Extraintestinal Infections in South Indian Population. Ann Med Health Sci Res 5: 241-246. https://doi:10.4103/2141-9248.160192
|
| [46] |
Satyaprakash K, Pesingi PK, Das A, et al. (2024) Occurrence of multidrug-resistant (MDR) Extended-Spectrum Beta-lactamase (ESBL)-Producing Escherichia coli in wastewater and natural water sources from the eastern part of Uttar Pradesh, India. Water Air Soil Pollut 235: 125. https://doi.org/10.1007/s11270-024-06914-y
|
| [47] |
Girlich D, Bonnin RA, Naas T (2020) Occurrence and diversity of CTX-M-producing Escherichia coli from the Seine River. Front Microbiol 11: 603578. https://doi:10.3389/fmicb.2020.603578
|
| [48] |
Gumede SN, Abia ALK, Amoako DG, et al. (2021) Analysis of wastewater reveals the spread of diverse extended-spectrum β-lactamase-producing E. coli strains in uMgungundlovu District, South Africa. Antibiotics (Basel) 10: 860. https://doi:10.3390/antibiotics10070860
|
| [49] |
Tacão M, Laço J, Teixeira P, et al. (2022) CTX-M-producing bacteria isolated from a highly polluted river system in Portugal. Int J Environ Res Public Health 19: 11858. https://doi:10.3390/ijerph191911858
|
| [50] |
Chotinantakul K, Chusri P, Okada S (2022) Detection and characterization of ESBL-producing Escherichia coli and additional co-existence with mcr genes from river water in northern Thailand. PeerJ 10: e14408. https://doi:10.7717/peerj.14408
|
| [51] |
Hassen B, Abbassi MS, Benlabidi S, et al. (2020) Genetic characterization of ESBL-producing Escherichia coli and Klebsiella pneumoniae isolated from wastewater and river water in Tunisia: predominance of CTX-M-15 and high genetic diversity. Environ Sci Pollut Res Int 27: 44368-44377. https://doi:10.1007/s11356-020-10326-w
|
| [52] |
Falgenhauer L, Zur Nieden A, Harpel S, et al. (2021) Clonal CTX-M-15-Producing Escherichia coli ST-949 are present in german surface water. Front Microbiol 12: 617349. https://doi:10.3389/fmicb.2021.617349
|
| [53] |
Moubareck C, Daoud Z, Hakimé NI, et al. (2005) Countrywide spread of community- and hospital-acquired extended-spectrum beta-lactamase (CTX-M-15)-producing Enterobacteriaceae in Lebanon. J Clin Microbiol 43: 3309-3313. https://doi:10.1128/JCM.43.7.3309-3313.2005
|
| [54] |
Coque TM, Baquero F, Canton R (2008) Increasing prevalence of ESBL-producing Enterobacteriaceae in Europe. Euro Surveill 13: 19044.
|
| [55] |
Girijan SK, Pillai D (2023) Genetic diversity and prevalence of extended-spectrum beta-lactamase-producing Escherichia coli and Klebsiella pneumoniae in aquatic environments receiving untreated hospital effluents. J Water Health 21: 66-80. https://doi:10.2166/wh.2022.194
|
| [56] |
Korzeniewska E, Korzeniewska A, Harnisz M (2013) Antibiotic resistant Escherichia coli in hospital and municipal sewage and their emission to the environment. Ecotoxicol Environ Saf 91: 96-102. https://doi:10.1016/j.ecoenv.2013.01.014
|
| [57] |
Shi H, Sun F, Chen J, et al. (2015) Epidemiology of CTX-M-type extended-spectrum beta-lactamase (ESBL)-producing nosocomial -Escherichia coli infection in China. Ann Clin Microbiol Antimicrob 14: 4. https://doi:10.1186/s12941-015-0063-7
|
| [58] |
Tanner WD, VanDerslice JA, Goel RK, et al. (2019) Multi-state study of Enterobacteriaceae harboring extended-spectrum beta-lactamase and carbapenemase genes in U.S. drinking water. Sci Rep 9: 3938. https://doi:10.1038/s41598-019-40420-0
|
| [59] |
Al-Sarawi HA, Habibi N, Uddin S, et al. (2023) Antibiotic resistance mediated by Escherichia coli in Kuwait marine environment as revealed through genomic analysis. Antibiotics (Basel) 12: 1366. https://doi:10.3390/antibiotics12091366
|
| [60] |
Mairi A, Pantel A, Sotto A, et al. (2018) OXA-48-like carbapenemases producing Enterobacteriaceae in different niches. Eur J Clin Microbiol Infect Dis 37: 587-604. https://doi.org/10.1007/s10096-017-3112-7
|
| [61] |
Soni K, Kothamasi D, Chandra R (2024) Municipal wastewater treatment plant showing a potential reservoir for clinically relevant MDR bacterial strains co-occurrence of ESBL genes and integron-integrase genes. J Environ Manage 351: 119938. https://doi:10.1016/j.jenvman.2023.119938
|
| [62] |
Yoon EJ, Gwon B, Liu C, et al. (2020) Beneficial chromosomal integration of the genes for ctx-m extended-spectrum β-lactamase in Klebsiella pneumoniae for stable propagation. mSystems 5: e00459-20. https://doi:10.1128/mSystems.00459-20
|
| [63] |
Garcia-Aljaro C, Moreno E, Andreu A, et al. (2009) Phylogroups, virulence determinants and antimicrobial resistance in stx(2) gene-carrying Escherichia coli isolated from aquatic environments. Res Microbiol 160: 585-591. https://doi:10.1016/j.resmic.2009.08.004
|

Figures(2) / Tables(4)

Rosette Mansour, Mohammad H. El-Dakdouki, Sara Mina. Phylogenetic group distribution and antibiotic resistance of Escherichia coli isolates in aquatic environments of a highly populated area[J]. AIMS Microbiology, 2024, 10(2): 340-362. doi: 10.3934/microbiol.2024018


 DownLoad: