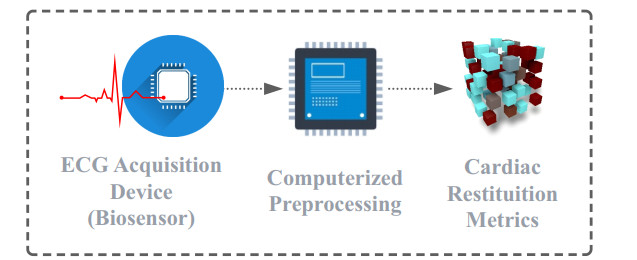
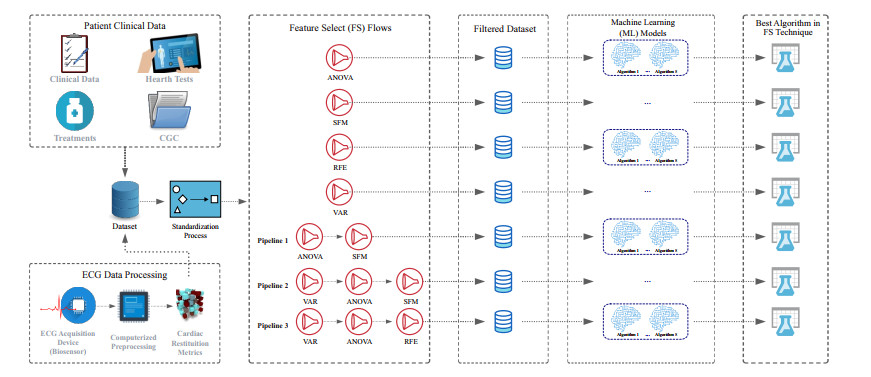
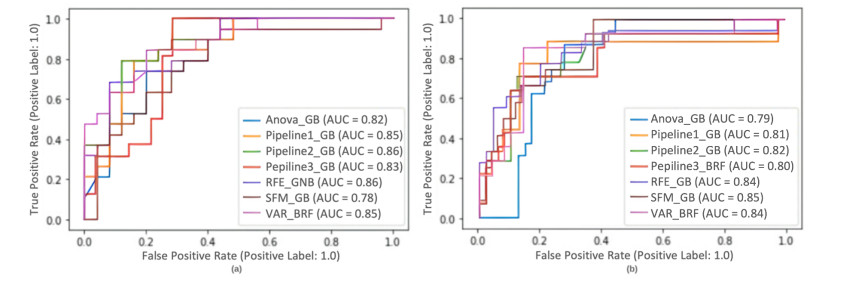
About 6.5 million people are infected with Chagas disease (CD) globally, and WHO estimates that $ > million people worldwide suffer from ChHD. Sudden cardiac death (SCD) represents one of the leading causes of death worldwide and affects approximately 65% of ChHD patients at a rate of 24 per 1000 patient-years, much greater than the SCD rate in the general population. Its occurrence in the specific context of ChHD needs to be better exploited. This paper provides the first evidence supporting the use of machine learning (ML) methods within non-invasive tests: patients' clinical data and cardiac restitution metrics (CRM) features extracted from ECG-Holter recordings as an adjunct in the SCD risk assessment in ChHD. The feature selection (FS) flows evaluated 5 different groups of attributes formed from patients' clinical and physiological data to identify relevant attributes among 57 features reported by 315 patients at HUCFF-UFRJ. The FS flow with FS techniques (variance, ANOVA, and recursive feature elimination) and Naive Bayes (NB) model achieved the best classification performance with 90.63% recall (sensitivity) and 80.55% AUC. The initial feature set is reduced to a subset of 13 features (4 Classification; 1 Treatment; 1 CRM; and 7 Heart Tests). The proposed method represents an intelligent diagnostic support system that predicts the high risk of SCD in ChHD patients and highlights the clinical and CRM data that most strongly impact the final outcome.
Citation: Carlos H. L. Cavalcante, Pedro E. O. Primo, Carlos A. F. Sales, Weslley L. Caldas, João H. M. Silva, Amauri H. Souza, Emmanuel S. Marinho, Roberto C. Pedrosa, João A. L. Marques, Hélcio S. Santos, João P. V. Madeiro. Sudden cardiac death multiparametric classification system for Chagas heart disease's patients based on clinical data and 24-hours ECG monitoring[J]. Mathematical Biosciences and Engineering, 2023, 20(5): 9159-9178. doi: 10.3934/mbe.2023402
About 6.5 million people are infected with Chagas disease (CD) globally, and WHO estimates that $ > million people worldwide suffer from ChHD. Sudden cardiac death (SCD) represents one of the leading causes of death worldwide and affects approximately 65% of ChHD patients at a rate of 24 per 1000 patient-years, much greater than the SCD rate in the general population. Its occurrence in the specific context of ChHD needs to be better exploited. This paper provides the first evidence supporting the use of machine learning (ML) methods within non-invasive tests: patients' clinical data and cardiac restitution metrics (CRM) features extracted from ECG-Holter recordings as an adjunct in the SCD risk assessment in ChHD. The feature selection (FS) flows evaluated 5 different groups of attributes formed from patients' clinical and physiological data to identify relevant attributes among 57 features reported by 315 patients at HUCFF-UFRJ. The FS flow with FS techniques (variance, ANOVA, and recursive feature elimination) and Naive Bayes (NB) model achieved the best classification performance with 90.63% recall (sensitivity) and 80.55% AUC. The initial feature set is reduced to a subset of 13 features (4 Classification; 1 Treatment; 1 CRM; and 7 Heart Tests). The proposed method represents an intelligent diagnostic support system that predicts the high risk of SCD in ChHD patients and highlights the clinical and CRM data that most strongly impact the final outcome.

| [1] |
A. F. Members, S. G. Priori, C. Blomström-Lundqvist, A. Mazzanti, N. Blom, M. Borggrefe, et al., 2015 esc guidelines for the management of patients with ventricular arrhythmias and the prevention of sudden cardiac death: The task force for the management of patients with ventricular arrhythmias and the prevention of sudden cardiac death of the european society of cardiology (esc) endorsed by: Association for european paediatric and congenital cardiology (aepc), EP Europace, 17 (2015), 1601–1687. https://doi.org/10.1093/europace/euv319 doi: 10.1093/europace/euv319

|
| [2] |
A. S. Adabag, R. V. Luepker, V. L. Roger, B. J. Gersh, Sudden cardiac death: epidemiology and risk factors, Nat. Rev. Cardiol., 7 (2010), 216–225. https://doi.org/10.1038/nrcardio.2010.3 doi: 10.1038/nrcardio.2010.3
|
| [3] | World Health Organization, Fourth who report on neglected tropical diseases: Integrating neglected tropical diseases into global health and development, IV WHO Report on Neglected Tropical Diseases, 2017. Available from: https://apps.who.int/iris/handle/10665/255011. |
| [4] |
A. Rassi Jr, A. Rassi, W. C. Little, S. S. Xavier, S. G. Rassi, A. G. Rassi, et al., Development and validation of a risk score for predicting death in chagas' heart disease, N. Engl. J. Med., 355 (2006), 799–808. https://doi.org/10.1056/NEJMoa053241 doi: 10.1056/NEJMoa053241
|
| [5] | World Health Organization, Chagas Disease (also known as American Trypanosomiasis), 2021. Available from: https://www.who.int/news-room/fact-sheets/detail/chagas-disease-(american-trypanosomiasis), Accesse date: 10 January 2022. |
| [6] |
R. C. Pedrosa, Dysautonomic arrhythmogenesis: A working hypothesis in chronic chagas cardiomyopathy, Int. J. Cardiovasc. Sci., 33 (2020), 713–720. https://doi.org/10.36660/ijcs.20200169 doi: 10.36660/ijcs.20200169
|
| [7] |
J. A. Marin-Neto, E. Cunha-Neto, B. C. Maciel, M. V. Simões, Pathogenesis of chronic chagas heart disease, Circulation, 115 (2007), 1109–1123. https://doi.org/10.1161/CIRCULATIONAHA.106.624296 doi: 10.1161/CIRCULATIONAHA.106.624296
|
| [8] |
A. C. J. de Souza, G. Salles, A. M. Hasslocher-Moreno, A. S. de Sousa, P. E. A. A. do Brasil, R. M. Saraiva, et al., Development of a risk score to predict sudden death in patients with chaga's heart disease, Int. J. Cardiol., 187 (2015), 700–704. https://doi.org/10.1016/j.ijcard.2015.03.372 doi: 10.1016/j.ijcard.2015.03.372
|
| [9] |
J. A. Pérez-Molina, I. Molina, Chagas disease cardiomyopathy treatment remains a challenge–authors' reply, Lancet, 391 (2018), 2209–2210. https://doi.org/10.1016/S0140-6736(18)30776-1 doi: 10.1016/S0140-6736(18)30776-1
|
| [10] |
F. M. Rassi, L. Minohara, A. Rassi, L. C. L. Correia, J. A. Marin-Neto, A. Rassi, et al., Systematic review and meta-analysis of clinical outcome after implantable cardioverter-defibrillator therapy in patients with chagas heart disease, JACC: Clin. Electrophysiol., 5 (2019), 1213–1223. https://doi.org/10.1016/j.jacep.2019.07.003 doi: 10.1016/j.jacep.2019.07.003
|
| [11] |
F. Lopez-Jimenez, Z. Attia, A. M. Arruda-Olson, R. Carter, P. Chareonthaitawee, H. Jouni, et al., Artificial intelligence in cardiology: present and future, Mayo Clin. Proc., 95 (2020), 1015–1039. https://doi.org/10.1016/j.mayocp.2020.01.038 doi: 10.1016/j.mayocp.2020.01.038
|
| [12] |
F. Ali, S. El-Sappagh, S. R. Islam, D. Kwak, A. Ali, M. Imran, et al., A smart healthcare monitoring system for heart disease prediction based on ensemble deep learning and feature fusion, Inf. Fusion, 63 (2020), 208–222. https://doi.org/10.1016/j.inffus.2020.06.008 doi: 10.1016/j.inffus.2020.06.008
|
| [13] |
J. Barker, X. Li, S. Khavandi, D. Koeckerling, A. Mavilakandy, C. Pepper, et al., Machine learning in sudden cardiac death risk prediction: a systematic review, Europace, 24 (2022), 1777–1787. https://doi.org/10.1093/europace/euac135 doi: 10.1093/europace/euac135
|
| [14] |
P. Pace, G. Aloi, R. Gravina, G. Caliciuri, G. Fortino, A. Liotta, An edge-based architecture to support efficient applications for healthcare industry 4.0, IEEE Trans. Ind. Inf., 15 (2018), 481–489. https://doi.org/10.1109/TII.2018.2843169 doi: 10.1109/TII.2018.2843169
|
| [15] |
G. Alfian, M. Syafrudin, M. F. Ijaz, M. A. Syaekhoni, N. L. Fitriyani, J. Rhee, A personalized healthcare monitoring system for diabetic patients by utilizing ble-based sensors and real-time data processing, Sensors, 18 (2018), 2183. https://doi.org/10.3390/s18072183 doi: 10.3390/s18072183
|
| [16] |
J. A. L. Marques, T. Han, W. Wu, J. P. do Vale Madeiro, A. V. L. Neto, R. Gravina, et al., Iot-based smart health system for ambulatory maternal and fetal monitoring, IEEE Internet Things J., 8 (2020), 16814–16824. https://doi.org/10.1109/JIOT.2020.3037759 doi: 10.1109/JIOT.2020.3037759
|
| [17] |
D. L. T. Wong, J. Yu, Y. Li, C. J. Deepu, D. H. Ngo, C. Zhou, et al., An integrated wearable wireless vital signs biosensor for continuous inpatient monitoring, IEEE Sens. J., 20 (2020), 448–462. https://doi.org/10.1109/JSEN.2019.2942099 doi: 10.1109/JSEN.2019.2942099
|
| [18] |
J. C. P. Dias, A. N. Ramos, E. D. Gontijo, A. Luquetti, M. A. Shikanai-Yasuda, J. R. Coura, et al., 2nd brazilian consensus on chagas disease, 2015, Rev. Soc. Bras. Med. Trop., 49 (2016), 03–60. https://doi.org/10.1590/0037-8682-0505-2016 doi: 10.1590/0037-8682-0505-2016
|
| [19] | M. C. P. Nunes, A. Z. Beaton, H. Acquatella, C. Bern, A. F. Bolger, L. E. Echeverría, et al., Circulation, 138 (2018), e169–e209. https://doi.org/10.1161/CIR.0000000000000599 |
| [20] |
R. J. Moll-Bernardes, P. H. Rosado-de Castro, G. C. Camargo, F. S. N. S. Mendes, A. S. Brito, A. S. Sousa, New imaging parameters to predict sudden cardiac death in chagas disease, Trop. Med. Infect. Dis., 5 (2020), 74. https://doi.org/10.3390/tropicalmed5020074 doi: 10.3390/tropicalmed5020074
|
| [21] | N. Sharma, K. Saroha, Study of dimension reduction methodologies in data mining, in International Conference on Computing, Communication & Automation, IEEE, (2015), 133–137. https://doi.org/10.1109/CCAA.2015.7148359 |
| [22] |
S. Velliangiri, S. Alagumuthukrishnan, I. T. J. Swamidason, A review of dimensionality reduction techniques for efficient computation, Procedia Comput. Sci., 165 (2019), 104–111. https://doi.org/10.1016/j.procs.2020.01.079 doi: 10.1016/j.procs.2020.01.079
|
| [23] |
C. Antzelevitch, S. Sicouri, J. M. Di Diego, A. Burashnikov, S. Viskin, W. Shimizu, et al., Does tpeak–tend provide an index of transmural dispersion of repolarization, Heart Rhythm, 4 (2007), 1114–1116. https://doi.org/10.1016/j.hrthm.2007.05.028 doi: 10.1016/j.hrthm.2007.05.028
|
| [24] | A. A. Fossa, M. Zhou, Assessing QT prolongation and electrocardiography restitution using a beat-to-beat method, Cardiol. J., 17 (2010), 230–243. |
| [25] |
W. B. Nicolson, G. P. McCann, M. I. Smith, A. J. Sandilands, P. J. Stafford, F. S. Schlindwein, et al., Prospective evaluation of two novel ecg-based restitution biomarkers for prediction of sudden cardiac death risk in ischaemic cardiomyopathy, Heart, 100 (2014), 1878–1885. http://dx.doi.org/10.1136/heartjnl-2014-305672 doi: 10.1136/heartjnl-2014-305672
|
| [26] |
A. C. Alberto, R. C. Pedrosa, V. Zarzoso, J. Nadal, Association between circadian holter ecg changes and sudden cardiac death in patients with chagas heart disease, Physiol. Meas., 41 (2020), 025006. https://doi.org/10.1088/1361-6579/ab6ebc doi: 10.1088/1361-6579/ab6ebc
|
| [27] |
L. E. Hinkle Jr, H. T. Thaler, Clinical classification of cardiac deaths, Circulation, 65 (1982), 457–464. https://doi.org/10.1161/01.CIR.65.3.457 doi: 10.1161/01.CIR.65.3.457
|
| [28] | DATASUS (Departamento de Informática do Sistema Único de Saúde), TabNet Win32 3.0: Morbidade Hospitalar do SUS por Causas Externas por local de internação - Brasil, 2022. Available from: http://tabnet.datasus.gov.br, Accesse date: 10 July 2022. |
| [29] |
L. Capuani, A. L. Bierrenbach, F. Abreu, P. L. Takecian, J. E. Ferreira, E. C. Sabino, Accuracy of a probabilistic record-linkage methodology used to track blood donors in the mortality information system database, Cad. Saúde Pública, 30 (2014), 1623–1632. https://doi.org/10.1590/0102-311X00024914 doi: 10.1590/0102-311X00024914
|
| [30] |
R. Laurenti, M. de Mello Jorge, S. Gotlieb, Underlying cause-of-death mortality statistics: considering the reliability of data, Pan Amer. J. Public Health, 23 (2008), 349–356. https://doi.org/10.1590/s1020-49892008000500007 doi: 10.1590/s1020-49892008000500007
|
| [31] | New York Heart Association, The Criteria Committee of the New York Heart Association, Nomenclature and Criteria for Diagnosis of Diseases of the Heart and Great Vessels, 9th edition, Boston, Massachusetts, Little, Brown & Co, 1994. |
| [32] |
J. P. de Andrade, J. A. Marin Neto, A. A. V. de Paola, F. Vilas-Boas, G. M. M. Oliveira, F. Bacal, et al., I latin american guidelines for the diagnosis and treatment of chagas' heart disease: executive summary, Arq. Bras. Cardiol., 96 (2011), 434–442. https://doi.org/10.1590/S0066-782X2011000600002 doi: 10.1590/S0066-782X2011000600002
|
| [33] | H. Liu, H. Motoda, Computational Methods of Feature Selection, CRC Press, 2007. |
| [34] |
J. C. Ang, A. Mirzal, H. Haron, H. N. A. Hamed, Supervised, unsupervised, and semi-supervised feature selection: a review on gene selection, IEEE/ACM Trans. Comput. Biol. Bioinf., 13 (2015), 971–989. https://doi.org/10.1109/TCBB.2015.2478454 doi: 10.1109/TCBB.2015.2478454
|
| [35] |
R. Zebari, A. Abdulazeez, D. Zeebaree, D. Zebari, J. Saeed, A comprehensive review of dimensionality reduction techniques for feature selection and feature extraction, J. Appl. Sci. Technol. Trends, 1 (2020), 56–70. https://doi.org/10.38094/jastt1224 doi: 10.38094/jastt1224
|
| [36] | J. Richter, H. Kotthaus, B. Bischl, P. Marwedel, J. Rahnenführer, M. Lang, Faster model-based optimization through resource-aware scheduling strategies, in International Conference on Learning and Intelligent Optimization, Springer, (2016), 267–273. https://doi.org/10.1007/978-3-319-50349-3_22 |
| [37] |
Q. Chen, Z. Meng, X. Liu, Q. Jin, R. Su, Decision variants for the automatic determination of optimal feature subset in RF-RFE, Genes, 9 (2018), 301. https://doi.org/10.3390/genes9060301 doi: 10.3390/genes9060301
|
| [38] | P. Schwartz, M. La Rovere, E. Vanoli, Autonomic nervous system and sudden cardiac death. experimental basis and clinical observations for post-myocardial infarction risk stratification, Circulation, Suppl., 85 (1992), I77–91. |
| [39] |
J. P. V. Madeiro, E. Santos, P. C. Cortez, J. H. S. Felix, F. S. Schlindwein, Evaluating gaussian and rayleigh-based mathematical models for t and p-waves in ECG, IEEE Lat. Am. Trans., 15 (2017), 843–853. https://doi.org/10.1109/TLA.2017.7910197 doi: 10.1109/TLA.2017.7910197
|
| [40] | F. Pedregosa, G. Varoquaux, A. Gramfort, V. Michel, B. Thirion, O. Grisel, et al., Scikit-learn: Machine learning in python, J. Mach. Learn. Res., 12 (2011), 2825–2830. |
| [41] | B. Lantz, Machine Learning with R: Expert Techniques for Predictive Modeling, Packt publishing ltd, 2019. |
| [42] | J. Han, M. Kamber, J. Pei, Data Mining: Concepts and, Techniques, 3rd edition, 2011. |
| [43] |
N. V. Chawla, K. W. Bowyer, L. O. Hall, W. P. Kegelmeyer, Smote: synthetic minority over-sampling technique, J. Artif. Intell. Res., 16 (2002), 321–357. https://doi.org/10.1613/jair.953 doi: 10.1613/jair.953
|
| [44] | I. Rish, An empirical study of the naive bayes classifier, in IJCAI 2001 Workshop on Empirical Methods in Artificial Intelligence, 3 (2001), 41–46. |
| [45] | A. B. Cunha, D. M. Cunha, R. C. Pedrosa, F. Flammini, A. Silva, E. A. Saad, et al., Norepinephrine and heart rate variability: a marker of dysautonomia in chronic chagas cardiopathy, Port. J. Cardiol.: Off. J. Port. Soc. Cardiol., 22 (2003), 29–52. |
| [46] |
G. A. Ng, A. Mistry, X. Li, F. S. Schlindwein, W. B. Nicolson, Lifemap: towards the development of a new technology in sudden cardiac death risk stratification for clinical use, EP Europace, 20 (2018), f162–f170. https://doi.org/10.1093/europace/euy080 doi: 10.1093/europace/euy080
|
| [47] |
G. Tse, J. Zhou, S. Lee, T. Liu, G. Bazoukis, P. Mililis, et al., Incorporating latent variables using nonnegative matrix factorization improves risk stratification in brugada syndrome, J. Am. Heart Assoc., 9 (2020), e012714. https://doi.org/10.1161/JAHA.119.012714 doi: 10.1161/JAHA.119.012714
|
| [48] |
A. Lyon, R. Ariga, A. Mincholé, M. Mahmod, E. Ormondroyd, P. Laguna, et al., Distinct ECG phenotypes identified in hypertrophic cardiomyopathy using machine learning associate with arrhythmic risk markers, Front. Physiol., 9 (2018), 213. https://doi.org/10.3389/fphys.2018.00213 doi: 10.3389/fphys.2018.00213
|
| [49] |
K. Nakajima, T. Nakata, T. Doi, H. Tada, K. Maruyama, Machine learning-based risk model using 123 i-metaiodobenzylguanidine to differentially predict modes of cardiac death in heart failure, J. Nucl. Cardiol., 29 (2020), 1–12. https://doi.org/10.1007/s12350-020-02173-6 doi: 10.1007/s12350-020-02173-6
|
| [50] |
S. Shakibfar, O. Krause, C. Lund-Andersen, A. Aranda, J. Moll, T. O. Andersen, et al., Predicting electrical storms by remote monitoring of implantable cardioverter-defibrillator patients using machine learning, EP Europace, 21 (2019), 268–274. https://doi.org/10.1093/europace/euy257 doi: 10.1093/europace/euy257
|
| [51] |
J. Atallah, M. C. G. Corcia, E. P. Walsh, Participating Members of the Pediatric and Congenital Electrophysiology Society, Ventricular arrhythmia and life-threatening events in patients with repaired tetralogy of fallot, Am. J. Cardiol., 132 (2020), 126–132. https://doi.org/10.1016/j.amjcard.2020.07.012 doi: 10.1016/j.amjcard.2020.07.012
|
| [52] |
J. Rodriguez, S. Schulz, B. F. Giraldo, A. Voss, Risk stratification in idiopathic dilated cardiomyopathy patients using cardiovascular coupling analysis, Front. Physiol., 10 (2019), 841. https://doi.org/10.3389/fphys.2019.00841 doi: 10.3389/fphys.2019.00841
|
| [53] |
P. Vergara, W. S. Tzou, R. Tung, C. Brombin, A. Nonis, M. Vaseghi, et al., Predictive score for identifying survival and recurrence risk profiles in patients undergoing ventricular tachycardia ablation: the I-VT score, Circ.: Arrhythmia Electrophysiol., 11 (2018), e006730. https://doi.org/10.1161/CIRCEP.118.006730 doi: 10.1161/CIRCEP.118.006730
|
| [54] |
S. Lee, J. Zhou, K. H. C. Li, K. S. K. Leung, I. Lakhani, T. Liu, et al., Territory-wide cohort study of brugada syndrome in hong kong: predictors of long-term outcomes using random survival forests and non-negative matrix factorisation, Open Heart, 8 (2021), e001505. http://dx.doi.org/10.1136/openhrt-2020-001505 doi: 10.1136/openhrt-2020-001505
|
| [55] | M. Zoni-Berisso, D. Molini, S. Viani, G. S. Mela, L. Delfino, Noninvasive prediction of sudden death and sustained ventricular tachycardia after acute myocardial infarction using a neural network algorithm, Ital. Heart J.: Off. J. Ital. Fed. Cardiol., 2 (2001), 612–620. |
| [56] |
B. A. Goldstein, T. I. Chang, A. A. Mitani, T. L. Assimes, W. C. Winkelmayer, Near-term prediction of sudden cardiac death in older hemodialysis patients using electronic health records, Clin. J. Amer. Soc. Nephrol., 9 (2014), 82–91. http://dx.doi.org/10.2215/CJN.03050313 doi: 10.2215/CJN.03050313
|
| [57] |
M. S. Marcolino, D. M. Palhares, L. R. Ferreira, A. L. Ribeiro, Electrocardiogram and chagas disease: a large population database of primary care patients, Global Heart, 10 (2015), 167–172. https://doi.org/10.1016/j.gheart.2015.07.001 doi: 10.1016/j.gheart.2015.07.001
|
Figures(3) / Tables(6)

Carlos H. L. Cavalcante, Pedro E. O. Primo, Carlos A. F. Sales, Weslley L. Caldas, João H. M. Silva, Amauri H. Souza, Emmanuel S. Marinho, Roberto C. Pedrosa, João A. L. Marques, Hélcio S. Santos, João P. V. Madeiro. Sudden cardiac death multiparametric classification system for Chagas heart disease's patients based on clinical data and 24-hours ECG monitoring[J]. Mathematical Biosciences and Engineering, 2023, 20(5): 9159-9178. doi: 10.3934/mbe.2023402


 DownLoad: