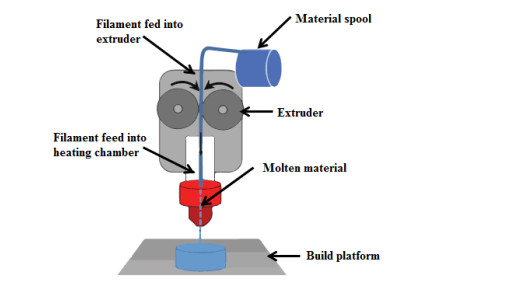
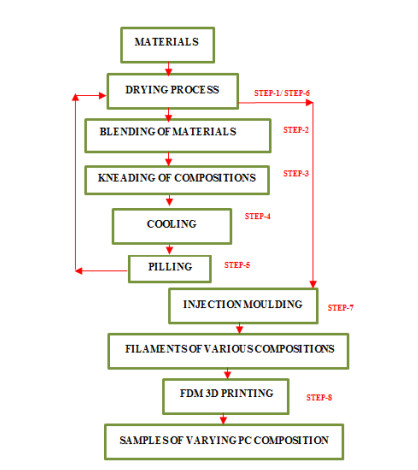
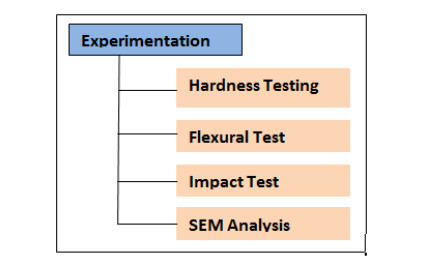
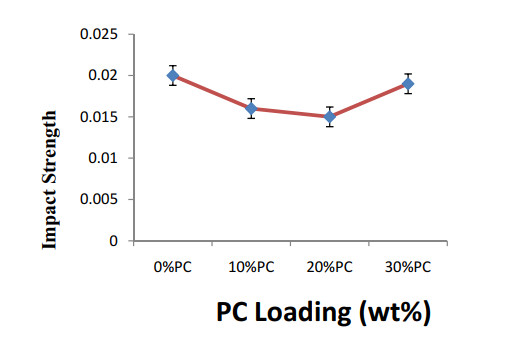
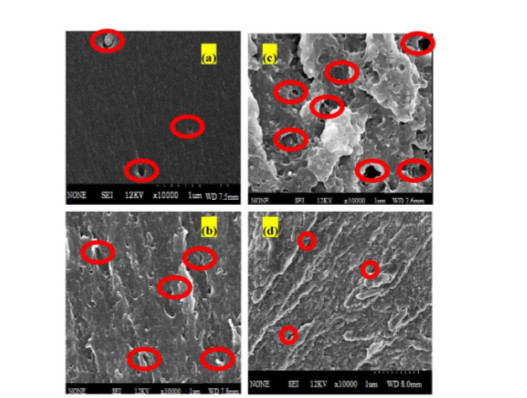
Fusion deposition modeling (FDM) is the most prevalent technique of additive manufacturing. This is for its practice in many applications. Polycarbonate (PC) reinforced acrylonitrile-butadiene-styrene (ABS) composite in 3D printing upsurges properties and crops better strength for components by 3D printing. A study on 3D printed (FDM) PC/ABS composite material was investigated in this paper. The influence of variations in material composition on mechanical properties such as hardness, flexural strength, and impact strength was studied. The proposed work aims at analyzing PC/ABS composite material by the FDM process in terms of mechanical performance, microstructural study, and their processibility. Specimens with three different compositions (10 wt%, 20 wt%, 30 wt%) polycarbonate (PC) reinforced in ABS were prepared. The best composition of polymer composite by FDM was proposed from their mechanical properties, and a microstructural study was done to trace the deviations in the impact strength of PC/ABS composite. The study evidences the compatibility of PC/ABS polymer composite. The hardness and strength of the composite are improved with a rise in polycarbonate (PC) content in the material. This exhibit excellent strength to the component at various compositions of polycarbonate reinforcement. Polymer composition contributes to producing intricate 3D printed components with various benefits and applicable for vast applications in many fields.
Citation: Mnvrl Kumar, R. Ramakrishnan, Alnura Omarbekova, Santhosh Kumar. R. Experimental characterization of mechanical properties and microstructure study of polycarbonate (PC) reinforced acrylonitrile-butadiene-styrene (ABS) composite with varying PC loadings[J]. AIMS Materials Science, 2021, 8(1): 18-28. doi: 10.3934/matersci.2021002
Fusion deposition modeling (FDM) is the most prevalent technique of additive manufacturing. This is for its practice in many applications. Polycarbonate (PC) reinforced acrylonitrile-butadiene-styrene (ABS) composite in 3D printing upsurges properties and crops better strength for components by 3D printing. A study on 3D printed (FDM) PC/ABS composite material was investigated in this paper. The influence of variations in material composition on mechanical properties such as hardness, flexural strength, and impact strength was studied. The proposed work aims at analyzing PC/ABS composite material by the FDM process in terms of mechanical performance, microstructural study, and their processibility. Specimens with three different compositions (10 wt%, 20 wt%, 30 wt%) polycarbonate (PC) reinforced in ABS were prepared. The best composition of polymer composite by FDM was proposed from their mechanical properties, and a microstructural study was done to trace the deviations in the impact strength of PC/ABS composite. The study evidences the compatibility of PC/ABS polymer composite. The hardness and strength of the composite are improved with a rise in polycarbonate (PC) content in the material. This exhibit excellent strength to the component at various compositions of polycarbonate reinforcement. Polymer composition contributes to producing intricate 3D printed components with various benefits and applicable for vast applications in many fields.

| [1] |
Ligon SC, Liska R, Stampfl J, et al. (2017) Polymers for 3D printing and customized additive manufacturing. Chem Rev 117: 10212-10290. doi: 10.1021/acs.chemrev.7b00074

|
| [2] |
Wang X, Jiang M, Zhou Z, et al. (2017) 3D printing of polymer matrix composites: A review and perspective. Compos Part B-Eng 110: 442-458. doi: 10.1016/j.compositesb.2016.11.034
|
| [3] |
Ngo TD, Kashani A, Imbalzano G, et al. (2018) Additive manufacturing (3D printing): A review of materials, methods, applications, and challenges. Compos Part B-Eng 143: 172-196. doi: 10.1016/j.compositesb.2018.02.012
|
| [4] | Park SJ, Lee JE, Lee HB, et al. (2020) 3D printing of bio-based polycarbonate and its potential applications in eco-friendly indoor manufacturing. Addit Manuf 31: 100974. |
| [5] |
Reich MJ, Woern AL, Tanikella NG, et al. (2019) Mechanical properties and applications of recycled polycarbonate particle material extrusion-based additive manufacturing. Materials 12: 1642. doi: 10.3390/ma12101642
|
| [6] |
Cantrell JT, Rohde S, Damiani D, et al. (2017) Experimental characterization of the mechanical properties of 3D-printed ABS and polycarbonate parts. Rapid Prototyping J 23: 811-824. doi: 10.1108/RPJ-03-2016-0042
|
| [7] |
Alaboodi AS, Sivasankaran S (2018) Experimental design and investigation on the mechanical behavior of novel 3D printed biocompatibility polycarbonate scaffolds for medical applications. J Manuf Process 35: 479-491. doi: 10.1016/j.jmapro.2018.08.035
|
| [8] |
Farcas MT, Stefaniak AB, Knepp AK, et al. (2019) Acrylonitrile butadiene styrene (ABS) and polycarbonate (PC) filaments three-dimensional (3-D) printer emissions-induced cell toxicity. Toxicol Lett 317: 1-12. doi: 10.1016/j.toxlet.2019.09.013
|
| [9] |
Rohde S, Cantrell J, Jerez A, et al. (2018) Experimental characterization of the shear properties of 3D-printed ABS and polycarbonate parts. Exp Mech 58: 871-884. doi: 10.1007/s11340-017-0343-6
|
| [10] |
Skowyra J, Pietrzak K, Alhnan MA (2015) Fabrication of extended-release patient-tailored prednisolone tablets via fused deposition modeling (FDM) 3D printing. Eur J Pharm Sci 68: 11-17. doi: 10.1016/j.ejps.2014.11.009
|
| [11] |
Mohamed OA, Masood SH, Bhowmik JL, et al. (2016) Effect of process parameters on the dynamic mechanical performance of FDM PC/ABS printed parts through the design of an experiment. J Mater Eng Perform 25: 2922-2935. doi: 10.1007/s11665-016-2157-6
|
| [12] |
Melnikova R, Ehrmann A, Finsterbusch K (2014) 3D printing of textile-based structures by Fused Deposition Modelling (FDM) with different polymer materials. IOP Conf Ser Mater Sci Eng 62: 012018. doi: 10.1088/1757-899X/62/1/012018
|
| [13] |
Dana HR, Barbe F, Delbreilh L, et al. (2019) Polymer additive manufacturing of ABS structure: influence of printing direction on mechanical properties. J Manuf Process 44: 288-298. doi: 10.1016/j.jmapro.2019.06.015
|
| [14] |
Popescu D, Zapciu A, Amza C, et al. (2018) FDM process parameters influence over the mechanical properties of polymer specimens: A review. Polym Test 69: 157-166. doi: 10.1016/j.polymertesting.2018.05.020
|
| [15] |
Mohamed OA, Masood SH, Bhowmik JL (2015) Optimization of fused deposition modeling process parameters: a review of current research and future prospects. Adv Manuf 3: 42-53. doi: 10.1007/s40436-014-0097-7
|
| [16] | Nancharaiah T (2011) Optimization of process parameters in FDM process using design of experiments. Int J Emerg Technol 2: 100-102. |
| [17] |
Wankhede V, Jagetiya D, Joshi A, et al. (2020) Experimental investigation of FDM process parameters using Taguchi analysis. Mater Today Proc 27: 2117-2120. doi: 10.1016/j.matpr.2019.09.078
|
| [18] |
Yadav D, Chhabra D, Gupta RK, et al. (2020) Modeling and analysis of significant process parameters of FDM 3D printer using ANFIS. Mater Today Proc 21: 1592-1604. doi: 10.1016/j.matpr.2019.11.227
|
| [19] |
Alqahtani F, Belton P, Zhang B, et al. (2020) An investigation into the formations of the internal microstructures of solid dispersions prepared by hot melt extrusion. Eur J Pharm Biopharm 155: 147-161. doi: 10.1016/j.ejpb.2020.08.018
|
| [20] |
Morita T, Yagai T, Banno N (2020) Microstructural study on Sn-Zn/Cu-Ti diffusion reaction for internal tin Nb3Sn conductor development. J Alloy Compd 848: 155465. doi: 10.1016/j.jallcom.2020.155465
|
| [21] |
Pagano C, Rebaioli L, Baldi F, et al. (2020) Relationships between size and mechanical properties of scaffold-like structures. Mech Adv Mater Struc 1-6. doi: 10.1080/15376494.2019.1709675
|
| [22] |
Serra T, Planell JA, Navarro M (2013) High-resolution PLA-based composite scaffolds via 3-D printing technology. Acta Biomater 9: 5521-5530. doi: 10.1016/j.actbio.2012.10.041
|
Figures(10) / Tables(2)

Mnvrl Kumar, R. Ramakrishnan, Alnura Omarbekova, Santhosh Kumar. R. Experimental characterization of mechanical properties and microstructure study of polycarbonate (PC) reinforced acrylonitrile-butadiene-styrene (ABS) composite with varying PC loadings[J]. AIMS Materials Science, 2021, 8(1): 18-28. doi: 10.3934/matersci.2021002


 DownLoad: