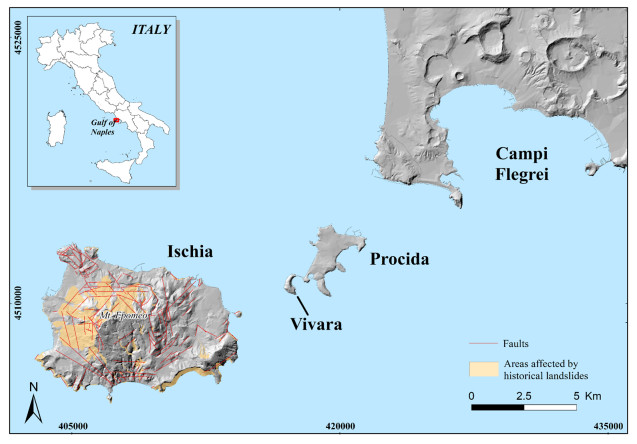
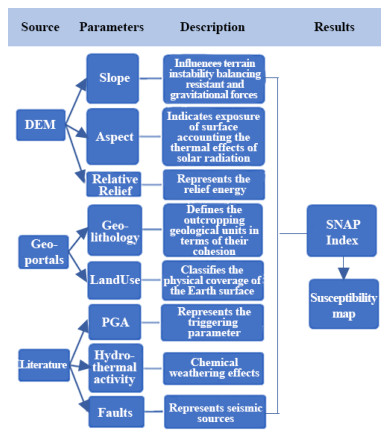
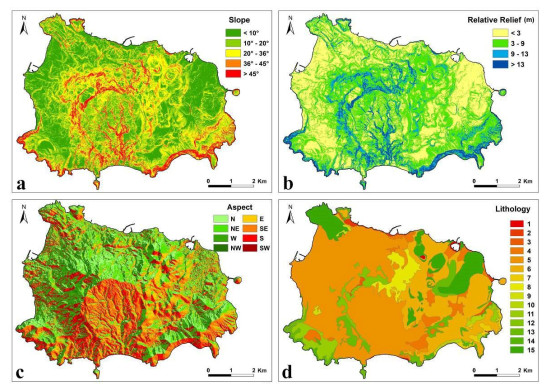
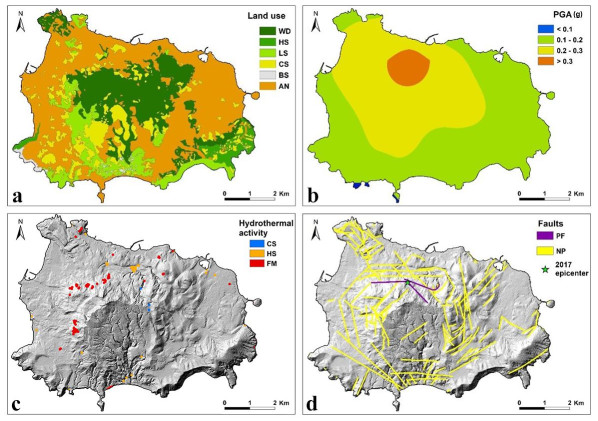
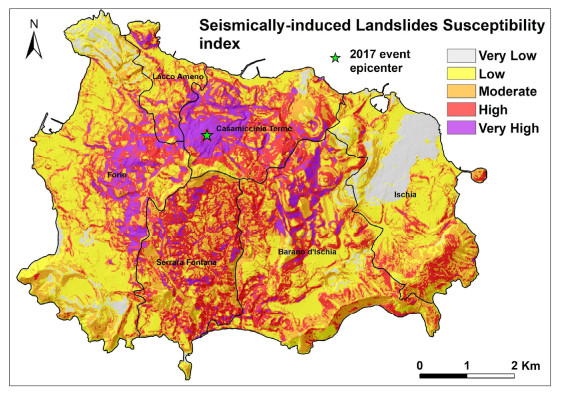
Ischia island represents the westernmost portion of the Phlegraean Volcanic District (Campania Region, Italy) and is characterized by the presence of Mt. Epomeo, a giant centrally located resurgent volcanic horst. This horst is controlled by fault systems and magmatic dynamics able to generate recurrent seismicity. Such seismicity, associated with the presence of volcanic terrains with different degrees of erodibility, makes Ischia highly subjected to several ground instability phenomena such as landslides. This multidisciplinary study aimed to map the seismically induced landslide susceptibility of the island, taking into account the Md 4.0 earthquake that occurred on August 21, 2017, as a reference seismic event. Eight parameters were isolated as relevant predisposing factors for landslide occurrence and combined, through GIS elaborations, to compute a numerical index (SNAP index) that quantified the seismically induced landslide susceptibility for each 5 × 5 m area. The resulting map, through five classes of susceptibility, highlights that the highest exposed areas are mainly localized along the N–NW flanks of Mt. Epomeo, involving mainly the municipality of Casamicciola Terme. Moreover, the map is discussed considering the spatial distribution of historical and recent seismically induced ground effects, an ERT field survey carried out on significant test sites, and the displacement map obtained by 2015–2022 InSAR data.
Citation: Roberto Gianardi, Marina Bisson, Lisa Beccaro, Riccardo De Ritis, Vincenzo Sepe, Laura Colini, Cristiano Tolomei, Luca Cocchi, Claudia Spinetti. High-resolution susceptibility mapping of seismically induced landslides on Ischia island: the 2017 earthquake case study[J]. AIMS Geosciences, 2024, 10(3): 573-597. doi: 10.3934/geosci.2024030
Ischia island represents the westernmost portion of the Phlegraean Volcanic District (Campania Region, Italy) and is characterized by the presence of Mt. Epomeo, a giant centrally located resurgent volcanic horst. This horst is controlled by fault systems and magmatic dynamics able to generate recurrent seismicity. Such seismicity, associated with the presence of volcanic terrains with different degrees of erodibility, makes Ischia highly subjected to several ground instability phenomena such as landslides. This multidisciplinary study aimed to map the seismically induced landslide susceptibility of the island, taking into account the Md 4.0 earthquake that occurred on August 21, 2017, as a reference seismic event. Eight parameters were isolated as relevant predisposing factors for landslide occurrence and combined, through GIS elaborations, to compute a numerical index (SNAP index) that quantified the seismically induced landslide susceptibility for each 5 × 5 m area. The resulting map, through five classes of susceptibility, highlights that the highest exposed areas are mainly localized along the N–NW flanks of Mt. Epomeo, involving mainly the municipality of Casamicciola Terme. Moreover, the map is discussed considering the spatial distribution of historical and recent seismically induced ground effects, an ERT field survey carried out on significant test sites, and the displacement map obtained by 2015–2022 InSAR data.

| [1] | Bonito M (1691) Terra tremante, o vero continuatione de li tremuoti dalla Creatione del mondo sino al tempo presente. Parrino & Muti, Napoli: 822. |
| [2] | Mercalli G (1883) Vulcani e fenomeni vulcanici in Italia (Vol. 3). A. Forni. |
| [3] | Mercalli G (1884) L'isola d'Ischia e il terremoto del 28 luglio 1883. Mem. Reg. Ist. Lombardo Scienze e Lettere 3: 99–154 |
| [4] | Johnston-Lavis HJ, Haughton S (1885) Monograph of the Earthquakes of Ischia: A Memoir Dealing with the Seismic Disturbances in that Island from Remotest Times, with Special Observations on Those of 1881 and 1883. Dulau & Company. |
| [5] | Baratta M (1901) I terremoti d'Italia: saggio di storia, geografia e bibliografia sismica italiana. No. 9. Fratelli Bocca. |
| [6] |
Cubellis E, Luongo G, Obrizzo F, et al. (2020) Contribution to knowledge regarding the sources of earthquakes on the island of Ischia (Southern Italy). Nat Hazards 100: 955–994. https://doi.org/10.1007/s11069-019-03833-8 doi: 10.1007/s11069-019-03833-8

|
| [7] |
De Vita S, Sansivero F, Orsi G, et al. (2006) Cyclical slope instability and volcanism related to volcano-tectonism in resurgent calderas: the Ischia island (Italy) case study. Eng Geol 86: 148–165. https://doi.org/10.1016/j.enggeo.2006.02.013 doi: 10.1016/j.enggeo.2006.02.013
|
| [8] |
Rapolla A, Paoletti V, Secomandi M (2010) Seismically-induced landslide susceptibility evaluation: application of a new procedure to the island of Ischia, Campania Region, Southern Italy. Eng Geol 114: 10–25. https://doi.org/10.1016/j.enggeo.2010.03.006 doi: 10.1016/j.enggeo.2010.03.006
|
| [9] |
Nappi R, Alessio G, Gaudiosi G, et al. (2018) The 21 August 2017 M d 4.0 Casamicciola earthquake: First evidence of coseismic normal surface faulting at the Ischia volcanic island. Seismol Res Lett 89: 1323–1334. https://doi.org/10.1785/0220180063 doi: 10.1785/0220180063
|
| [10] |
Selva J, Acocella V, Bisson M, et al. (2019) Multiple natural hazards at volcanic islands: a review for the Ischia volcano (Italy). J Appl Volcanol 8: 1–43. https://doi.org/10.1186/s13617-019-0086-4 doi: 10.1186/s13617-019-0086-4
|
| [11] |
De Novellis V, Carlino S, Castaldo R, et al. (2018) The 21 August 2017 Ischia (Italy) earthquake source model inferred from seismological, GPS, and DInSAR measurements. Geophys Res Lett 45: 2193–2202. https://doi.org/10.1002/2017GL076336 doi: 10.1002/2017GL076336
|
| [12] |
Nappi R, Porfido S, Paganini E, et al. (2021) The 2017, MD = 4.0, Casamicciola earthquake: ESI-07 scale evaluation and implications for the source model. Geosciences 11: 44. https://doi.org/10.3390/geosciences11020044 doi: 10.3390/geosciences11020044
|
| [13] | Azzaro R, Del Mese S, Graziani L, et al. (2017) QUEST-Rilievo macrosismico per il terremoto dell'isola di Ischia del 21 agosto 2017. |
| [14] | Del Prete S, Mele R (2006) Il contributo delle informazioni storiche per la valutazione della propensione al dissesto nell'Isola d'Ischia (Campania). Rend Soc Geol It 2: 29–47. |
| [15] |
Romeo S, D'Angiò D, Fraccica A, et al. (2023) Investigation and preliminary assessment of the Casamicciola landslide in the island of Ischia (Italy) on November 26, 2022. Landslides 20: 1265–1276. https://doi.org/10.1007/s10346-023-02064-0 doi: 10.1007/s10346-023-02064-0
|
| [16] |
Iovino M, Zampelli SP (2007) The April 30th, 2006, Mt. Vezzi landslides (Ischia Island, Italy) in the context of the sliding susceptibility of volcanic soils in Campania. Ital J Eng Geol Environ 2: 73–91. https://doi.org/10.4408/IJEGE.2007-02.O-06 doi: 10.4408/IJEGE.2007-02.O-06
|
| [17] |
De Vita P, Di Clemente E, Rolandi M, et al. (2007) Engineering geological models of the initial landslides occurred on the April 30th, 2006, at the Mount di Vezzi (Ischia Island, Italy). Ital J Eng Geol Environ 2: 119–141. https://doi.org/10.4408/IJEGE.2007-02.O-08 doi: 10.4408/IJEGE.2007-02.O-08
|
| [18] |
Nocentini M, Tofani V, Gigli G, et al. (2015) Modeling debris flows in volcanic terrains for hazard mapping: the case study of Ischia Island (Italy). Landslides 12: 831–846. https://doi.org/10.1007/s10346-014-0524-7 doi: 10.1007/s10346-014-0524-7
|
| [19] |
Vingiani S, Mele G, De Mascellis R, et al. (2015) Volcanic soils and landslides: a case study of the island of Ischia (southern Italy) and its relationship with other Campania events. Solid Earth 6: 783–797. https://doi.org/10.5194/se-6-783-2015 doi: 10.5194/se-6-783-2015
|
| [20] |
Ascione A, Cinque A, Franza A, et al. (2007) The geomorphic control on the initiation and propagation of the Mt. di Vezzi landslides (Ischia Island, Italy) occurred on 30th April 2006. Ital J Eng Geol Environ 2: 93–118. https://doi.org/10.4408/IJEGE.2007-02.O-07 doi: 10.4408/IJEGE.2007-02.O-07
|
| [21] |
Caccavale M, Matano F, Sacchi M (2017) An integrated approach to earthquake-induced landslide hazard zoning based on probabilistic seismic scenario for Phlegrean Islands (Ischia, Procida and Vivara), Italy. Geomorphology 295: 235–259. https://doi.org/10.1016/j.geomorph.2017.07.010 doi: 10.1016/j.geomorph.2017.07.010
|
| [22] |
Albano M, Saroli M, Montuori A, et al. (2018) The relationship between InSAR coseismic deformation and earthquake-induced landslides associated with the 2017 Mw 3.9 Ischia (Italy) earthquake. Geosciences 8: 303. https://doi.org/10.3390/geosciences8080303 doi: 10.3390/geosciences8080303
|
| [23] | Alessio G, Esposito E, Ferranti L, et al. (1996) Correlazione tra sismicità ed elementi strutturali nell'isola di Ischia. Ⅱ. Quaternario. Ital J Quat Sci 9: 303–308. |
| [24] | Caprari P, Della Seta M, Martino S, et al. (2018) Upgrade of the CEDIT database of earthquake-induced ground effects in Italy. Ital J Eng Geol Environ 18: 23–39. |
| [25] | Zei C, Tarabusi G, Ciuccarelli C, et al. (2024) CFTIlandslides, Italian database of historical earthquake-induced landslides. Istituto Nazionale di Geofisica e Vulcanologia (INGV). https://doi.org/10.13127/cfti/landslides |
| [26] |
Gillot PY, Chiesa S, Pasquare G, et al. (1982) < 33,000-yr K–Ar dating of the volcano–tectonic horst of the Isle of Ischia, Gulf of Naples. Nature 299: 242–245. https://doi.org/10.1038/299242a0 doi: 10.1038/299242a0
|
| [27] | Barra D, Cinque A, Italiano A, et al. (1992) Il Pleistocene superiore marino di Ischia: paleoecologia e rapporti con l'evoluzione tettonica recente. Studi Geologici Camerti, Special Vol. 231-243 |
| [28] |
Tibaldi A, Vezzoli L (2004) A new type of volcano flank failure: the resurgent caldera sector collapse, Ischia, Italy. Geophys Res Lett 31. https://doi.org/10.1029/2004GL020419 doi: 10.1029/2004GL020419
|
| [29] |
Carlino S, Cubellis E, Luongo G, et al. (2006) On the mechanics of caldera resurgence of Ischia Island (southern Italy). Geological Society, London, Special Publications, 269: 181–193. https://doi.org/10.1144/GSL.SP.2006.269.01.12 doi: 10.1144/GSL.SP.2006.269.01.12
|
| [30] |
De Vita S, Sansivero F, Orsi G, et al. (2010) Volcanological and structural evolution of the Ischia resurgent caldera (Italy) over the past 10 ky. Geol Soc Am Spec Pap 464: 193–239. https://doi.org/10.1130/2010.2464(10) doi: 10.1130/2010.2464(10)
|
| [31] |
Nappi R, Alessio G, Bellucci Sessa E (2010) A case study comparing landscape metrics to geologic and seismic data from the Ischia Island (Southern Italy). Appl Geomatics 2: 73–82. https://doi.org/10.1007/s12518-010-0023-z doi: 10.1007/s12518-010-0023-z
|
| [32] |
Martino S, Caprari P, Della Seta M, et al. (2020) Influence of geological complexities on local seismic response in the municipality of Forio (Ischia Island, Italy). Ital J Eng Geol Environ 20: 43–62. http://doi.org/10.4408/IJEGE.2020-02.O-04 doi: 10.4408/IJEGE.2020-02.O-04
|
| [33] |
Orsi G, Gallo G, Zanchi A (1991) Simple-shearing block resurgence in caldera depressions. A model from Pantelleria and Ischia. J Volcanol Geotherm Res 47: 1–11. https://doi.org/10.1016/0377-0273(91)90097-J doi: 10.1016/0377-0273(91)90097-J
|
| [34] |
Acocella V, Funiciello R (1999) The interaction between regional and local tectonics during resurgent doming: the case of the island of Ischia, Italy. J Volcanol Geotherm Res 88: 109–123. https://doi.org/10.1016/S0377-0273(98)00109-7 doi: 10.1016/S0377-0273(98)00109-7
|
| [35] | Rittmann A (1930) Geologie der insel Ischia. D. Reimer (E. Vohsen). |
| [36] | Vezzoli L (1988) Island of Ischia, In: Vezzoli L, editor. CNR Quaderni de "La ricerca scientifica"; 114–122. |
| [37] |
Sbrana A, Marianelli P, Pasquini G (2018) Volcanology of Ischia (Italy). J Maps 14: 494–503. https://doi.org/10.1080/17445647.2018.1498811 doi: 10.1080/17445647.2018.1498811
|
| [38] |
Civetta L, Gallo G, Orsi G (1991) Sr-and Nd-isotope and trace-element constraints on the chemical evolution of the magmatic system of Ischia (Italy) in the last 55 ka. J Volcanol Geotherm Res 46: 213–230. https://doi.org/10.1016/0377-0273(91)90084-D doi: 10.1016/0377-0273(91)90084-D
|
| [39] | Iacono A (1996) La guerra d'Ischia nel "De Bello Neapolitano" di G. Pontano. Quaderni dell'Accademia Pontaniana.19: 1–90. |
| [40] | Guadagno F, Mele R (1995) Movimenti franosi indotti da terremoti nell'isola d'Ischia, In: Bonardi G, De Vivo B, Gasparini P, Vallario A, Cinquant'anni di attività didattica e scientifica del Prof. Felice Ippolito. Liguori Editore, Napoli. |
| [41] | Mele R, Del Prete S (1998) Fenomeni di instabilità dei versanti di Tufo Verde del Monte Epomeo (Isola d'Ischia, Campania). Boll Soc Geol It 117: 93–112. |
| [42] | Del Prete S, Mele R (1999) L'Influenza dei fenomeni d'instabilità di versante nel quadro morfoevolutivo della costa dell'isola d'Ischia. Boll Soc Geol It 118: 339–360. |
| [43] |
Santo A, Di Crescenzo G, Del Prete S, et al. (2012) The Ischia island flash flood of November 2009 (Italy): Phenomenon analysis and flood hazard. Phys Chem Earth, Parts A/B/C 49: 3–17. https://doi.org/10.1016/j.pce.2011.12.004 doi: 10.1016/j.pce.2011.12.004
|
| [44] | ISPRA (2006) Progetto IFFI, In: Inventario dei Fenomeni Franosi in Italia. Available from: https://idrogeo.isprambiente.it/. |
| [45] | Autorità di Bacino della Campania Centrale (2015) Carta inventario dei fenomeni franosi. Piano Stralcio per l'Assetto Idrogeologico dell'Autorità di Bacino Nord-Occidentale della Campania. |
| [46] |
Bisson M, Spinetti C, Sulpizio R (2014) Volcaniclastic flow hazard zonation in the Sub-Apennine Vesuvian area using GIS and remote sensing. Geosphere 10: 1419–1431. https://doi.org/10.1130/GES01041.1 doi: 10.1130/GES01041.1
|
| [47] |
Bennie J, Hill MO, Baxter R, et al. (2006) Influence of slope and aspect on longterm vegetation change in British chalk grasslands. J Ecology 94: 355–368. https://doi.org/10.1111/j.1365-2745.2006.01104.x doi: 10.1111/j.1365-2745.2006.01104.x
|
| [48] |
Bovis MJ, Jakob M (1999) The role of debris supply conditions in predicting debris flow activity. Earth Surf Processes Landforms 24: 1039–1054. https://doi.org/10.1002/(SICI)1096-9837(199910)24:11%3C1039::AID-ESP29%3E3.0.CO;2-U doi: 10.1002/(SICI)1096-9837(199910)24:11%3C1039::AID-ESP29%3E3.0.CO;2-U
|
| [49] | Calcaterra D, Parise M, Palma B, et al. (1999) The May 5th 1998 landsliding event in Campania, Southern Italy: Inventory of slope movements in the Quindici area. In: Slope Stability Engineering. Routledge, 1361–1366. https://doi.org/10.1201/9780203739600-127 |
| [50] | Calcaterra D, Parise M, Palma B, et al. (2000) Multiple debris-flows in volcaniclastic materials mantling carbonate slopes. In: Wieczorek GF, Naeser ND, Debris-flow hazards mitigation: mechanics, prediction, and assessment. Balkema, Rotterdam, 99–107. |
| [51] |
De Baets S, Poesen J, Gyssels G, et al. (2006) Effects of grass roots on the erodibility of topsoils during concentrated flow. Geomorphology 76: 54–67. https://doi.org/10.1016/j.geomorph.2005.10.002 doi: 10.1016/j.geomorph.2005.10.002
|
| [52] | De Riso R, Budetta P, Calcaterra D, et al. (1999) Le colate rapide in terreni piroclastici del territorio campano, In: Convegno Previsione e prevenzione di movimenti franosi rapidi, Trento, 17–19. |
| [53] |
Gyssels G, Poesen J (2003) The importance of plant root characteristics in controlling concentrated flow erosion rates. Earth Surf Processes Landforms 28: 371–384. https://doi.org/10.1002/esp.447 doi: 10.1002/esp.447
|
| [54] | Mejía-Navarro M, Wohl EE, Oaks SD (1994) Geological hazards, vulnerability, and risk assessment using GIS: model for Glenwood Springs, Colorado, In: Geomorphology and Natural Hazards, Elsevier, 331–354. https://doi.org/10.1016/B978-0-444-82012-9.50025-6 |
| [55] |
Pimentel D, Kounang N (1998) Ecology of soil erosion in ecosystems. Ecosystems 1: 416–426. https://doi.org/10.1007/s100219900035 doi: 10.1007/s100219900035
|
| [56] |
Spinetti C, Bisson M, Tolomei C, et al. (2019). Landslide susceptibility mapping by remote sensing and geomorphological data: Case studies on the Sorrentina Peninsula (Southern Italy). GIScience Remote Sens 56: 940–965. https://doi.org/10.1080/15481603.2019.1587891 doi: 10.1080/15481603.2019.1587891
|
| [57] |
Tang C, Zhu J, Liang J (2009) Emergency assessment of seismic landslide susceptibility: a case study of the 2008 Wenchuan earthquake affected area. Earthquake Eng Eng Vib 8: 207–217. https://doi.org/10.1007/s11803-009-9025-4 doi: 10.1007/s11803-009-9025-4
|
| [58] | Burrough PA, McDonnell RA, Lloyd CD (2015) Principles of geographical information systems. Oxford University Press, USA. |
| [59] |
Paparo MA, Tinti S (2017) Analysis of seismic‐driven instability of Mt. Nuovo in the Ischia Island, Italy. Bull Seismol Soc Am 107: 750–759. https://doi.org/10.1785/0120160139 doi: 10.1785/0120160139
|
| [60] |
Vrieling A (2006) Satellite remote sensing for water erosion assessment: A review. Catena 65: 2–18. https://doi.org/10.1016/j.catena.2005.10.005 doi: 10.1016/j.catena.2005.10.005
|
| [61] |
Cao J, Zhang Z, Wang C, et al. (2019) Susceptibility assessment of landslides triggered by earthquakes in the Western Sichuan Plateau. Catena 175: 63–76. https://doi.org/10.1016/j.catena.2018.12.013 doi: 10.1016/j.catena.2018.12.013
|
| [62] |
Chalkias C, Maria F, Christos P (2014) GIS-Based Landslide Susceptibility Mapping on the Peloponnese Peninsula, Greece Geosciences 4: 176–190. https://doi.org/10.3390/geosciences4030176 doi: 10.3390/geosciences4030176
|
| [63] |
Gadtaula A, Dhakal S (2019) Landslide susceptibility mapping using weight of evidence method in Haku, Rasuwa district, Nepal. J Nepal Geol Soc 58: 163–171. https://doi.org/10.3126/jngs.v58i0.24601 doi: 10.3126/jngs.v58i0.24601
|
| [64] | Ruiz P, Carr MJ, Alvarado GE, et al. (2019) Coseismic Landslide Susceptibility Analysis Using LiDAR Data PGA Attenuation and GIS: The Case of Poás Volcano, Costa Rica, Central America. In: Tassi F, Vaselli O, Mora Amador R, (eds). Poás Volcano. Active Volcanoes of the World. Springer, Cham. https://doi.org/10.1007/978-3-319-02156-0_4 |
| [65] |
Regmi AD, Dhital MR, Zhang J, et al. (2016) Landslide susceptibility assessment of the region affected by the 25 April 2015 Gorkha earthquake of Nepal. J Mt Sci 13: 1941–1957. https://doi.org/10.1007/s11629-015-3688-2 doi: 10.1007/s11629-015-3688-2
|
| [66] |
Shao X, Xu C (2022) Earthquake-induced landslides susceptibility assessment: A review of the state-of-the-art. Nat Hazards Res 2: 172–182. https://doi.org/10.1016/j.nhres.2022.03.002 doi: 10.1016/j.nhres.2022.03.002
|
| [67] |
Wasowski J, Pierri V, Pierri P, et al. (2002) Factors Controlling Seismic Susceptibility of the Sele Valley Slopes: The Case of the 1980 Irpinia Earthquake Re-Examined. Surv Geophys 23: 563–593. https://doi.org/10.1023/A:1021230928587 doi: 10.1023/A:1021230928587
|
| [68] |
Chen LK, Chih-Hsin C, Che-Hsin L, et al. (2020) Application of a Three-Dimensional Deterministic Model to Assess Potential Landslides, a Case Study: Antong Hot Spring Area in Hualien, Taiwan. Water 12: 480. https://doi.org/10.3390/w12020480 doi: 10.3390/w12020480
|
| [69] |
Reichenbach P, Busca C, Mondini AC, et al. (2014) The influence of land use change on landslide susceptibility zonation: the Briga catchment test site (Messina, Italy). Environ Manage 54: 1372–1384. https://doi.org/10.1007/s00267-014-0357-0 doi: 10.1007/s00267-014-0357-0
|
| [70] |
Vergari F, Della Seta M, Del Monte M, et al. (2011) Landslide susceptibility assessment in the Upper Orcia Valley (Southern Tuscany, Italy) through conditional analysis: a contribution to the unbiased selection of causal factors. Nat Hazards Earth Syst Sci 11: 1475–1497. https://doi.org/10.5194/nhess-11-1475-2011 doi: 10.5194/nhess-11-1475-2011
|
| [71] |
Lee S, Talib JA (2005) Probabilistic landslide susceptibility and factor effect analysis. Environ Geol 47: 982–990. https://doi.org/10.1007/s00254-005-1228-z doi: 10.1007/s00254-005-1228-z
|
| [72] |
Yilmaz I (2009) Landslide susceptibility mapping using frequency ratio, logistic regression, artificial neural networks and their comparison: a case study from Kat landslides (Tokat—Turkey). Comput Geosci. 35: 1125–1138. https://doi.org/10.1016/j.cageo.2008.08.007 doi: 10.1016/j.cageo.2008.08.007
|
| [73] |
Rad S, Rivé K, Allègre CJ (2011) Weathering regime associated with subsurface circulation on volcanic islands. Aquat Geochem 17: 221–241. https://doi.org/10.1007/s10498-011-9122-7 doi: 10.1007/s10498-011-9122-7
|
| [74] | Mujalli GR (2019) The role of temperature in processes controlling weathering rates of carbonate lithologies and volcanic systems. Staats-und Universitä tsbibliothek Hamburg Carl von Ossietzky. |
| [75] |
Beccaro L, Tolomei C, Gianardi R, et al. (2021). Multitemporal and Multisensor InSAR Analysis for Ground Displacement Field Assessment at Ischia Volcanic Island (Italy). Remote Sens 13: 4253. https://doi.org/10.3390/rs13214253 doi: 10.3390/rs13214253
|
| [76] |
De Alteriis G, Insinga DD, Morabito S, et al. (2010). Age of submarine debris avalanches and tephrostratigraphy offshore Ischia Island, Tyrrhenian Sea, Italy. Mar Geol 278: 1–18. https://doi.org/10.1016/j.margeo.2010.08.004 doi: 10.1016/j.margeo.2010.08.004
|
| [77] |
Chiocci FL, De Alteriis G (2006) The Ischia debris avalanche: first clear submarine evidence in the Mediterranean of a volcanic island prehistorical collapse. Terra Nova 18: 202–209. https://doi.org/10.1111/j.1365-3121.2006.00680.x doi: 10.1111/j.1365-3121.2006.00680.x
|
| [78] | Reynolds JM (2011) An introduction to applied and environmental geophysics. John Wiley & Sons. |
| [79] |
Perrone A, Lapenna V, Piscitelli S (2014) Electrical resistivity tomography technique for landslide investigation: A review. Earth-Sci Rev 135: 65–82. https://doi.org/10.1016/j.earscirev.2014.04.002 doi: 10.1016/j.earscirev.2014.04.002
|
| [80] |
Chambers JE, Wilkinson PB, Kuras O, Ford JR, Gunn DA, Meldrum PI, et al. (2011). Three-dimensional geophysical anatomy of an active landslide in Lias Group mudrocks, Cleveland Basin, UK. Geomorphology 125: 472–484. https://doi.org/10.1016/j.geomorph.2010.09.017 doi: 10.1016/j.geomorph.2010.09.017
|
| [81] |
Storz H, Storz W, Jacobs F (2000) Electrical resistivity tomography to investigate geological structures of the earth's upper crust. Geophys Prospect 48: 455–472. https://doi.org/10.1046/j.1365-2478.2000.00196.x doi: 10.1046/j.1365-2478.2000.00196.x
|
| [82] |
Loke MH, Barker RD (1996) Rapid least-squares inversion of apparent resistivity pseudo sections using a quasi-Newton method. Geophys Prospect 44: 131–152. https://doi.org/10.1111/j.1365-2478.1996.tb00142.x doi: 10.1111/j.1365-2478.1996.tb00142.x
|
| [83] |
Loke MH, Dahlin T (2002) A comparison of the gauss–Newton and quasi-Newton methods in resistivity imaging inversion. J Applied Geophys 49: 149–162. https://doi.org/10.1016/S0926-9851(01)00106-9 doi: 10.1016/S0926-9851(01)00106-9
|
| [84] |
Berardino P, Fornaro G, Lanari R, et al. (2002) A new algorithm for surface deformation monitoring based on small baseline differential interferograms. IEEE Trans Geosci Remote Sens 40: 11. https://doi.org/10.1109/TGRS.2002.803792 doi: 10.1109/TGRS.2002.803792
|
| [85] |
Fialko Y, Simons M, Agnew D (2001) The complete (3-D) surface displacement field in the epicentral area of the 1999 MW7.1 Hector Mine Earthquake, California, from space geodetic observations. Geophys Res Lett 28: 3063–3066. https://doi.org/10.1029/2001GL013174 doi: 10.1029/2001GL013174
|
| [86] |
Just D, Bamler R (1994) Phase statistics of interferograms with applications to synthetic aperture radar. Appl Opt 33: 4361–4368. https://doi.org/10.1364/AO.33.004361 doi: 10.1364/AO.33.004361
|
Figures(11) / Tables(2)

Roberto Gianardi, Marina Bisson, Lisa Beccaro, Riccardo De Ritis, Vincenzo Sepe, Laura Colini, Cristiano Tolomei, Luca Cocchi, Claudia Spinetti. High-resolution susceptibility mapping of seismically induced landslides on Ischia island: the 2017 earthquake case study[J]. AIMS Geosciences, 2024, 10(3): 573-597. doi: 10.3934/geosci.2024030


 DownLoad: