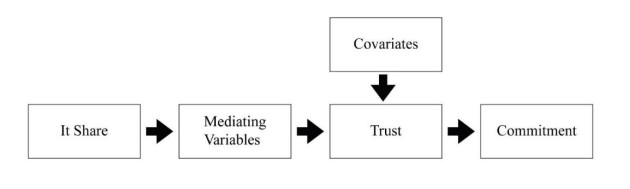
Purpose - The purpose of this paper is to test the hypothesis that the fundamentals of the supply chain relationships have not changed during the digital transformation period in Korea between 2006 and 2018. Design/methodology/approach - The data for this study were collected through a questionnaire-based survey during two different time periods in Korea, 2006 and 2018. Findings - This study reveals that supply chain professionals in 2006 regarded trust building process as the most important construct for the successful supply chain operations while in the 2018 survey, trust-based commitment became the most important construct. This paper concludes that supply chain sustainability will be enhanced based on strong supply chain relationship framework. Originality/value - This study reaffirmed that a supply chain relationship built on a trust-based commitment is still the pathway to successful supply chain implementation. As far as we know, no studies have been published in examining supply chain relationships during the digital transformation in two time periods.
Citation: Ik-Whan G. Kwon, Nina Shin, Sung-Ho Kim, Hamed Usman. Trust and commitment in supply chain during digital transformation: A case in Korea[J]. AIMS Environmental Science, 2021, 8(6): 641-655. doi: 10.3934/environsci.2021040
Purpose - The purpose of this paper is to test the hypothesis that the fundamentals of the supply chain relationships have not changed during the digital transformation period in Korea between 2006 and 2018. Design/methodology/approach - The data for this study were collected through a questionnaire-based survey during two different time periods in Korea, 2006 and 2018. Findings - This study reveals that supply chain professionals in 2006 regarded trust building process as the most important construct for the successful supply chain operations while in the 2018 survey, trust-based commitment became the most important construct. This paper concludes that supply chain sustainability will be enhanced based on strong supply chain relationship framework. Originality/value - This study reaffirmed that a supply chain relationship built on a trust-based commitment is still the pathway to successful supply chain implementation. As far as we know, no studies have been published in examining supply chain relationships during the digital transformation in two time periods.

| [1] | Corkery M, Yaffe-Bellany D (2020) U.S. Food Supply Chain Is Strained as Virus Spreads. The New York Times, April 13, available at https://www.nytimes.com/2020/04/13/business/coronavirus-food-supply.html |
| [2] | Yap CW, Emont J (2020) World Economy Shudders as Coronavirus Threatens Global Supply Chains. The Wall Street Journal Digital Articles, 23 February, available at: https://www.wsj.com/articles/world-economy-shudders-as-coronavirus-threatens-global-supply-chains-11582474608 |
| [3] | Frikkee T (2020) Covid-19 crisis has laid bare weaknesses in supply chains. Financial Times Digital Articles, 11 May, available at: https://www.ft.com/content/9bb6939d-6a31-4a33-bb62-ecbf74da8491 |
| [4] | CNN Business (2020) People are hoarding toilet paper. The truth about the supply chain. CNN Video Stories, 18 March, available at: https://www.cnn.com/videos/business/2020/03/18/coronavirus-toilet-paper-supply-chain.CNN-business |
| [5] | Lyall A, Mercier P, Gstettner S (2018) The Death of Supply Chain Management. Harvard Business Rev Digital Articles. 15 June, available at: https://hbr.org/2018/06/the-death-of-supply-chain-management |
| [6] | Simchi-Levi D, Smichi-Levi E (2020) We Need a Stress Test for Critical Supply Chains. Harvard Business Review Digital Articles, 28 April. Available at: https://hbr.org/2020/04/we-need-a-stress-test-for-critical-supply-chains |
| [7] |
Niderman F, Mathieu R, Morley R, et al. (2007) Examining RFID Applications in Supply Chain Management Using a Data Lifecycle Framework. Commun ACM 50: 92-101. doi: 10.1145/1272516.1272520

|
| [8] | Rogers DS, Taylor T, Beristain-Barajas R, et al. (2018) Blackchain and supply management. CAPS Research, Arizona State University. Available at: https://www.youtube.com/watch?v=tHA8M-h4nss |
| [9] | World Bank (2021) Korea Per Capital Income from 2006 to 2019. |
| [10] | OECD (2021) Internet access (indicator). Available at: doi: 10.1787/69c2b997-en(Accessedon17May2021). |
| [11] |
Calatayud A, Mangan J, Christopher M (2019) The self-thinking supply chain. Supply Chain Manag 24: 22-38. doi: 10.1108/SCM-03-2018-0136
|
| [12] | Farahani P, Meier C, Wilke J (2017) Digital supply chain management agenda for the automotive supplier industry. Shaping the Digital Enterprise, Springer, Cham: 157-172. |
| [13] |
Pradabwong J, Braziotis C, Tannock JD, et al. (2017) Business process management and supply chain collaboration: effects on performance and competitiveness. Supply Chain Manag 22: 107-121. doi: 10.1108/SCM-01-2017-0008
|
| [14] | Trace Link (2021) Achieving Operational Excellence Through Digitalization and Continuous Process Improvement. |
| [15] | KPMG (2021) Logistics 2030 Navigating a disruptive decade. |
| [16] | Gupta P (2021) Transforming supply chains for higher performance and resiliency. Harvard Business Review. Research Report. |
| [17] |
Kwon IW, Kim SH, Martin D (2021) Integrating Social Determinants of Health to Precision Medicine Though Digital Transformation: An Exploratory Roadmap. Int J Environ Res Pub He 18: 5018-5027. doi: 10.3390/ijerph18095018
|
| [18] | CSCMP (2021a) Digital Transformation in Supply Chain Planning: 2021. |
| [19] | Reuters Report (2021) Future Digitization of Supply Chain Planning. |
| [20] | Shin N, Yoo J, Kwon IW (2020) Fostering trust and commitment in complex project networks through dedicated investment in partnership management. J Sustain 12: 2-21. |
| [21] | Handfield RB, Nichols EL (1999) Introduction to Supply Chain Management. New Jersey: Prentice Hall, Upper Saddle River, NJ. |
| [22] |
Tejpal G, Garg RK, Sachdeva A (2013) Trust among supply chain partners: a review. Meas Bus Excellence 17: 51-71. doi: 10.1108/13683041311311365
|
| [23] |
Kiessling T, Harvey M, Garrison G (2004) The Importance of Boundary-Spanners in Global Supply Chains and Logistics Management in the 21st Century. J Global Mar 17: 93-115. doi: 10.1300/J042v17n04_06
|
| [24] | Park KO, Chang H, Jung DH (2017) How Do Power Type and Partnership Quality Affect Supply Chain Management Performance? Sustainability 9: 1-16. |
| [25] | Henke JW, Stallkamp TT, Yeniyurt S (2014) Lost Supplier Trust, Lost Profits. Supply Chain Manag Rev Digital Articles 24-32. |
| [26] | Partida B (2015) Close Relationships Lead to Superior Planning. Supply Chain Manag Review Digital Articles 70-72. |
| [27] |
Lee C, Kwon IW, Severance D (2007) Relationship between Supply Chain Performance and Degree of Linkage among Supplier, Internal Integration, and Customer. Supply Chain Manag 12: 444-452. doi: 10.1108/13598540710826371
|
| [28] | Sheffi Y (2015) The Power of Resilience: How the Best Companies Managed Unexpected. Massachusetts: MIT Press. |
| [29] |
Vijayasarathy LR (2010) Supply I ntegration: An investigation of its multi-dimensionality and relational antecedents. Int J Prod Econ 124: 489-505. doi: 10.1016/j.ijpe.2010.01.010
|
| [30] |
Chen JV, Yen DC, Rajkumar TM, Tomochko NA (2010) The antecedent factors on trust and commitment in supply chain relationships. Comp Stand Inter 33: 262-270. doi: 10.1016/j.csi.2010.05.003
|
| [31] |
Ndubisi NO (2011) Conflict handling, trust and commitment in outsourcing relationship: A Chinese and Indian study. Ind Market Manag 40: 109-117. doi: 10.1016/j.indmarman.2010.09.015
|
| [32] |
Abdullah Z, Musa R (2014) The Effect of Trust and Information Sharing on Relationship. Procedia-Social Behav Sc 130: 266-272. doi: 10.1016/j.sbspro.2014.04.031
|
| [33] |
Tsanos CS, Zografos KG (2016) The effects of behavioral supply chain relationship antecedents on integration and performance. Supply Chain Manag 21: 678-693. doi: 10.1108/SCM-06-2016-0211
|
| [34] |
Afshan N, Chatterjee S, Chhetri P (2018) Impact of information technology and relational aspect on supply chain collaboration leading to financial performance: A study in Indian context. Benchmark 25: 2496-2511. doi: 10.1108/BIJ-09-2016-0142
|
| [35] |
Morgan RM, Hunt S (1994) The Commitment-Trust Theory of Relationship Marketing. J Market 58: 20-38. doi: 10.1177/002224299405800302
|
| [36] |
Kwon IW, Suh T (2005) Trust, Commitment and Relationships in Supply Chain Management: A Path Analysis. Supply Chain Manag 10: 26-33. doi: 10.1108/13598540510578351
|
| [37] | Supply Chain World (2015) Future of Supply Chain Survey. |
| [38] |
Kwon IW, Suh T (2004) Factors Affecting the Level of Trust and Commitment in Supply Chain Relationships. J Supply Chain Manag 40: 4-14. doi: 10.1111/j.1745-493X.2004.tb00165.x
|
| [39] | Hong S, Kwon IW, Kim M (2007) Study on Impact of Trust in Supply Chain Partnership. Korea Log Rev 17: 119-139. |
| [40] |
Khor KS, Udin ZM, Ramayah T, et al. (2016) Reverse logistics in Malaysia: The Contingent role of institutional pressure. Int J Prod Econ 175: 96-108. doi: 10.1016/j.ijpe.2016.01.020
|
| [41] |
Fawcett SE, Wallin C, Allred C, et al. (2011) Information technology as an enabler of supply chain collaboration: a dynamic-capabilities perspective. J Supply Chain Manag 47: 38-59. doi: 10.1111/j.1745-493X.2010.03213.x
|
| [42] |
Wiengarten F, Humphreys P, Cao G, et al. (2010) Collaborative supply chain practices and performance: exploring the key role of information quality. Supply Chain Manag 15: 463-473. doi: 10.1108/13598541011080446
|
| [43] |
Vickery SK, Jayaram J, Droge C, et al. (2003) The effects of an integrative supply chain strategy on customer service and financial performance: an analysis of direct versus indirect relationships. J Oper Manag 21: 523-539. doi: 10.1016/j.jom.2003.02.002
|
| [44] | Association of Supply Chain Management (2020) ASCM Salary, June. |
| [45] | Geraint J (2014) OEM profitability and supplier's relations study. SCM World, August. |
| [46] |
Kaiser HF (1981) A revised measure of sampling adequacy for factor-analytic data metrics. Educ Psychol Meas 41: 401-415. doi: 10.1177/001316448104100219
|
| [47] |
Heide JB (1994) Interorganizational Governance in Marketing Channels. J Market 58: 71-85. doi: 10.1177/002224299405800106
|
| [48] |
Heide JB, John G (1990) Alliances in Industrial Purchasing: The Determinants of Joint Action in Buyer-Supplier Relationships. J Market Res 17: 24-36. doi: 10.1177/002224379002700103
|
| [49] | Kwon IW, Hamilton J, Hong SJ (2012) Trust and Transaction Cost in Supply Chain Cost Optimization: An Exploratory Study in Inter-Organizational Information Systems and Business Management: Theories for Researchers. Kishor Vaidya edited IGI Global Publication. |
| [50] | Brown JR, Crosno JL, Tong PY (2018) Is the theory of trust and commitment in marketing relationships incomplete? Ind Market Manag 77: 159-169. |
| [51] | CSCMP (2021b) Logistics 2030: navigating a disruptive decade. |
Figures(1) / Tables(2)

Ik-Whan G. Kwon, Nina Shin, Sung-Ho Kim, Hamed Usman. Trust and commitment in supply chain during digital transformation: A case in Korea[J]. AIMS Environmental Science, 2021, 8(6): 641-655. doi: 10.3934/environsci.2021040


 DownLoad: