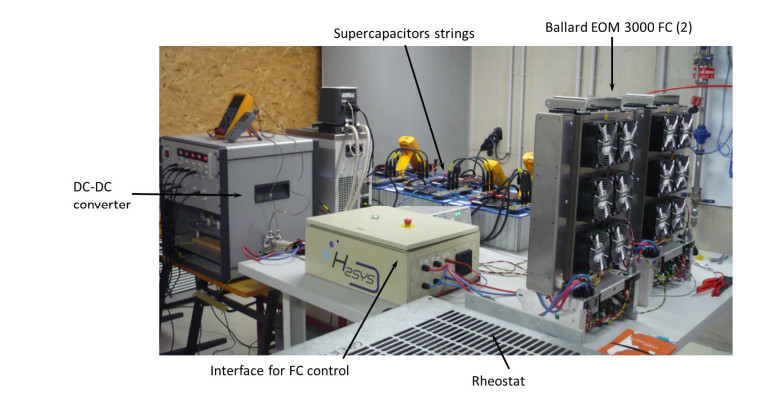
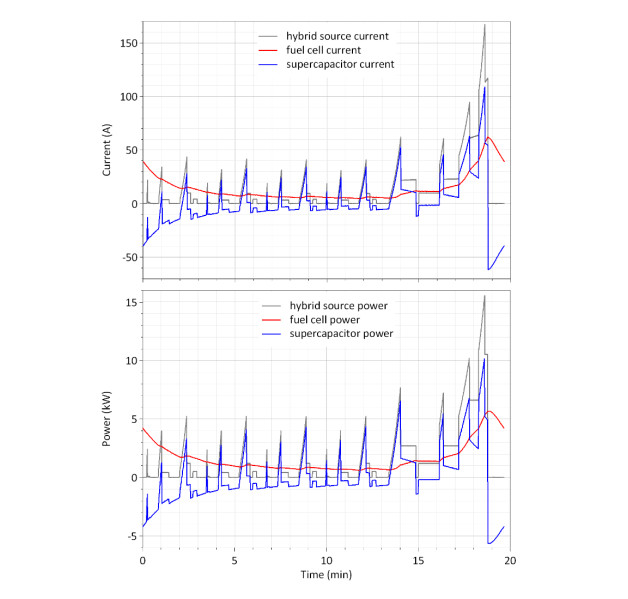
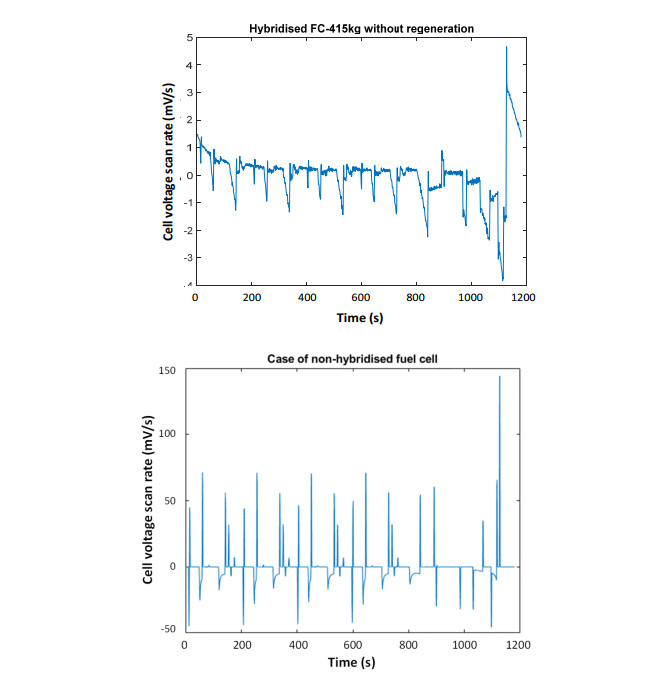
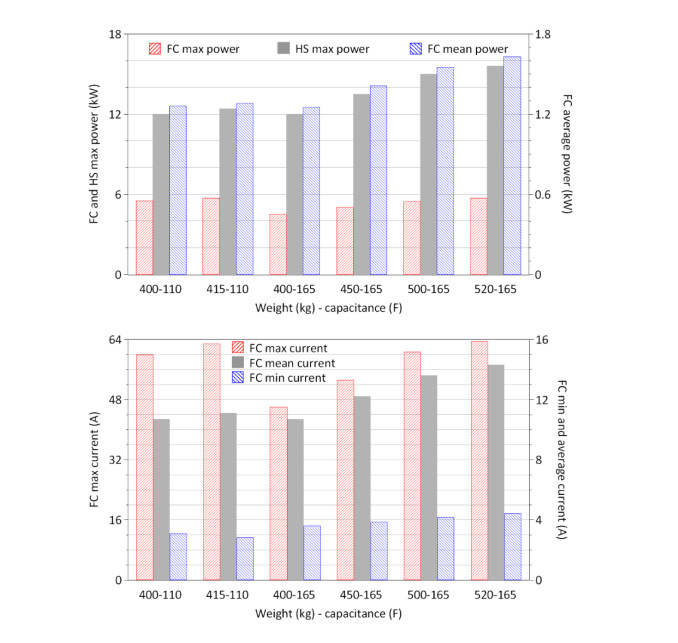
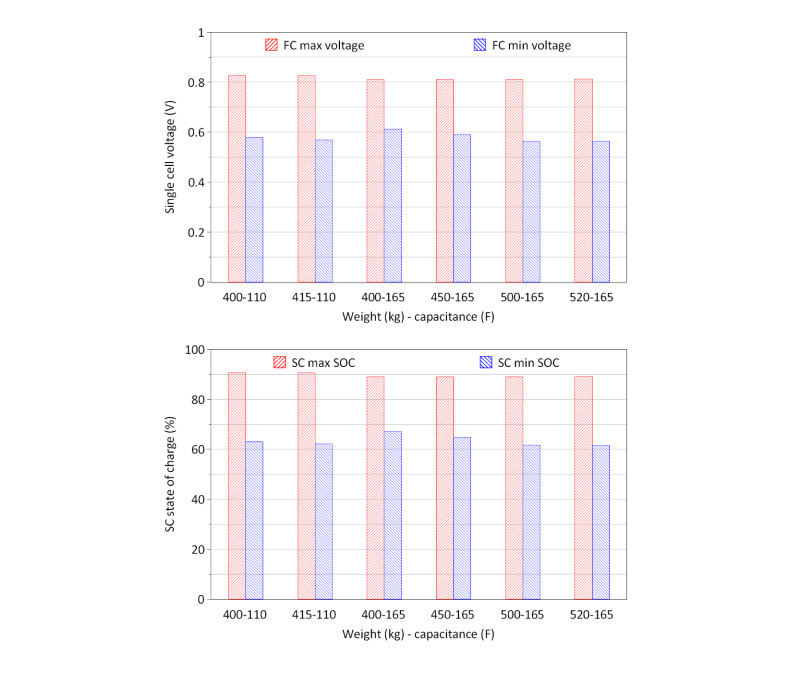
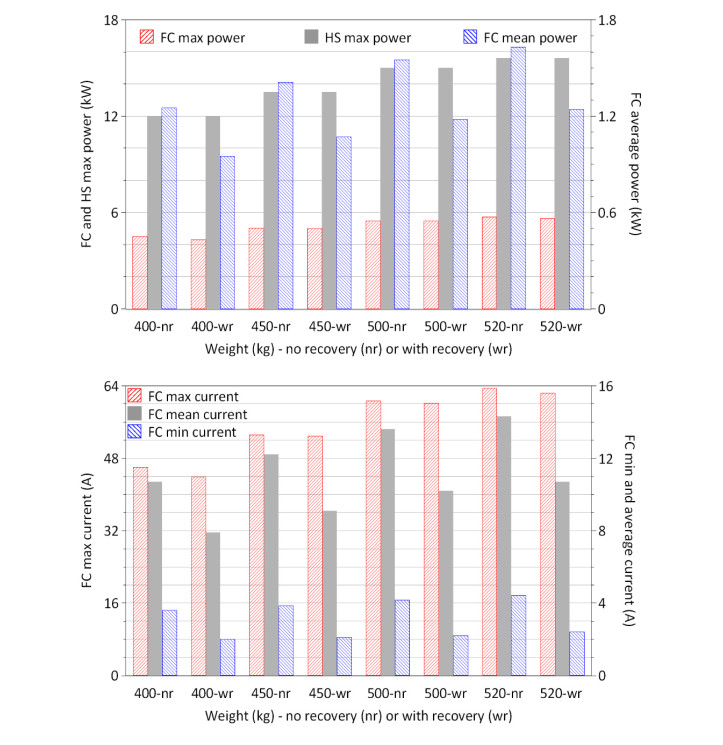
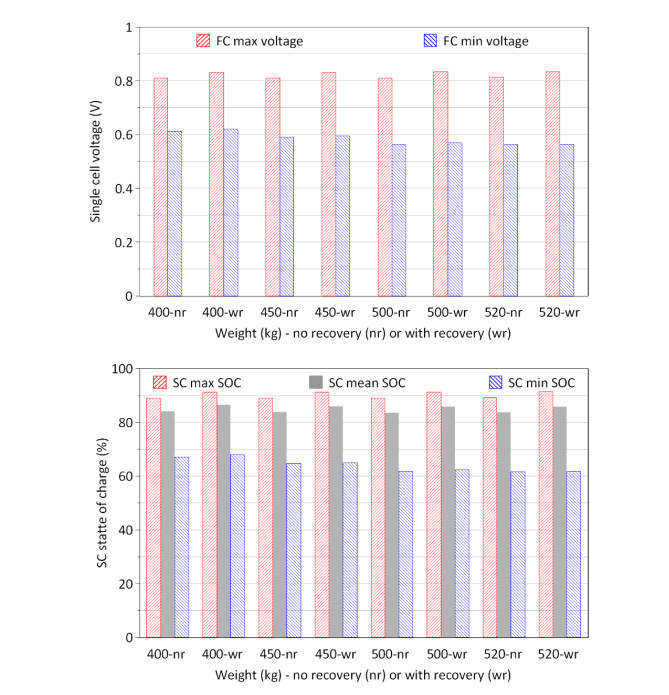
In view to proposing an alternative to oversized energy sources currently installed in electric vehicles for suburban transport, a direct hybrid fuel cell (FC)-supercapacitors (SC) source has been designed and tested on a test bench. The rated 15.6 kW source—with an air-cooled 5.6 kW FC and a 165 F SC storage device—was shown perfectly suited to traction of a 520 kg vehicle along the NEDC cycle, then validating the previously developed concept of a one-ton car propelled by a 10 kW FC in the rated 30 kW hybrid source for this cycle. In comparison with a FC used alone, hybridization was shown to allow the power demand for the cell to vary in quite a narrower range, as formerly observed. Moreover, the rates of fuel cell voltage and current generated in the driving cycle, were shown to be reduced by one order of magnitude by the direct hybridization which is to contribute to the FC durability. Two operating parameters were shown to have a significant effect on the hybrid source efficiency, namely the capacity of the SC at 110 or 165 F, and the recovery of deceleration power—emulated by an external power supply—which can decrease by 25% the fuel consumption in NEDC cycle conditions, as predicted by the model.
Citation: Caroline Bonnet, Stéphane Raël, Melika Hinaje, Sophie Guichard, Théophile Habermacher, Julian Vernier, Xavier François, Marie-Cécile Péra, François Lapicque. Direct fuel cell—supercapacitor hybrid power source for personal suburban transport[J]. AIMS Energy, 2021, 9(6): 1274-1298. doi: 10.3934/energy.2021059
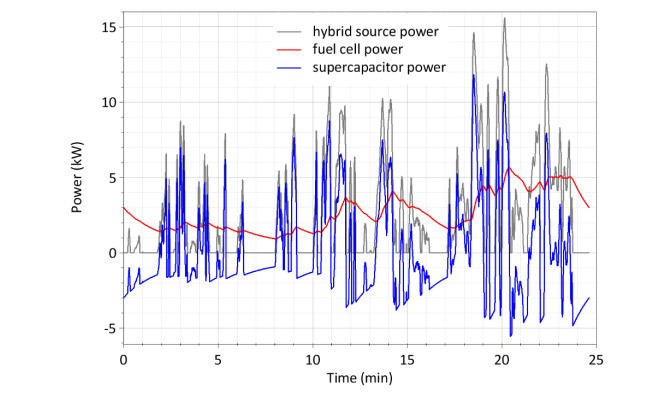
In view to proposing an alternative to oversized energy sources currently installed in electric vehicles for suburban transport, a direct hybrid fuel cell (FC)-supercapacitors (SC) source has been designed and tested on a test bench. The rated 15.6 kW source—with an air-cooled 5.6 kW FC and a 165 F SC storage device—was shown perfectly suited to traction of a 520 kg vehicle along the NEDC cycle, then validating the previously developed concept of a one-ton car propelled by a 10 kW FC in the rated 30 kW hybrid source for this cycle. In comparison with a FC used alone, hybridization was shown to allow the power demand for the cell to vary in quite a narrower range, as formerly observed. Moreover, the rates of fuel cell voltage and current generated in the driving cycle, were shown to be reduced by one order of magnitude by the direct hybridization which is to contribute to the FC durability. Two operating parameters were shown to have a significant effect on the hybrid source efficiency, namely the capacity of the SC at 110 or 165 F, and the recovery of deceleration power—emulated by an external power supply—which can decrease by 25% the fuel consumption in NEDC cycle conditions, as predicted by the model.

| [1] |
Fathabadi H (2018) Fuel cell hybrid electric vehicle (FCHEV): novel fuel cell/SC hybrid power generation system. Energy Convers Manage 156: 192-201. doi: 10.1016/j.enconman.2017.11.001

|
| [2] |
Sampietro JL, Puig V, Costa-Castelo R (2019) Optimal sizing of storage elements for a vehicle based on fuel cells, supercapacitors, and batteries. Energies 12: 925. doi: 10.3390/en12050925
|
| [3] | Lapicque F, Bonnet C, Huang BT, et al. (2012) Analysis and evaluation of aging phenomena in PEMFCs. In: K. Sundmacher, Advances in Chemical Engineering 41: 265-330. |
| [4] |
Zhang S, Yuan XZ, Hin JN, et al. (2019) A review of accelerated stress tests of MEA durability in PEM fuel cells. Int J Hydrogen Energy 34: 388-404. doi: 10.1016/j.ijhydene.2008.10.012
|
| [5] |
Carignano MG, Costa-Castello R, Roda V, et al. (2017) Energy Management strategy for fuel cell-capacitor hybrid vehicles based on prediction of energy demand. J Power Sources 360: 419-433. doi: 10.1016/j.jpowsour.2017.06.016
|
| [6] | Wu B, Parkes MA, Yufit W, et al. (2014) Design and testing of a 9.5 kW proton exchange membrane fuel cell-supercapacitor passive hybrid system. Int J Hydrogen Energy 39: 2885-2896. |
| [7] |
Yeersorn R, Maiket Y, Kaewmanee W (2020) The observation of supercapacitor effects on PEMFC-supercapacitor hybridization performance through voltage degradation and electrochemical processes. RSC Advances 10: 13100-13111. doi: 10.1039/D0RA00468E
|
| [8] |
Ahmadi S, Bathaee SMT, Hosseinpour AH (2018) Improving fuel economy and performance of a fuel-cell hybrid electric vehicle (fuel-cell, battery, and ultra-capacitor) using optimized energy management strategy. Energy Convers Manage 160: 74-84. doi: 10.1016/j.enconman.2018.01.020
|
| [9] |
Macias A, Kandidayeni M, Boulon L, et al. (2020) Passive and active coupling comparison of fuel cell and supercapacitor for a three-wheel electric vehicle. Fuel Cell 20: 351-361. doi: 10.1002/fuce.201900089
|
| [10] |
Jacome A, Depature C, Boulon L, et al. (2021) A benchamrk of different starting modes of a passive fuel cell/ultracapacitor hybrid source for an electric vehicle application. J Energy Storage 35: 102280. doi: 10.1016/j.est.2021.102280
|
| [11] |
Depature C, Macias A, Jacome A, et al. (2020) Fuel cell/supercapacitor passive configuration sizing approach for vehicular applications. Int J Hydrogen Energy 45: 26501-26512. doi: 10.1016/j.ijhydene.2020.05.040
|
| [12] |
Xun Q, Lundberg S, Liu Y (2021) Design and experimental verification of a fuel cell/supercapacitor passive configuration for a light vehicle. J Energy Storage 33: 102110. doi: 10.1016/j.est.2020.102110
|
| [13] | Tsotridis G, Pilenga A, de Marco G, et al. (2015) EU harmonised test protocols for PEMFC MEA testing in single cell configuration for automotive applications. In JRC Science for Policy report EUR 27632 EN. |
| [14] | Andre M, Keller M, Sjödin A, et al. (2008) The Artemis European tools for estimating the pollutant emissions from road transport and their application in Sweden and in France. Proceedings of the 17th Conference "Transport and Air Pollution", Graz 2008. |
| [15] | United State Environmental Protection Agency, EPA dynamometric drive schedules. Available from: https://www.epa.gov/vehicle-and-fuel-emissions-testing/dynamometer-drive-schedules. |
| [16] |
Hinaje M, Raël S, Caron JP, et al. (2012) An innovating application of PEM fuel cell: current source controlled by hydrogen supply. Int J Hydrogen Energy 37: 12481-12488. doi: 10.1016/j.ijhydene.2012.05.153
|
| [17] |
Silva RE, Harel F, Jemei S, et al. (2014) Proton exchange membrane fuel cell operation and degradation in short-circuit. Fuel Cell 14: 894-905. doi: 10.1002/fuce.201300216
|
| [18] |
Chandesris M, Vincent R, Guetaz L, et al. (2017) Membrane degradation in PEM fuel cells from experimental results to semi empirical degradation laws. Int J Hydrogen Energy 42: 139-149. doi: 10.1016/j.ijhydene.2017.02.116
|
| [19] |
Pei P, Chang Q, Tang T (2008) A quick evaluating method for automotive fuel cell lifetime. Int J Hydrogen Energy 33: 3829-3836. doi: 10.1016/j.ijhydene.2008.04.048
|
| [20] |
Gérardin K, Raël S, Bonnet C, et al. (2018) Direct coupling of PEM fuel cells to supercapacitors for higher durability and better energy management. Fuel Cell 18: 315-325. doi: 10.1002/fuce.201700041
|
| [21] |
Arora D, Bonnet C, Mukherjee M, et al. (2019) Direct hybridization of PEMFC and supercapacitors: Effect of excess hydrogen on a single cell fuel cell durability and its feasibility on fuel cell stack. Electrochim Acta 310: 213-220. doi: 10.1016/j.electacta.2019.04.073
|
| [22] |
Arora D, Bonnet C, Mukherjee M, et al. (2020) Long term study of directly hybridized proton exchange membrane fuel cell and supercapacitors for transport applications with lower hydrogen losses. J Energy Storage 23: 101205. doi: 10.1016/j.est.2020.101205
|
| [23] | Arora D, Hinaje M, Raël S, et al. (2018) Sizing supercapacitor for direct hybridization with polymer electrolyte membrane fuel cell. Proceedings of the IEEE-VPPC Conference, Chicago 2018. |
| [24] | Arora D (2019) Direct hybridization of a PEM fuel cell and a supercapacitor storage device: Comparative study of aging in urban cycling, and optimal management of hydrogen consumption PhD dissertation, University of Lorraine, France. |
| [25] |
Noiying P, Hinaje M, Thouthong P, et al. (2012) Using electrical analogy to describe mass and charge transport in PEM fuel cell. Renewable Energy 44: 128-140. doi: 10.1016/j.renene.2012.01.081
|
| [26] | Belhachemi F, Raël S, Davat B (2000) A physical based model power electrical double layer capacitors. Proceedings of the Conference Record of the 2000 IEEE Industrial Applications Systems, 3039-3076. |
| [27] |
Buller S, Karden E, Kok D, et al. (2002) Modeling the dynamic behavior of supercapacitors using impedance spectroscopy. IEEE Trans Ind Appl 38: 1622-1626. doi: 10.1109/TIA.2002.804762
|


Figures(15) / Tables(3)

Caroline Bonnet, Stéphane Raël, Melika Hinaje, Sophie Guichard, Théophile Habermacher, Julian Vernier, Xavier François, Marie-Cécile Péra, François Lapicque. Direct fuel cell—supercapacitor hybrid power source for personal suburban transport[J]. AIMS Energy, 2021, 9(6): 1274-1298. doi: 10.3934/energy.2021059


 DownLoad: