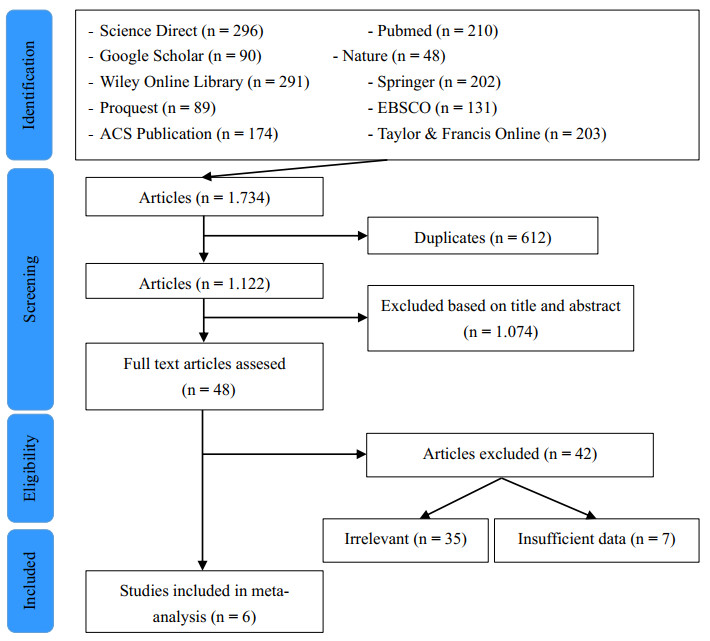
Edible films (EF) are continuously developed as food packaging alternatives due to their biodegradable properties. EF can be made from polysaccharides, proteins, lipids, and composite components. The use of raw materials certainly affects the properties of EF. Some studies reported that mammalian gelatin films were significantly different from fish gelatin films. However, there have been different results among individual studies. Therefore, the present study would like to obtain a valid conclusion across different studies using a meta-analysis approach. Study selection was performed with the PRISMA guideline. There were six relevant studies and 28 data used for meta-analysis. The statistical analysis was calculated by using Hedges*d. The results show that fish gelatin films had significantly lower (p < 0.05) tensile strength, elastic modulus, water vapor permeability, and transparency compared to mammalian gelatin films. Besides, there were two additional factors that are also discussed such as different film fabrication methods and gelatin concentration. Those seasonal factors were conducted by using subgroup analysis and meta-regression, respectively. The results described that the film production method, i.e., casting and compression molding significantly effect (p < 0.05) the tensile strength and elongation at break. Slightly different from the method, gelatin concentration was significantly affected (p < 0.05) the tensile strength, elongation at break, and water vapor permeability.
Citation: Nurafi Razna Suhaima, Nugraha Edhi Suyatma, Dase Hunaefi, Anuraga Jayanegara. Comparison of fish and mammalian gelatin film properties: A meta-analysis[J]. AIMS Agriculture and Food, 2022, 7(3): 461-480. doi: 10.3934/agrfood.2022029
Edible films (EF) are continuously developed as food packaging alternatives due to their biodegradable properties. EF can be made from polysaccharides, proteins, lipids, and composite components. The use of raw materials certainly affects the properties of EF. Some studies reported that mammalian gelatin films were significantly different from fish gelatin films. However, there have been different results among individual studies. Therefore, the present study would like to obtain a valid conclusion across different studies using a meta-analysis approach. Study selection was performed with the PRISMA guideline. There were six relevant studies and 28 data used for meta-analysis. The statistical analysis was calculated by using Hedges*d. The results show that fish gelatin films had significantly lower (p < 0.05) tensile strength, elastic modulus, water vapor permeability, and transparency compared to mammalian gelatin films. Besides, there were two additional factors that are also discussed such as different film fabrication methods and gelatin concentration. Those seasonal factors were conducted by using subgroup analysis and meta-regression, respectively. The results described that the film production method, i.e., casting and compression molding significantly effect (p < 0.05) the tensile strength and elongation at break. Slightly different from the method, gelatin concentration was significantly affected (p < 0.05) the tensile strength, elongation at break, and water vapor permeability.

| [1] |
Falguera V, Quintero JP, Jiménez A, et al. (2011) Edible films and coatings: Structures, active functions and trends in their use. Trends Food Sci Technol 22: 292-303. https://doi.org/10.1016/j.tifs.2011.02.004 doi: 10.1016/j.tifs.2011.02.004

|
| [2] |
Mohamed SAA, El-Sakhawy M, El-Sakhawy MAM (2020) Polysaccharides, protein and lipid-based natural edible films in food packaging: A review. Carbohydr Polym 238: 116178. https://doi.org/10.1016/j.carbpol.2020.116178 doi: 10.1016/j.carbpol.2020.116178
|
| [3] |
Hanani ZAN, Roos YH, Kerry JP (2014) Use and application of gelatin as potential biodegradable packaging materials for food products. Int J Biol Macromol 71: 94-102. https://doi.org/10.1016/j.ijbiomac.2014.04.027 doi: 10.1016/j.ijbiomac.2014.04.027
|
| [4] |
Nazmi NN, Isa MIN, Sarbon NM (2017) Preparation and characterization of chicken skin gelatin/CMC composite film as compared to bovine gelatin film. Food Biosci 19: 149-155. https://doi.org/10.1016/j.fbio.2017.07.002 doi: 10.1016/j.fbio.2017.07.002
|
| [5] |
Wang LZ, Liu L, Holmes J, et al. (2007) Assessment of film-forming potential and properties of protein and polysaccharide-based biopolymer films. Int J Food Sci Technol 42: 1128-1138. https://doi.org/10.1111/j.1365-2621.2006.01440.x doi: 10.1111/j.1365-2621.2006.01440.x
|
| [6] |
Ramos M, Valdés A, Beltrán A, et al. (2016) Gelatin-based films and coatings for food packaging applications. Coatings 6: 41. https://doi.org/10.3390/coatings6040041 doi: 10.3390/coatings6040041
|
| [7] |
Lv LC, Huang QY, Ding W, et al. (2019) Fish gelatin: The novel potential applications. J Funct Foods 63: 103581. https://doi.org/10.1016/j.jff.2019.103581 doi: 10.1016/j.jff.2019.103581
|
| [8] |
Nitsuwat S, Zhang P, Ng K, et al. (2021) Fish gelatin as an alternative to mammalian gelatin for food industry : A meta-analysis. LWT 141: 110899. https://doi.org/10.1016/j.lwt.2021.110899 doi: 10.1016/j.lwt.2021.110899
|
| [9] |
Karim AA, Bhat R (2009) Fish gelatin: properties, challenges, and prospects as an alternative to mammalian gelatins. Food Hydrocoll 23: 563-576. https://doi.org/10.1016/j.foodhyd.2008.07.002 doi: 10.1016/j.foodhyd.2008.07.002
|
| [10] | Mariod AA, Adam HF (2013) Review: gelatin, source, extraction, and industrial applications. Acta Sci Pol Technol Aliment 12: 135-147. |
| [11] |
Le T, Maki H, Okazaki E, et al. (2018) Influence of Various Phenolic Compounds on Properties of Gelatin Film Prepared from Horse Mackerel Trachurus japonicus Scales. J Food Sci 83: 1888-1895. https://doi.org/10.1111/1750-3841.14193 doi: 10.1111/1750-3841.14193
|
| [12] |
Ninan G, Joseph J, Abubacker Z (2010) Physical, mechanical, and barrier properties of carp and mammalian skin gelatin films. J Food Sci 75: 620-626. https://doi.org/10.1111/j.1750-3841.2010.01851.x doi: 10.1111/j.1750-3841.2010.01851.x
|
| [13] |
Kaewprachu P, Osako K, Benjakul S, et al. (2016) Biodegradable protein-based films and their properties: A comparative study. Packag Technol Sci 29: 77-90. https://doi.org/10.1002/pts.2183 doi: 10.1002/pts.2183
|
| [14] |
Chuaynukul K, Nagarajan M, Prodpran T, et al. (2017) Comparative characterization of bovine and fish gelatin films fabricated by compression molding and solution casting methods. J Polym Environ 26: 1239-1252. https://doi.org/10.1007/s10924-017-1030-5 doi: 10.1007/s10924-017-1030-5
|
| [15] |
Tawfik GM, Dila KAS, Mohamed MYF, et al. (2019) A step by step guide for conducting a systematic review and meta-analysis with simulation data. Trop Med Health 47: 46. https://doi.org/10.1186/s41182-019-0165-6 doi: 10.1186/s41182-019-0165-6
|
| [16] |
Palupi E, Jayanegara A, Ploeger A, et al. (2012) Comparison of nutritional quality between conventional and organic dairy products: A meta-analysis. J Sci Food Agric 92: 2774-2781. https://doi.org/10.1002/jsfa.5639 doi: 10.1002/jsfa.5639
|
| [17] |
Afandi FA, Wijaya CH, Faridah DN, et al. (2021) Evaluation of various starchy foods: A systematic review and meta-analysis on chemical properties affecting the glycemic index values based on in vitro and in vivo experiments. Foods 10: 364. https://doi.org/10.3390/foods10020364 doi: 10.3390/foods10020364
|
| [18] |
Methley AM, Campbell S, Chew-Graham C, et al. (2014) PICO, PICOS and SPIDER: A comparison study of specificity and sensitivity in three search tools for qualitative systematic reviews. BMC Health Serv Res 14: 579. https://doi.org/10.1186/s12913-014-0579-0 doi: 10.1186/s12913-014-0579-0
|
| [19] | Koricheva J, Gurevitch J, Mengersen K (2013) Handbook of Meta-Analysis in Ecology and Evolution. https://doi.org/10.1515/9781400846184 |
| [20] |
Mikolajewicz N, Komarova SV (2019) Meta-analytic methodology for basic research: A practical guide. Front Physiol 10: 203. https://doi.org/10.3389/fphys.2019.00203 doi: 10.3389/fphys.2019.00203
|
| [21] |
Gurevitch J, Koricheva J, Nakagawa S, et al. (2018) Meta-analysis and the science of research synthesis. Nature 555: 175-182. https://doi.org/10.1038/nature25753 doi: 10.1038/nature25753
|
| [22] | Hedges L, Olkin I (1985) Meta-analysis from a small sample. Stat methods meta-analysis 32. |
| [23] |
Suurmond R, van Rhee H, Hak T (2017) Introduction, comparison, and validation of Meta-Essentials: A free and simple tool for meta-analysis. Res Synth Methods 8: 537-553. https://doi.org/10.1002/jrsm.1260 doi: 10.1002/jrsm.1260
|
| [24] |
Egger M, Smith GD, Schneider M, et al. (1997) Bias in meta-analysis detected by a simple, graphical test. Br Med J 315: 629-634. https://doi.org/10.1136/bmj.315.7109.629 doi: 10.1136/bmj.315.7109.629
|
| [25] |
Muyonga JH, Cole CGB, Duodu KG (2004) Extraction and physico-chemical characterisation of Nile perch (Lates niloticus) skin and bone gelatin. Food Hydrocoll 18: 581-592. https://doi.org/10.1016/j.foodhyd.2003.08.009 doi: 10.1016/j.foodhyd.2003.08.009
|
| [26] |
Shoulders MD, Raines RT (2009) Collagen structure and stability. Annu Rev Biochem 78: 929-958. https://doi.org/10.1146/annurev.biochem.77.032207.120833 doi: 10.1146/annurev.biochem.77.032207.120833
|
| [27] |
Gómez-Estaca J, Montero P, Fernández-Martín F, et al. (2009) Physico-chemical and film-forming properties of bovine-hide and tuna-skin gelatin: A comparative study. J Food Eng 90: 480-486. https://doi.org/10.1016/j.jfoodeng.2008.07.022 doi: 10.1016/j.jfoodeng.2008.07.022
|
| [28] |
Said M, Triatmojo S, Erwanto Y, et al. (2013) Evaluation of physical characteristics of edible film from Bligon goat skin gelatin using glycerol as plasticizer. J Ilmu dan Teknol Has Ternak 8: 32-36. https://doi.org/10.21776/ub.jitek.2013.008.02.5 doi: 10.21776/ub.jitek.2013.008.02.5
|
| [29] |
Hanani ZAN, Roos YH, Kerry JP (2012) Use of beef, pork and fish gelatin sources in the manufacture of films and assessment of their composition and mechanical properties. Food Hydrocoll 29: 144-151. https://doi.org/10.1016/j.foodhyd.2012.01.015 doi: 10.1016/j.foodhyd.2012.01.015
|
| [30] |
Aguirre-Alvarez G, Pimentel-González DJ, Campos-Montiel RG, et al. (2011) The effect of drying temperature on mechanical properties of pig skin gelatin films. CYTA-J Food 9: 243-249. https://doi.org/10.1080/19476337.2010.523902 doi: 10.1080/19476337.2010.523902
|
| [31] |
Bigi A, Panzavolta S, Rubini K (2004) Relationship between triple-helix content and mechanical properties of gelatin films. Biomaterials 25: 5675-5680. https://doi.org/10.1016/j.biomaterials.2004.01.033 doi: 10.1016/j.biomaterials.2004.01.033
|
| [32] |
Avena-Bustillos RJ, Chiou B, Olsen CW, et al. (2011) Gelation, Oxygen Permeability, and Mechanical Properties of Mammalian and Fish Gelatin Films. J Food Sci 76: 519-524. https://doi.org/10.1111/j.1750-3841.2011.02312.x doi: 10.1111/j.1750-3841.2011.02312.x
|
| [33] |
Wulandari Y, Harini N, Warkoyo (2019) Characterization of Edible Film from Starch of Taro (Colocasia esculenta (L.) Schott) with Addition of Chitosan on Dodol Substituted Seaweed (Eucheuma cottonii L.). Food Technol Halal Sci J 1: 22-32. https://doi.org/10.22219/fths.v1i1.7544 doi: 10.22219/fths.v1i1.7544
|
| [34] |
Rahmiatiningrum N, Sukardi S, Warkoyo W (2019) Study of Physical Characteristic, Water Vapor Transmission Rate and Inhibition Zones of Edible Films from Aloe vera (Aloe barbadensis) Incorporated with Yellow Sweet Potato Starch and Glycerol. Food Technol Halal Sci J 2: 195. https://doi.org/10.22219/fths.v2i2.12985 doi: 10.22219/fths.v2i2.12985
|
| [35] |
Costa MJ, Maciel LC, Teixeira JA, et al. (2018) Use of edible films and coatings in cheese preservation: Opportunities and challenges. Food Res Int 107: 84-92. https://doi.org/10.1016/j.foodres.2018.02.013 doi: 10.1016/j.foodres.2018.02.013
|
| [36] |
Park JW, Scott Whiteside W, Cho SY (2008) Mechanical and water vapor barrier properties of extruded and heat-pressed gelatin films. LWT - Food Sci Technol 41: 692-700. https://doi.org/10.1016/j.lwt.2007.04.015 doi: 10.1016/j.lwt.2007.04.015
|
| [37] |
Krishna M, Nindo CI, Min SC (2012) Development of fish gelatin edible films using extrusion and compression molding. J Food Eng 108: 337-344. https://doi.org/10.1016/j.jfoodeng.2011.08.002 doi: 10.1016/j.jfoodeng.2011.08.002
|
| [38] | Chuaynukul K, Nagarajan M, Prodpran T, et al. (2017) Impacts of plasticizer and pre-heating conditions on properties of bovine and fish gelatin films fabricated by thermo-compression molding technique. Ital J Food Sci 29: 487-504. |
| [39] |
Cunningham P, Ogale AA, Dawson PL, et al. (2000) Tensile properties of soy protein isolate films produced by a thermal compaction technique. J Food Sci 65: 668-671. https://doi.org/10.1111/j.1365-2621.2000.tb16070.x doi: 10.1111/j.1365-2621.2000.tb16070.x
|
| [40] |
Anzures-cabrera J, Higgins JPT (2010) Graphical displays for meta-analysis : An overview with suggestions for practice. Res Syn Meth 1: 66-80. https://doi.org/10.1002/jrsm.6 doi: 10.1002/jrsm.6
|


Figures(6) / Tables(2)

Nurafi Razna Suhaima, Nugraha Edhi Suyatma, Dase Hunaefi, Anuraga Jayanegara. Comparison of fish and mammalian gelatin film properties: A meta-analysis[J]. AIMS Agriculture and Food, 2022, 7(3): 461-480. doi: 10.3934/agrfood.2022029


 DownLoad: