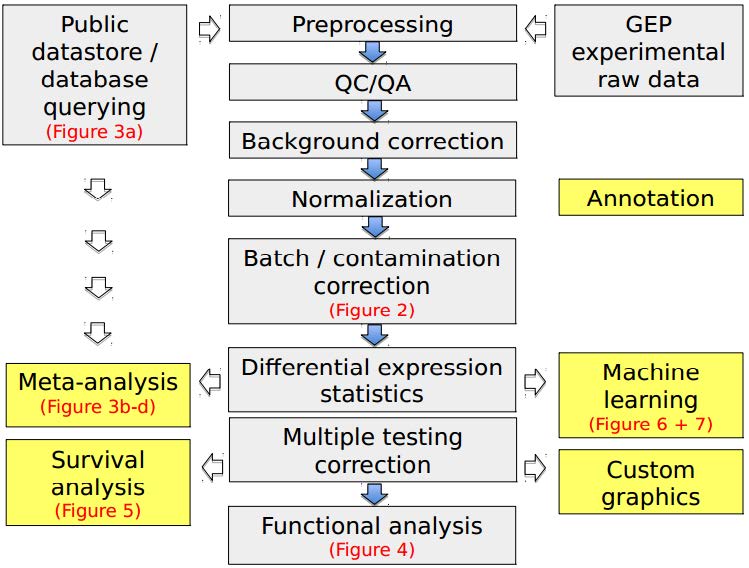
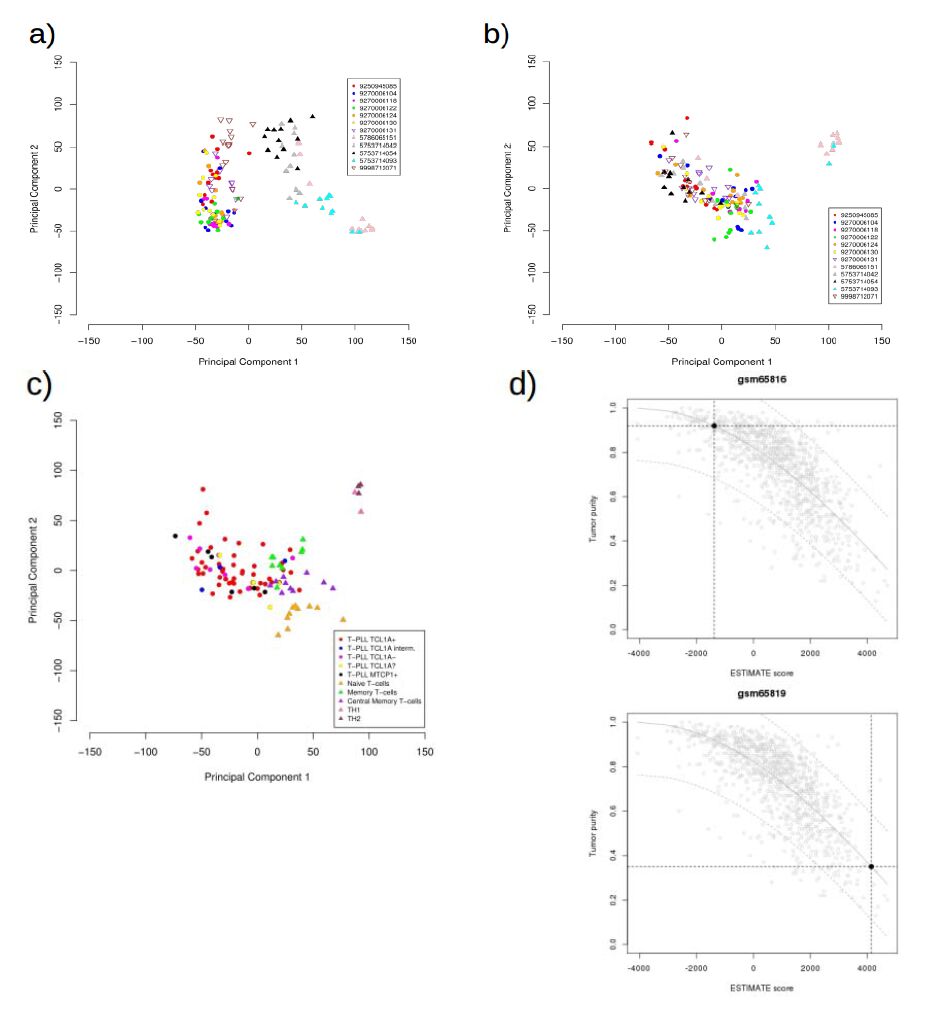
In cancer research, transcriptional aberrations are often deduced from mRNA-based gene expression profiling (GEP). Although transcriptome sequencing (RNA-seq) has gained ground in the recent past, mRNA-based microarrays remain a useful asset for high-throughput experiments in many laboratories. Possible reasons are the lower per-sample costs and the opportunity to analyze obtained GEP data in association with published data sets. There are established and widely used methods for the analysis of microarray data, which increase the comparability of different GEP data sets and facilitate data-mining approaches. However, analytic pitfalls, such as batch effects and issues of sample purity, e.g. by complex tissue composition, are often not properly addressed by these standard approaches. Moreover, most of these tools do not capitalize on the full range of public data sources or do not take advantage of the analytic possibilities for functional interpretation or of comprehensive meta-analyses. We present an overview of the most critical steps in the analysis of microarray-based GEP data. We discuss software and database query solutions that may be useful foreach step and for generally overcoming analytic challenges. Aside from machine-learning applications to classify and cluster samples, we describe clinical applications of GEP, including a novel exploratory algorithm to identify potential biomarkers of prognosis in small sample cohorts as demonstrated by exemplary data from lymphatic leukemias. Overall, this review and the attached source code provide guidance to both molecular biologists and bioinformaticians / biostatisticians to properly conduct GEP analyses as well as to evaluate the clinical / biological relevance of obtained results.
Citation: Giuliano Crispatzu, Alexandra Schrader, Michael Nothnagel, Marco Herling, Carmen Diana Herling. A Critical Evaluation of Analytic Aspects of Gene Expression Profiling in Lymphoid Leukemias with Broad Applications to Cancer Genomics[J]. AIMS Medical Science, 2016, 3(3): 248-271. doi: 10.3934/medsci.2016.3.248
In cancer research, transcriptional aberrations are often deduced from mRNA-based gene expression profiling (GEP). Although transcriptome sequencing (RNA-seq) has gained ground in the recent past, mRNA-based microarrays remain a useful asset for high-throughput experiments in many laboratories. Possible reasons are the lower per-sample costs and the opportunity to analyze obtained GEP data in association with published data sets. There are established and widely used methods for the analysis of microarray data, which increase the comparability of different GEP data sets and facilitate data-mining approaches. However, analytic pitfalls, such as batch effects and issues of sample purity, e.g. by complex tissue composition, are often not properly addressed by these standard approaches. Moreover, most of these tools do not capitalize on the full range of public data sources or do not take advantage of the analytic possibilities for functional interpretation or of comprehensive meta-analyses. We present an overview of the most critical steps in the analysis of microarray-based GEP data. We discuss software and database query solutions that may be useful foreach step and for generally overcoming analytic challenges. Aside from machine-learning applications to classify and cluster samples, we describe clinical applications of GEP, including a novel exploratory algorithm to identify potential biomarkers of prognosis in small sample cohorts as demonstrated by exemplary data from lymphatic leukemias. Overall, this review and the attached source code provide guidance to both molecular biologists and bioinformaticians / biostatisticians to properly conduct GEP analyses as well as to evaluate the clinical / biological relevance of obtained results.

| [1] |
International Human Genome Mapping Consortium. A physical map of the human genome. (2001) Nature 409: 934-941. doi: 10.1038/35057157

|
| [2] |
International Human Genome Sequencing Consortium. Finishing the euchromatic sequence of the human genome. (2004) Nature 431: 931-945. doi: 10.1038/nature03001
|
| [3] |
Ferreira PG, Jares P, Rico D, et al. (2014) Transcriptome characterization by RNA sequencing identifies a major molecular and clinical subdivision in chronic lymphocytic leukemia. Genome Res 24: 212-226. doi: 10.1101/gr.152132.112
|
| [4] | Ojesina AI, Lichtenstein L, Freeman SS, et al. (2014) Landscape of genomic alterations in cervical carcinomas. Nature 506: 371-375. |
| [5] | Cancer Genome Atlas Research Network (2014) Comprehensive molecular characterization of urothelial bladder carcinoma. Nature 507:315-322. |
| [6] |
Wang C, McKeithan TW, Gong Q, et al. (2015) IDH2R172 mutations define a unique subgroup of patients with angioimmunoblastic T-cell lymphoma. Blood 126: 1741-1752. doi: 10.1182/blood-2015-05-644591
|
| [7] | R Core Team (2016) R: A language and environment for statistical computing. R Foundation for Statistical Computing, Vienna, Austria. URL: http://www.R-project.org/. |
| [8] |
Gentleman RC, Carey VJ, Bates DM, et al. (2004) Bioconductor: open software development for computational biology and bioinformatics. Genome Biol 5: R80. URL: http://www.bioconductor.org/. doi: 10.1186/gb-2004-5-10-r80
|
| [9] |
Irizarry RA, Bolstad BM, Collin F, et al. (2003) Summaries of Affymetrix GeneChip probe level data. Nucleic Acids Res 31: e15. doi: 10.1093/nar/gng015
|
| [10] |
Yang YH, Dudoit S, Luu P, et al. (2002) Normalization for cDNA microarray data: a robust composite method addressing single and multiple slide systematic variation. Nucleic Acids Res 30: e15. doi: 10.1093/nar/30.4.e15
|
| [11] |
Huber W, von Heydebreck A, Sueltmann H, et al. (2002) Variance Stabilization Applied to Microarray Data Calibration and to the Quantification of Differential Expression. Bioinformatics 18: S96-S104. doi: 10.1093/bioinformatics/18.suppl_1.S96
|
| [12] |
Durinck S, Moreau Y, Kasprzyk A, et al. (2005) BioMart and Bioconductor: a powerful link between biological databases and microarray data analysis. Bioinformatics 21: 3439-3440. doi: 10.1093/bioinformatics/bti525
|
| [13] |
Bae J, Leo CP, Hsu SY, et al. (2000) MCL-1S, a splicing variant of the antiapoptotic BCL-2 family member MCL-1, encode s a proapoptotic protein possessing only the BH3 domain. J Biol Chem 275: 25255-25261. doi: 10.1074/jbc.M909826199
|
| [14] |
Noble WS (2009) How does multiple testing correction work? Nat Biotechnol 27: 1135-1137. doi: 10.1038/nbt1209-1135
|
| [15] |
Dudoit S, Shaffer JP, Boldrick JC (2003) Multiple hypothesis testing in microarray experiments. Statistical Sci 18: 71. doi: 10.1214/ss/1056397487
|
| [16] | Pollard KS, Dudoit S, van der Laan MJ (2005) Multiple Testing Procedures: R multtest Package and Applications to Genomics, in Bioinformatics and Computational Biology Solutions Using R and Bioconductor. Springer. |
| [17] |
Kitchen RR, Sabine VS, Sims AH, et al. (2010) Correcting for intra-experiment variation in Illumina BeadChip data is necessary to generate robust gene-expression profiles. BMC Genomics 11: 134. doi: 10.1186/1471-2164-11-134
|
| [18] | Johnson WE, Li C, Rabinovic A (2007) Adjusting batch effects in microarray expression data using empirical Bayes methods. Biostatistics 8: 118-127. |
| [19] | Yoshihara K, Shahmoradgoli M, Martínez E, et al. (2013) Inferring tumour purity and stromal and immune cell admixture from expression data. Nat Commun 4: 2612. |
| [20] |
Gaujoux R, Seoighe C (2013) CellMix: a comprehensive toolbox for gene expression deconvolution. Bioinformatics 29: 2211-2212. doi: 10.1093/bioinformatics/btt351
|
| [21] |
Barrett T, Wilhite SE, Ledoux P, et al. (2013) NCBI GEO: archive for functional genomics data sets—update. Nucleic Acids Res 41: D991-995. doi: 10.1093/nar/gks1193
|
| [22] | Kolesnikov N, Hastings E, Keays M, et al. (2015) ArrayExpress update—simplifying data submissions. Nucleic Acids Res 43: D1113-1116. |
| [23] |
Petryszak R, Keays M, Tang YA, et al. (2016) Expression Atlas update--an integrated database of gene and protein expression in humans, animals and plants. Nucleic Acids Res 44: D746-752. doi: 10.1093/nar/gkv1045
|
| [24] |
Malone J, Holloway E, Adamusiak T, et al. (2010) Modeling sample variables with an Experimental Factor Ontology. Bioinformatics 26: 1112-1118. doi: 10.1093/bioinformatics/btq099
|
| [25] |
Taminau J, Meganck S, Lazar C, et al. (2012) Unlocking the potential of publicly available microarray data using inSilicoDb and inSilicoMerging R/Bioconductor packages. BMC Bioinformatics 13: 335. doi: 10.1186/1471-2105-13-335
|
| [26] | Dennis Jr G, Sherman BT, Hosack DA, et al. (2003) DAVID: Database for Annotation, Visualization, and Integrated Discovery. Genome Biology 4: P3. |
| [27] | Kamburov A, Stelzl U, Lehrach H, et al. (2013) The ConsensusPathDB interaction database: 2013 update. Nucleic Acids Res 41; D793-800. |
| [28] |
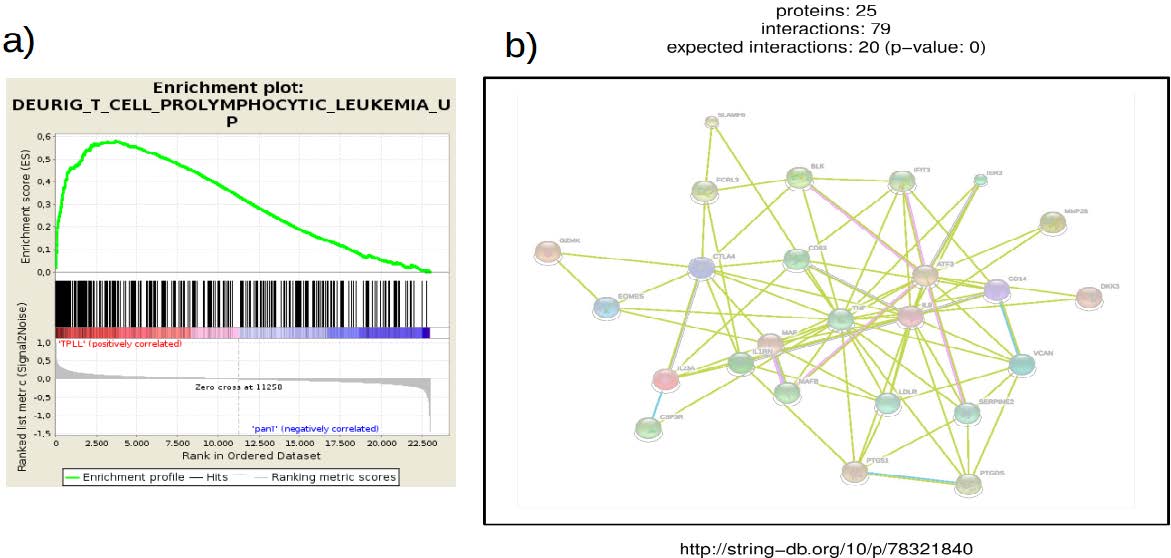
Subramanian A, Tamayo P, Mootha VK, et al. (2005). Gene set enrichment analysis: a knowledge-based approach for interpreting genome-wide expression profiles. Proc Natl Acad Sci U. S. A. 102: 15545-15550. doi: 10.1073/pnas.0506580102
|
| [29] |
Szklarczyk D, Franceschini A, Wyder S, et al. (2015) STRING v10: protein-protein interaction networks, integrated over the tree of life. Nucleic Acids Res 43: D447-452. doi: 10.1093/nar/gku1003
|
| [30] |
Gentile M, Cutrona G, Neri A, et al. (2009) Predictive value of beta2-microglobulin (beta2-m) levels in chronic lymphocytic leukemia since Binet A stages. Haematologica 94: 887-888. doi: 10.3324/haematol.2009.005561
|
| [31] |
Wiestner A, Rosenwald A, Barry TS, et al. (2003) ZAP-70 expression identifies a chronic lymphocytic leukemia subtype with unmutated immunoglobulin genes, inferior clinical outcome, and distinct gene expression profile. Blood 101: 4944-4951. doi: 10.1182/blood-2002-10-3306
|
| [32] |
Clark TG, Bradburn MJ, Love SB, et al. (2003) Survival analysis part I: basic concepts and first analyses. Br J Cancer 89:232-238. doi: 10.1038/sj.bjc.6601118
|
| [33] |
Bradburn MJ, Clark TG, Love SB, et al. (2003) Survival analysis part II: multivariate data analysis--an introduction to concepts and methods. Br J Cancer 89: 431-436. doi: 10.1038/sj.bjc.6601119
|
| [34] | Peto R, Pike MC, Armitage P, et al. (1977) Design and analysis of randomized clinical trials requiring prolonged observation of each patient. II. Analysis and examples. Br J Cancer 35: 1-39 |
| [35] |
Kaplan EL, MeierP (1958) Nonparametric estimation from incomplete observations. J Am Stat Assoc 53: 457-481 doi: 10.1080/01621459.1958.10501452
|
| [36] | Cox DR. (1972) Regression models and life tables (with discussion). JR Statist Soc B: 34187-34220. |
| [37] |
Tusher VG, Tibshirani R, Chu G (2001) Significance analysis of microarrays applied to the ionizing radiation response. Proc Natl Acad Sci U S A 98: 5116-5121. doi: 10.1073/pnas.091062498
|
| [38] |
Chen K (2001) Generalized case-cohort sampling. Statistical Methodol 63: 791-809. doi: 10.1111/1467-9868.00313
|
| [39] | Tukey JW (1977) Exploratory Data Analysis. Addison-Wesley. |
| [40] | Vapnik VN (1995) The Nature of Statistical Learning Theory. Berlin: Springer |
| [41] | Breiman L, Friedman J, Stone CJ, et al. (1984) Classification and Regression Trees. Chapman and Hall/CRC. |
| [42] | Ho TK (1995) Random Decision Forests Proceedings of the 3rd International Conference on Document Analysis and Recognition, Montreal, QC, 14–16 August pp. 278-282. |
| [43] | Hahne F, Huber W, Gentleman R, et al. (2008) Bioconductor Case Studies. Springer Press. |
| [44] | Gao J, Aksoy BA, Dogrusoz U, et al. (2013) Integrative analysis of complex cancer genomics and clinical profiles using the cBioPortal. Sci Signal 6: l1. |
| [45] |
Ulitsky I, Maron-Katz A, Shavit S, et al. (2010) Expander: from expression microarrays to networks and functions. Nature Protocols 5: 303-322. doi: 10.1038/nprot.2009.230
|
| [46] | Hopfinger G, Busch R, Pflug N, et al. (2013) Sequential chemoimmunotherapy of fludarabine, mitoxantrone, and cyclophosphamide induction followed by alemtuzumab consolidation is effective in T-cell prolymphocytic leukemia. Cancer 119: 2258–2267. |
| [47] |
Keating MJ, O'Brien S, Albitar M, et al. (2005) Early results of a chemoimmunotherapy regimen of fludarabine, cyclophosphamide, and rituximab as initial therapy for chronic lymphocytic leukemia. J Clin Oncol 23: 4079-4088. doi: 10.1200/JCO.2005.12.051
|
| [48] |
Sotiriou C, Wirapati P, Loi S, et al. (2006) Gene expression profiling in breast cancer: understanding the molecular basis of histologic grade to improve prognosis. J Natl Cancer Inst 98: 262-272. doi: 10.1093/jnci/djj052
|
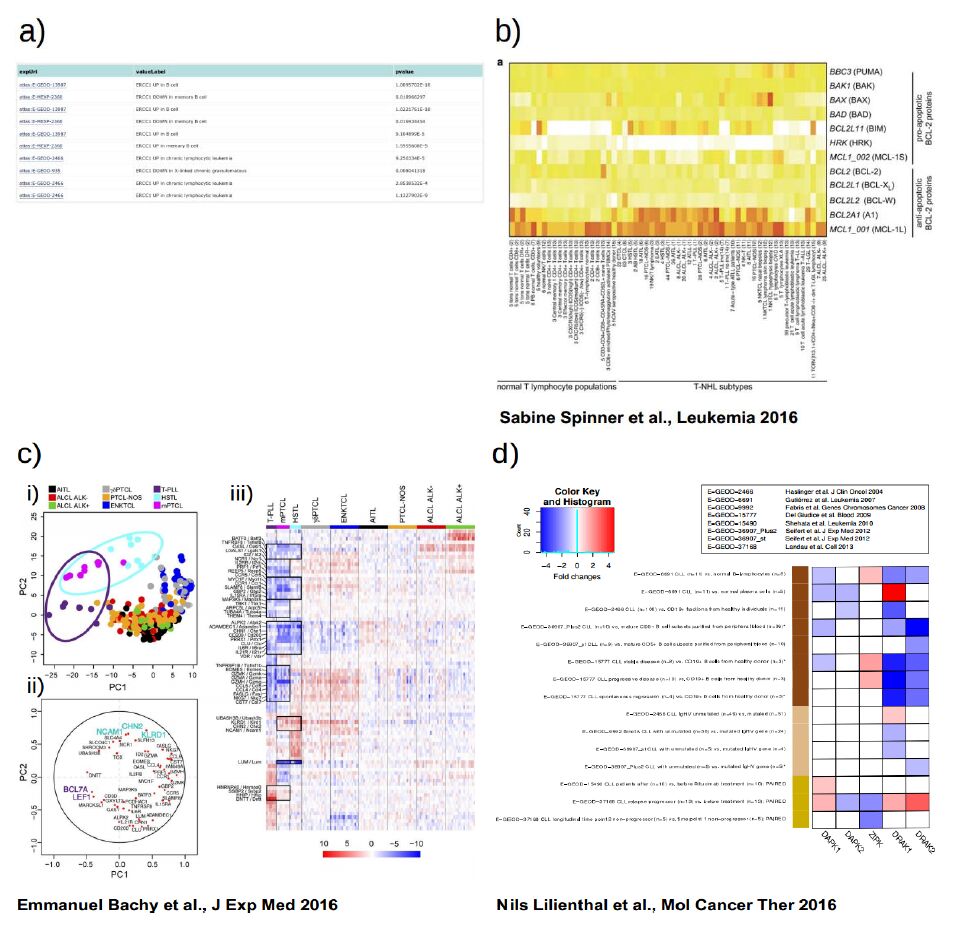
| [49] | Spinner S, Crispatzu G, Yi JH, et al. (2016) Re-activation of mitochondrial apoptosis inhibits T-cell lymphoma survival and treatment resistance. Leukemia. Mar 8. |
| [50] |
Bachy E, Urb M, Chandra S, et al. (2016) CD1d-restricted peripheral T cell lymphoma in mice and humans. J Exp Med 213: 841-857. doi: 10.1084/jem.20150794
|
| [51] | Lilienthal N, Lohmann G, Crispatzu G, et al. (2016) A Novel Recombinant Anti-CD22 Immunokinase Delivers Proapoptotic Activity of Death-Associated Protein Kinase (DAPK) and Mediates Cytotoxicity in Neoplastic B Cells. Mol Cancer Ther 29. |
| [52] |
Dürig J, Bug S, Klein-Hitpass L, et al. (2007) Combined single nucleotide polymorphism-based genomic mapping and global gene expression profiling identifies novel chromosomal imbalances, mechanisms and candidate genes important in the pathogenesis of T-cell prolymphocytic leukemia with inv(14)(q11q32). Leukemia 21: 2153-2163. doi: 10.1038/sj.leu.2404877
|
Figures(7)

Giuliano Crispatzu, Alexandra Schrader, Michael Nothnagel, Marco Herling, Carmen Diana Herling. A Critical Evaluation of Analytic Aspects of Gene Expression Profiling in Lymphoid Leukemias with Broad Applications to Cancer Genomics[J]. AIMS Medical Science, 2016, 3(3): 248-271. doi: 10.3934/medsci.2016.3.248


 DownLoad: