Loading [Contrib]/a11y/accessibility-menu.js
Research article Special Issues

Basin-wide groundwater vulnerability assessment: a GIS based DRASTIC approach to the problem of coal seam gas extracted water

  • Received: 04 October 2016 Accepted: 08 February 2017 Published: 17 February 2017
  • Coal seam gas (CSG) production requires the extraction of large volumes of water. Discharges of the extracted water into the environment occur via authorised temporary permits or through accidental releases. The purpose of this study is to assess the risk to shallow groundwater aquifers from potential CSG water releases in Queensland, Australia. A GIS based methodology was used to identify vulnerable shallow aquifers by overlaying a series of risk factors, which increase the likelihood of flow from the ground surface into aquifers below. We identified where the vulnerable aquifers are located and estimate that about 10,000 people live in these areas. The GIS based exposure mapping approach applied here provides a useful ‘first-pass’ assessment of areas with CSG activity. Areas identified as potentially high risk should be prioritised for further detailed investigation.

    Citation: Maryam Navi, Shahram Nasiri, Chris Skelly. Basin-wide groundwater vulnerability assessment: a GIS based DRASTIC approach to the problem of coal seam gas extracted water[J]. AIMS Environmental Science, 2017, 4(1): 168-186. doi: 10.3934/environsci.2017.1.168

    Related Papers:

    [1] Vakhtang V. Dzhavakhiya, Elena V. Glagoleva, Veronika V. Savelyeva, Natalia V. Statsyuk, Maksim I. Kartashov, Tatiana M. Voinova, Alla V. Sergeeva . New bacitracin-resistant nisin-producing strain of Lactococcus lactis and its physiological characterization. AIMS Microbiology, 2018, 4(4): 608-621. doi: 10.3934/microbiol.2018.4.608
    [2] John Samelis, Athanasia Kakouri . Hurdle factors minimizing growth of Listeria monocytogenes while counteracting in situ antilisterial effects of a novel nisin A-producing Lactococcus lactis subsp. cremoris costarter in thermized cheese milks. AIMS Microbiology, 2018, 4(1): 19-41. doi: 10.3934/microbiol.2018.1.19
    [3] Natalia Y. Kovalskaya, Eleanor E. Herndon, Juli A. Foster-Frey, David M. Donovan, Rosemarie W. Hammond . Antimicrobial activity of bacteriophage derived triple fusion protein against Staphylococcus aureus. AIMS Microbiology, 2019, 5(2): 158-175. doi: 10.3934/microbiol.2019.2.158
    [4] Prateebha Ramroop, Hudaa Neetoo . Antilisterial activity of Cymbopogon citratus on crabsticks. AIMS Microbiology, 2018, 4(1): 67-84. doi: 10.3934/microbiol.2018.1.67
    [5] Joseph O. Falkinham . Mycobacterium avium complex: Adherence as a way of life. AIMS Microbiology, 2018, 4(3): 428-438. doi: 10.3934/microbiol.2018.3.428
    [6] Farzad Rahmati . Characterization of Lactobacillus, Bacillus and Saccharomyces isolated from Iranian traditional dairy products for potential sources of starter cultures. AIMS Microbiology, 2017, 3(4): 815-825. doi: 10.3934/microbiol.2017.4.815
    [7] Yusuke Morita, Mai Okumura, Issay Narumi, Hiromi Nishida . Sensitivity of Deinococcus grandis rodZ deletion mutant to calcium ions results in enhanced spheroplast size. AIMS Microbiology, 2019, 5(2): 176-185. doi: 10.3934/microbiol.2019.2.176
    [8] Alexandra Díez-Méndez, Raul Rivas . Improvement of saffron production using Curtobacterium herbarum as a bioinoculant under greenhouse conditions. AIMS Microbiology, 2017, 3(3): 354-364. doi: 10.3934/microbiol.2017.3.354
    [9] Stephen H. Kasper, Ryan Hart, Magnus Bergkvist, Rabi A. Musah, Nathaniel C. Cady . Zein nanocapsules as a tool for surface passivation, drug delivery and biofilm prevention. AIMS Microbiology, 2016, 2(4): 422-433. doi: 10.3934/microbiol.2016.4.422
    [10] Yunfeng Xu, Attila Nagy, Gary R. Bauchan, Xiaodong Xia, Xiangwu Nou . Enhanced biofilm formation in dual-species culture of Listeria monocytogenes and Ralstonia insidiosa. AIMS Microbiology, 2017, 3(4): 774-783. doi: 10.3934/microbiol.2017.4.774
  • Coal seam gas (CSG) production requires the extraction of large volumes of water. Discharges of the extracted water into the environment occur via authorised temporary permits or through accidental releases. The purpose of this study is to assess the risk to shallow groundwater aquifers from potential CSG water releases in Queensland, Australia. A GIS based methodology was used to identify vulnerable shallow aquifers by overlaying a series of risk factors, which increase the likelihood of flow from the ground surface into aquifers below. We identified where the vulnerable aquifers are located and estimate that about 10,000 people live in these areas. The GIS based exposure mapping approach applied here provides a useful ‘first-pass’ assessment of areas with CSG activity. Areas identified as potentially high risk should be prioritised for further detailed investigation.


    1. Introduction

    Alicyclobacillus acidoterrestris is a thermoacidophilic, non-pathogenic, rod-shaped, spore-forming bacterium. It has the ability to grow in a wide temperature (25–60 ℃) and pH (2.5–6.0) ranges [1]. ω-alicyclic fatty acids are the major lipid components and provide its resistance to acidic conditions and high temperatures [2]. After fruit juice pasteurization, its spores can germinate into vegetative cells leading to spoilage [3]. Spoilage is difficult to detect visually [4] and has been detected in various pasteurized juice samples such as apple, tomato, white grape, grapefruit, orange, and pineapple juices but not in red grape juices and Cupuaçu [1].

    The use of natural antimicrobials in foods inhibits the growth of many microorganisms without health risks to consumers [5]. In the food industry, it is important to determine the effects of non-thermal technologies on microbial inactivation and the growth parameters of the survivors such as the lag phase (λ) and the maximum specific growth rate (μ) [6]. Nisin is a heat stable bacteriocin produced by Lactococcus lactis sub sp. lactis. It shows antibacterial activity against Gram-positive bacteria and spore formers such as Bacillus and Clostridium spp. This antibacterial agent is essentially non-toxic to humans and degraded without causing any damage to the intestinal tract. In the United States, it was approved by the Food and Drug Administration (FDA) and allowed to be used in processed cheeses [7]. In the food industry, it has been used as a natural preservative in processed cheese, milk, dairy products, canned foods, hot baked flour products and pasteurized liquid egg [8]. On the other hand, its use is limited to 15 ppm in meat products by the FDA [9]. Nisin could be added directly to the juices [10,11,12] or incorporated in polymers for controlled release during storage against A. acidoterrestris [13]. Similar to nisin, hen egg white lysozyme has Generally Recognized as Safe (GRAS) status. It has been used as a food preservative in cheeses, cow's milk, beer, fresh fruits and vegetables, fish, meat and wine [8]. Also, lysozyme could inhibit the growth of A. acidoterrestris in solution, incorporated in water-soluble polyvinyl alcohol films or immobilized on polymer films [14]. Due to its safety and high technological stability, it is considered as an ideal food preservative. European Union allergen legistration requires its labeling because of its ability to cause allergies [15].

    Temperature is one of the important extrinsic factors that affect the microbial growth and can be easily changed during food processing and storage. Many predictive models have been developed to investigate the growth kinetics under different temperature conditions [16]. To our knowledge, there is no study about the effect of storage temperature on the antimicrobial activities of nisin and lysozyme against A. acidoterrestris in juice. Therefore, the objectives of the present study were to determine the inhibitory effects of nisin and lysozyme against A. acidoterrestris DSM 3922 cells in the apple juice at different storage temperatures (27, 35 and 43 ℃) and finally to estimate the growth kinetic parameters at non-inhibitory doses.


    2. Materials and Method


    2.1. Bacterial strain

    A. acidoterrestris DSM 3922 type strain was kindly provided by Karl Poralla (Deutsche SammLung von Mikroorganismen und Zellkulturen's collection, Braunschweig, Germany). This culture was grown on Bacillus acidoterrestris Agar (pH 4.0, Merck, Germany) for 2 days at 43 ℃, and then stored in 20% glycerol-BAT broth (Döhler, Germany) at –80 ℃ for further analysis.


    2.2. Juice samples

    Concentrated apple juice (70.3° Brix) was kindly provided by ASYA Fruit Juice and Food Ind. Inc. (Isparta, Turkey) and reconstituted to 11.30 °Brix by a refractometer (Mettler Toledo, USA). The presence of Alicyclobacillus spp. contamination in juice samples was determined by membrane filtration method as previously described [17]. The pH of the juice was measured as 3.82 ± 0.01 (Hanna instruments, Hungary).


    2.3. Antimicrobials

    Lysozyme (≥40, 000 units/mg protein) from hen egg white and nisin from Lactococcus lactis (2.5%, balance sodium chloride and denatured milk solids) were obtained from Sigma Chem. Co. (St Louis, MO, USA).


    2.4. Growth study and modeling

    First, A. acidoterrestris cells were grown overnight on Potato dextrose agar (Difco, BD) at 43 ℃. The colonies were suspended in 10 mL Maximum Recovery Diluent (Oxoid) to obtain a bacterial density of McFarland 1.0 (106 CFU/mL) using a densitometer (Den-1, HVD Life Sciences, Austria). After centrifugation at 16, 000 × g for 5 min, the pellet was dissolved in 10 mL apple juice. Then, 180 μL juice containing antimicrobial (nisin 0–100 IU/mL or lysozyme, 0–100 mg/L) and 20 μL of the bacterial suspension were added into the wells of a flat bottom 96-well plate in duplicates (Corning Costar) for each temperature tested. The plates were incubated individually at 27, 35 or 43 ℃ in a microplate reader (Varioskan® Flash, Thermo, Finland). Inoculated apple juice without antimicrobials was used as control. Absorbance of the well contents was determined at 600 nm. The averages of absorbance values versus time were plotted to form growth curves. The MIC was defined as the lowest concentration required for the inhibition. Experimental growth data were fitted to the Baranyi growth model [18] in DMFit Version 2.1 software (Institute of Food Research, Norwick, UK) to estimate the growth parameters at non-inhibitory doses.


    2.5. Model evaluation

    The mean values and standard deviations were calculated by Excel (Microsoft Corp., USA). The fitting of the model to the experimental data was determined by coefficient of determination (R2) calculated by the DMFit 2.1 program. The higher R2 values provide better prediction by the fitted model [18].


    3. Results and Discussion


    3.1. MIC values of nisin and lysozyme in the apple juice

    Growth inhibition of A. acidoterrestris in apple juice with nisin was independent on storage temperature. MICs were found as 10 IU/mL nisin under all conditions. Since nisin has great stability at high temperatures and low pH, especially at the range of pH 3–4, it has been used to inhibit or control the growth of A. acidoterrestris in highly acidic drinks [11]. The antimicrobial activity of nisin depends on food environment factors such as pH, lipid content, particle size, storage time, and structural uniformity [19]. During storage, antibacterial activity of nisin is increased in high pH foods and at high temperatures [20]. In the related literature, different MIC values have been reported for Alicyclobacillus spp. This may be due to nisin concentration, the characteristics of juice or medium and the tested species [21]. The MICs of nisin were also found lower than those of other studies but it is difficult to compare the obtained results with previous studies because of the use of different organisms, growth and incubation conditions [21].

    In another study, Yamazaki et al. (2000) concluded that nisin has inhibitory effect in unclear commercial juices and no effect in clear drinks. They suggested that nisin may bind polyphenols present in unclear juices and growth may be inhibited because of the binding of nisin to some particles present in the unclear apple juice and the synergism between the polyphenols and nisin. In a previous study, cell growth was completely inhibited in the presence of 100 IU/mL nisin in grapefruit, apple and orange juices at 43 ℃ [10]. According to Yamazaki et al. (2000), cell growth was inhibited on agar plates by 1.56 to 25 IU/mL and 25 to 100 IU/mL at pH 3.4 and 4.2, respectively during incubation at 46 ℃.

    Storage at lower temperatures caused the use of higher amounts of lysozyme. The activity of lysozyme was increased at higher temperatures. Denatured lysozyme by heating was found to indicate enhanced antimicrobial activity due to the polymerization [22]. In this study, increasing the storage temperature may have improved the enzymatic activity of lysozyme against A. acidoterrestris by lowering the amount needed for inhibition. The MICs were 10, 2.5 and 1.25 mg/L at 27, 35 and 43 ℃, respectively. In the related literature, it was found to exhibit the highest antimicrobial activity against A. acidoterrestris in saline solutions and the addition of lysozyme in laboratory medium resulted in a protective effect [23]. These researchers also found that the MICs of lysozyme towards vegetative cells ranged from 0.1–6 mg/L in acidified malt extract broth. We also found the MICs of lysozyme in the apple juice within this range at 35 ℃ and 43 ℃.


    3.2. Growth parameters after exposure to nisin and lysozyme in the apple juice

    Although the measurement of the absorbance is useful to estimate its growth, it might help to compare the growth rate and lag time under different conditions [24]. Since growth models developed in sterile broth do not always provide reliable predictions of pathogen growth on non-sterile and non-homogenous foods [25], growth studies were achieved in apple juice instead of laboratory medium or model juice to estimate the growth parameters in this study. As seen from Tables 1 and 2, the growth curves fitted to the Baranyi model had high R2 values (≥0.98). The R2 values indicated that fitted models provided good fit to the experimental data.

    Table 1. Estimated growth kinetic parameters of A. acidoterrestris cells in the apple juice with nisin at 27, 35 and 43 ℃.
    T (℃) IU/mL λ (h) µ (h–110–4) R2
    27 1.25 25.79 ± 0.56 16.98 ± 0.37 0.997
    2.5 29.83 ± 3.45 14.13 ± 1.67 0.997
    5.0 48.00 ± 1.69 18.07 ± 2.59 0.990
    Control 22.67 ± 0.59 10.13 ± 0.21 0.999
    35 1.25 28.06 ± 0.62 33.40 ± 0.47 0.997
    2.5 31.42 ± 0.25 34.11 ± 1.09 0.998
    5.0 36.50 ± 0.79 36.90 ± 0.00 0.995
    Control 9.91 ± 1.80 28.58 ± 2.05 0.996
    43 1.25 18.48 ± 0.01 51.37 ± 0.00 0.983
    2.5 10.1 ± 0.01 37.9 ± 0.03 0.992
    5.0 18.5 ± 0.00 51.4 ± 1.00 0.980
    Control 5.33 ± 0.04 33.76 ± 0.37 0.990
    Values are estimated using an average of replicates obtained from growth curves. λ is lag phase (h); µ is specific growth rate (h–110–4).
     | Show Table
    DownLoad: CSV
    Table 2. Estimated growth kinetic parameters of A. acidoterrestris cells in the apple juice with lysozyme at 27, 35 and 43 ℃.
    T (℃) mg/L λ (h) µ (h–110–4) R2
    27 1.25 30.53 ± 1.87 13.51 ± 0.27 0.999
    2.5 43.04 ± 1.46 14.41 ± 0.47 0.999
    5.0 51.10 ± 1.33 16.52 ± 0.30 0.994
    Control 22.67 ± 0.59 10.13 ± 0.21 0.999
    35 0.3 16.69 ± 0.22 22.17 ± 0.04 0.989
    0.6 21.11 ± 0.31 25.28 ± 0.05 0.990
    1.25 25.71 ± 1.00 31.81 ± 0.40 0.986
    Control 9.91 ± 1.80 28.58 ± 2.05 0.996
    43 0.08 7.06 ± 0.00 31.94 ± 0.00 0.991
    0.16 7.80 ± 0.04 31.56 ± 1.01 0.992
    0.3 14.71 ± 0.03 36.61 ± 0.90 0.996
    Control 5.33 ± 0.04 33.76 ± 0.37 0.990
    Values are estimated using an average of replicates obtained from growth curves. λ is lag phase (h); µ is specific growth rate (h–110–4).
     | Show Table
    DownLoad: CSV

    The estimated lag times decreased and growth rates increased with increasing storage temperature among the controls. The growth was favored at 43 ℃ with the highest growth rate and shortest lag times most probably due to the thermophilic nature of the tested organism. As seen from Table 1, there was a strong correlation between the growth rates and nisin concentrations at 35 ℃ (R2 > 0.91). In general, it is accepted that µ is not influenced by sublethal injuries after conventional preservation treatments and is identical to that of untreated cells. After exposure to some novel technologies such as pulsed electric fields and electron beam irradiation, the growth rate of surviving cells can be changed [6]. In the present study, the growth rates of the treated cells were higher than that of the controls within each temperature (Table 1). The addition of nisin in the apple juice resulted in an extension of lag phase compared to untreated control cells. We observed a relationship between the lag time and nisin concentrations at 27 and 35 ℃ (R2 > 0.83). At the highest non-inhibitory nisin dose, the increase in the lag time was approximately 25, 27 and 13 h at 27 ℃, 35 ℃ and 43 ℃, respectively.

    The growth rates in the presence of lysozyme ranged from approximately 13.5 to 16.5, 22.2 to 31.8, and 31.6 to 36.6 × 10⁻⁴ h–1 at 27, 35, and 43 ℃, respectively (Table 2). We observed a linear relationship between the rate and lysozyme concentration at 27 ℃ (R2 > 0.94). As the temperature decreased, the effect of lysozyme on the lag phase extension was more pronounced. There was a strong linear relationship between the lag time and lysozyme concentrations at 27 and 35 ℃ (R2 > 0.98). The treatment with 1.25, 2.5 and 5 mg/L lysozyme delayed the lag time approximately 8, 20 and 28 h at 27 ℃, respectively. When the temperature was increased to 43 ℃, the lag time was delayed with approximately 2, 2.5 and 9 h in the apple juice with 0.08, 0.16 and 0.3 mg/mL lysozyme, respectively. To our knowledge, there is only one study about the modeling growth kinetics of A. acidoterrestris in the broth with monolaurin using absorbance data [26]. They found that the Gompertz and Baranyi models were satisfactorily described the growth curves of cells in the presence of monolaurin. According to their results, monolaurin could be used to inhibit the growth and it was effective on cells by delaying the lag phase approximately 8 h and reducing the growth index from 48% to 32–37%.


    4. Conclusion

    We observed a significant difference in the amounts of lysozyme for growth inhibition at three temperatures tested. Both nisin and lysozyme were effective to delay lag time and increase growth rate when used at lower amounts. Differences in the antimicrobial action of nisin and lysozyme against A. acidoterrestris could be explained by variations in storage temperature. The obtained results from this study will be useful to inhibit or delay the growth of A. acidoterrestris by combining extrinsic factors such as storage temperature and natural antimicrobials as a hurdle concept to prolong the shelf-life of commercial apple juices.


    Acknowledgements

    Authors would like to thank to the members of the Biotechnology and Bioengineering Research and Application Center of Izmir Institute of Technology for absorbance measurements.


    Conflicts of Interest

    All authors declare no conflicts of interest in this paper.


    [1] DEEDI (2011) Queensland coal seam gas overview. Department of Employment, Economic Development and Innovation, Geological Survey of Queensland.
    [2] USGS (2000) Coal-Bed Methane: Potential and Concerns. U.S. Geological Survey.
    [3] Murray J (2012) Coal Seam Gas Water-River Discharge: Context Matters. International Conference on Health, Safety and Environment in Oil and Gas Exploration and Production.
    [4] NWC (2011) Onshore co produced water extent and management. Waterlines Report Series No 54: Commonwealth of Australia, National Water Commission (NWC), Waterlines Report Series No 54.
    [5] Veil JA, Puder MG, Elcock D, et al. (2004) A white paper describing produced water from production of crude oil, natural gas, and coal bed methane. Lemont, IL: Prepared for US Department of Energy, National Energy Technology Laboratory.
    [6] Harrison SM, Molson JW, Abercrombie HJ, et al. (2000) Hydrogeology of a coal-seam gas exploration area, southeastern British Columbia, Canada: Part 1. Groundwater flow systems. Hydrogeol J 8: 608-622.
    [7] Anna LO (2003) Groundwater flow associated with coalbed gas production, Ferron Sandstone, east-central Utah. Int J Coal Geol 56: 69-95. doi: 10.1016/S0166-5162(03)00077-6
    [8] Fisher JB (2003) Environmental issues and challenges in coalbed methane production. 18th International Low Rank Fuels Symposium.
    [9] Young AL (2005) Coalbed Methane: A New Source of Energy and Environmental Challenges. Environ Sci Pollut R 12: 318-321. doi: 10.1065/espr2005.11.002
    [10] Bergquist E, Evangelista P, Stohlgren TJ, et al. (2007) Invasive species and coal bed methane development in the Powder River Basin, Wyoming. Environ Monit Assess 128: 381-394. doi: 10.1007/s10661-006-9321-7
    [11] NSW-DTI. 2011. NSW government investigates saline water leak [Internet]. NSW Department of Trade and Investment. Available from: http://www.resources.nsw.gov.au/news/saline-water-leak
    [12] ABC-News, 2012. Drilling scare halts coal seam gas work. ABC News online. Available from: http://www.abc.net.au/news/2012-04-28/drilling-scare-halts-coal-seam-gas-work/3977786
    [13] QWC (2012) Underground Water Impact Report for the Surat Cumulative Management Area. State of Queensland, Queensland Water Commission (QWC).
    [14] Navi M, Skelly C, Taulis M, et al. (2015) Coal seam gas water: potential hazards and exposure pathways in Queensland. Inter J Env Heal R 25: 162-183. doi: 10.1080/09603123.2014.915018
    [15] Stearman W, Taulis M, Smith J, et al. (2014) Assessment of geogenic contaminants in water co-produced with coal seam gas extraction in Queensland, Australia: implications for human health risk. Geosciences 4: 219-239. doi: 10.3390/geosciences4030219
    [16] ATSDR (2005) Public Health Assessment Guidance Manual. Agency for Toxic Substances and Disease Registry.
    [17] Nuckols JR, Ward MH, Jarup L (2004) Using geographic information systems for exposure assessment in environmental epidemiology studies. Environ Health Persp 112: 1007.
    [18] Jarup L (2004) Health and environment information systems for exposure and disease mapping, and risk assessment. Environ Health Persp 112: 995. doi: 10.1289/ehp.6736
    [19] Hargrove WW, Levine DA, Miller MR, et al. GIS and risk assessment: A fruitful combination; 1996.
    [20] Chen X, Feigley C, Frank E, et al. (1998) Exposure Assessment for Trichloroethylene in Drinking Water Using a Geographic Information System. Geographic information systems in public health, third national conference. San Diego: Agency for Toxic Substances and Disease Registry.
    [21] Rupert MG (1999) Improvements to the DRASTIC Ground-Water Vulnerability Mapping Method. US Geological Survey.
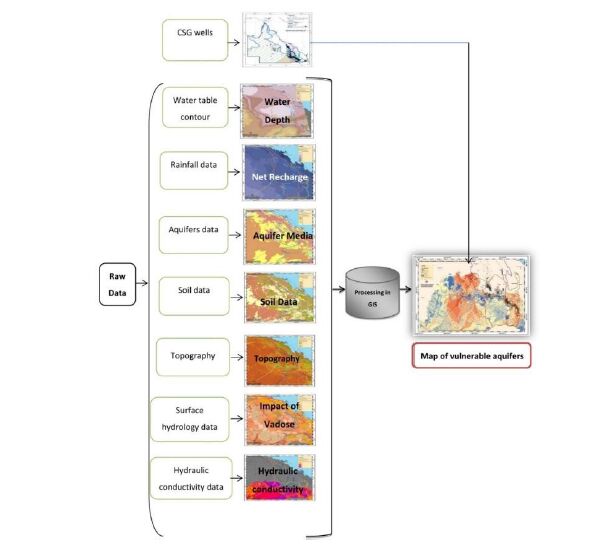
    [22] Aller L, Bennett T, Lehr JH, et al. (1987) Drastic–a standardized system to evaluate groundwater pollution potential using hydrogeologic setting. US Environmental Protection Agency.
    [23] Stigter T, Ribeiro L, Dill AC (2006) Evaluation of an intrinsic and a specific vulnerability assessment method in comparison with groundwater salinisation and nitrate contamination levels in two agricultural regions in the south of Portugal. Hydrogeol J 14: 79-99. doi: 10.1007/s10040-004-0396-3
    [24] BOM (2011) The Australian Hydrological Geospatial Fabric. Australian Bureau of Meteorology. Available from:ftp://ftp.bom.gov.au/anon/home/geofabric
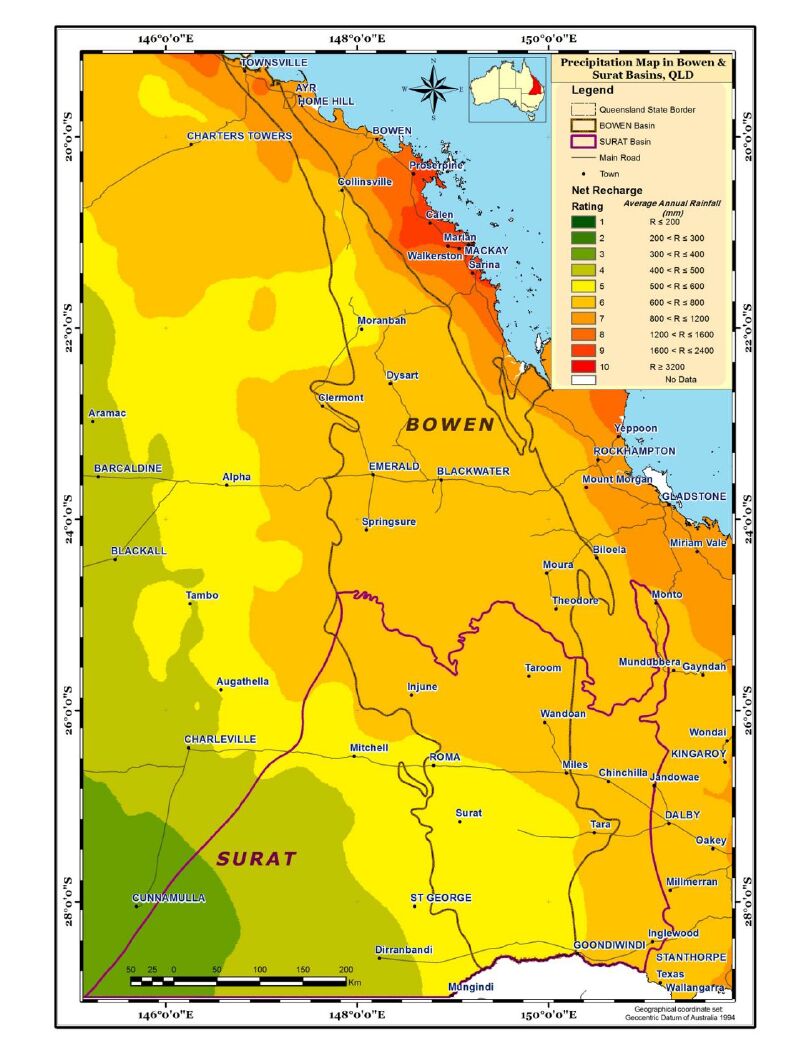
    [25] BOM (2009) Climate, Rain Fall/ National Surface Water. Australian Bureau of Meteorology. Available from http://www.bom.gov.au/jsp/ncc/climate_averages/rainfall/index.jsp
    [26] Babiker IS, Mohamed MA, Hiyama T, et al. (2005) A GIS-based DRASTIC model for assessing aquifer vulnerability in Kakamigahara Heights, Gifu Prefecture, central Japan. Sci Total Environ 345: 127-140. doi: 10.1016/j.scitotenv.2004.11.005
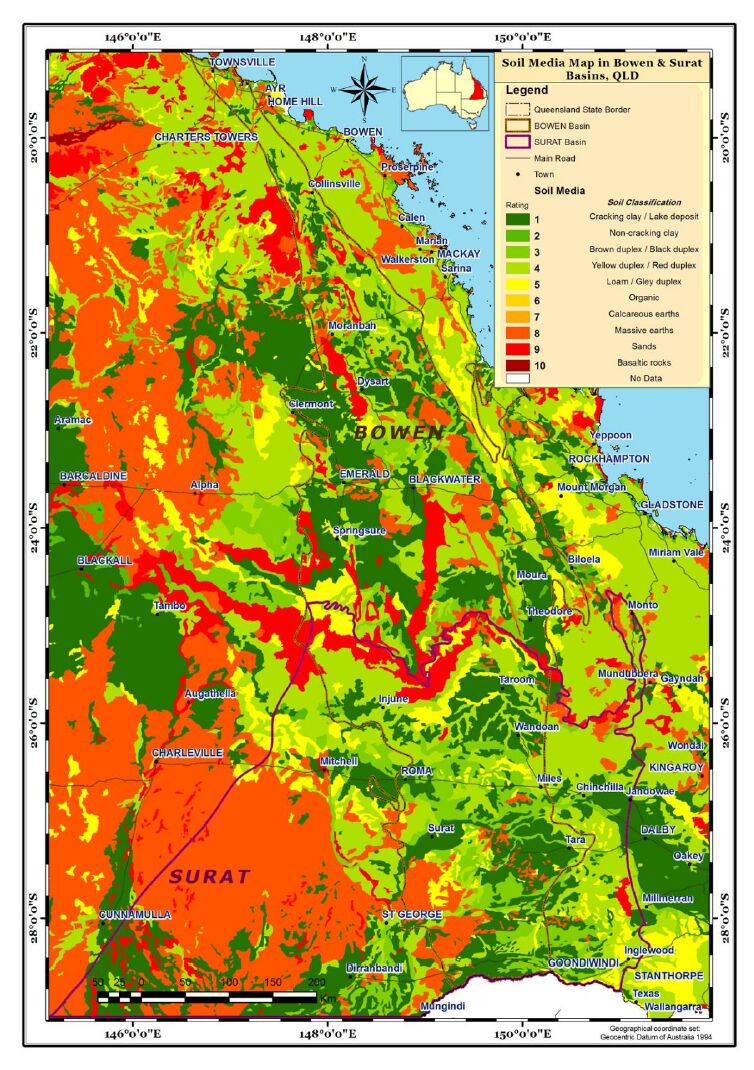
    [27] CSIRO (1991) Digital Soil Atlas. The Commonwealth Scientific and Industrial Research Organisation (CSIRO). Available from: http://www.asris.csiro.au/downloads/Atlas/soilAtlas2M.zip
    [28] Geoscience-Australia (2000) Digital Elevation Model (DEM). Geoscience Australia. Available from https://data.qld.gov.au/dataset/digital-elevation-model-3-second-queensland
    [29] ABS (2011) Population by Age and Sex, Regions of Australia. Australian Bereau of Statistics. Available from: http://www.abs.gov.au/websitedbs/censushome.nsf/home/tablebuilder
  • This article has been cited by:

    1. Alina Kunicka-Styczyńska, Agnieszka Tyfa, Dariusz Laskowski, Aleksandra Plucińska, Katarzyna Rajkowska, Krystyna Kowal, Clove Oil (Syzygium aromaticum L.) Activity against Alicyclobacillus acidoterrestris Biofilm on Technical Surfaces, 2020, 25, 1420-3049, 3334, 10.3390/molecules25153334
    2. Soisuda Pornpukdeewattana, Aphacha Jindaprasert, Salvatore Massa, Alicyclobacillusspoilage and control - a review, 2020, 60, 1040-8398, 108, 10.1080/10408398.2018.1516190
    3. Aryádina M Ribeiro, Aline D Paiva, Alexandra MO Cruz, Maria CD Vanetti, Sukarno O Ferreira, Hilário C Mantovani, Bovicin HC5 and nisin reduce cell viability and the thermal resistance of Alicyclobacillus acidoterrestris endospores in fruit juices , 2022, 102, 0022-5142, 3994, 10.1002/jsfa.11747
    4. Patra Sourri, Chrysoula C. Tassou, George-John E. Nychas, Efstathios Z. Panagou, Fruit Juice Spoilage by Alicyclobacillus: Detection and Control Methods—A Comprehensive Review, 2022, 11, 2304-8158, 747, 10.3390/foods11050747
  • Reader Comments
  • © 2017 the Author(s), licensee AIMS Press. This is an open access article distributed under the terms of the Creative Commons Attribution License (http://creativecommons.org/licenses/by/4.0)
通讯作者: 陈斌, bchen63@163.com
  • 1. 

    沈阳化工大学材料科学与工程学院 沈阳 110142

  1. 本站搜索
  2. 百度学术搜索
  3. 万方数据库搜索
  4. CNKI搜索

Metrics

Article views(16094) PDF downloads(1251) Cited by(1)

Article outline

Figures and Tables

Figures(10)  /  Tables(4)

Other Articles By Authors

/

DownLoad:  Full-Size Img  PowerPoint
Return
Return

Catalog