Review Topical Sections

Novel insights into the function of the conserved domain of the CAP superfamily of proteins

  • Members of the Cysteine-rich secretory proteins, Antigen 5, and Pathogenesis-related 1 proteins (CAP) superfamily are found in a remarkable variety of biological species. The presence of a highly conserved CAP domain defines the CAP family members, which in many cases is linked to other functional protein domains. As a result, this superfamily of proteins is involved in a large variety of biological processes such as reproduction, tumor suppression, and immune regulation. The role of the CAP domain and its conserved structure throughout evolution in relation to the diverse functions of CAP proteins is, however, poorly understood. Recent studies on the mammalian Golgi-Associated plant Pathogenesis Related protein 1 (GAPR-1), which consists almost exclusively of a CAP domain, may shed new light on the function of the CAP domain. GAPR-1 was shown to form amyloid fibrils but also to possess anti-amyloidogenic properties against other amyloid forming peptides. Amyloid prediction analysis reveals the presence of potentially amyloidogenic sequences within the highly conserved sequence motifs of the CAP domain. This review will address the structural properties of GAPR-1 in combination with existing knowledge on CAP protein structure-function relationships. We propose that the CAP domain is a structural domain, which can regulate protein-protein interactions of CAP family members using its amyloidogenic properties.

    Citation: Nick K. Olrichs, J. Bernd Helms. Novel insights into the function of the conserved domain of the CAP superfamily of proteins[J]. AIMS Biophysics, 2016, 3(2): 232-246. doi: 10.3934/biophy.2016.2.232

    Related Papers:

    [1] Lin Feng, Ziren Chen, Harold A. Lay Jr., Khaled Furati, Abdul Khaliq . Data driven time-varying SEIR-LSTM/GRU algorithms to track the spread of COVID-19. Mathematical Biosciences and Engineering, 2022, 19(9): 8935-8962. doi: 10.3934/mbe.2022415
    [2] Wenbo Yang, Wei Liu, Qun Gao . Prediction of dissolved oxygen concentration in aquaculture based on attention mechanism and combined neural network. Mathematical Biosciences and Engineering, 2023, 20(1): 998-1017. doi: 10.3934/mbe.2023046
    [3] Huanhai Yang, Shue Liu . A prediction model of aquaculture water quality based on multiscale decomposition. Mathematical Biosciences and Engineering, 2021, 18(6): 7561-7579. doi: 10.3934/mbe.2021374
    [4] Hamdy M. Youssef, Najat A. Alghamdi, Magdy A. Ezzat, Alaa A. El-Bary, Ahmed M. Shawky . A new dynamical modeling SEIR with global analysis applied to the real data of spreading COVID-19 in Saudi Arabia. Mathematical Biosciences and Engineering, 2020, 17(6): 7018-7044. doi: 10.3934/mbe.2020362
    [5] Vasiliy N. Leonenko, Sergey V. Ivanov . Prediction of influenza peaks in Russian cities: Comparing the accuracy of two SEIR models. Mathematical Biosciences and Engineering, 2018, 15(1): 209-232. doi: 10.3934/mbe.2018009
    [6] Mahmudul Bari Hridoy . An exploration of modeling approaches for capturing seasonal transmission in stochastic epidemic models. Mathematical Biosciences and Engineering, 2025, 22(2): 324-354. doi: 10.3934/mbe.2025013
    [7] Faisal Mehmood Butt, Lal Hussain, Anzar Mahmood, Kashif Javed Lone . Artificial Intelligence based accurately load forecasting system to forecast short and medium-term load demands. Mathematical Biosciences and Engineering, 2021, 18(1): 400-425. doi: 10.3934/mbe.2021022
    [8] Peng Lu, Ao Sun, Mingyu Xu, Zhenhua Wang, Zongsheng Zheng, Yating Xie, Wenjuan Wang . A time series image prediction method combining a CNN and LSTM and its application in typhoon track prediction. Mathematical Biosciences and Engineering, 2022, 19(12): 12260-12278. doi: 10.3934/mbe.2022571
    [9] Xihe Qiu, Xiaoyu Tan, Chenghao Wang, Shaotao Chen, Bin Du, Jingjing Huang . A long short-temory relation network for real-time prediction of patient-specific ventilator parameters. Mathematical Biosciences and Engineering, 2023, 20(8): 14756-14776. doi: 10.3934/mbe.2023660
    [10] Liying Zhao, Ningbo Cao, Hui Yang . Forecasting regional short-term freight volume using QPSO-LSTM algorithm from the perspective of the importance of spatial information. Mathematical Biosciences and Engineering, 2023, 20(2): 2609-2627. doi: 10.3934/mbe.2023122
  • Members of the Cysteine-rich secretory proteins, Antigen 5, and Pathogenesis-related 1 proteins (CAP) superfamily are found in a remarkable variety of biological species. The presence of a highly conserved CAP domain defines the CAP family members, which in many cases is linked to other functional protein domains. As a result, this superfamily of proteins is involved in a large variety of biological processes such as reproduction, tumor suppression, and immune regulation. The role of the CAP domain and its conserved structure throughout evolution in relation to the diverse functions of CAP proteins is, however, poorly understood. Recent studies on the mammalian Golgi-Associated plant Pathogenesis Related protein 1 (GAPR-1), which consists almost exclusively of a CAP domain, may shed new light on the function of the CAP domain. GAPR-1 was shown to form amyloid fibrils but also to possess anti-amyloidogenic properties against other amyloid forming peptides. Amyloid prediction analysis reveals the presence of potentially amyloidogenic sequences within the highly conserved sequence motifs of the CAP domain. This review will address the structural properties of GAPR-1 in combination with existing knowledge on CAP protein structure-function relationships. We propose that the CAP domain is a structural domain, which can regulate protein-protein interactions of CAP family members using its amyloidogenic properties.


    Abbreviations

    GDPGuanosine diphosphate
    GPCRG Protein Coupled Receptor
    GTPGuanosine triphosphate
    GTPγSGuanosine 5’-[γ-thio]triphosphate
    P-loopphosphate binding loop
    REUROSETTA Energy Units
    r.m.s.droot mean square deviation
    ΔΔGdelta, delta G binding interface energy

    1. Introduction

    G protein-coupled receptors (GPCRs) are the largest and most diverse class of membrane receptors in eukaryotes[1]; they bind many different types of ligands to initiate an array of intracellular signaling cascades. GPCRs primarily interact with membrane associated, heterotrimeric complexes called G proteins in order to transduce their extracellular signal into a cellular response. The three subunits, Gα, β, and γ, undergo conformational changes to interact with different protein binding partners along their signaling cycle in order to transmit the appropriate messages within the cell [1,2].

    The most dynamic changes in structure and affinity can be seen in the Gα subunit, which mitigates each step of the complex’s signaling dynamics and function [3,4,5]. The affinity of the Gα subunit to each of its different binding partners is determined by the structural changes it undergoes within the signaling cycle [6]. Therefore one can think of the Gα subunit as the control center of this signal transducing machinery as it preferentially interacts with different proteins, complexes, and small molecules via conformational changes of its own structure to propagate the information to other signaling moieties within the cell (Figure 1A).

    Figure 1. G protein coupled receptors (GPCRs) typically signal through interaction with membrane-associated heterotrimeric G proteins. These proteins become activated via the exchange of GDP for GTP, induced by the activated receptor (R*). Upon this nucleotide exchange, the heterotrimer dissociates into the monomer Gα(GTP) and Gβγ dimer which may then interact with downstream signal effector proteins (not shown for clarity) to propagate and amplify intracellular signaling. The cycle is complete when Gα hydrolyzes GTP to GDP + Pi which allows the trimer to reassemble into the basal, non-signaling state. A) Linear schematic of the G protein signaling cycle. B) ROSETTA-derived structural representations of the three Gα states examined herein; Gαi1(GDP)β1γ1, R*-Gαi1(empty)β1γ1, and Gαi1(GTP).

    1.1. G protein signaling cycle

    In its inactive state, the Gα subunit has a high affinity for the nucleotide GDP, possesses a closed helical domain, and interacts with the Gβγ subunits. Upon interaction with an activated GPCR, the Gα subunit undergoes conformational changes to accommodate binding the receptor (Figure 1B) [5,7,8]. This includes the rigid body rotation of its α5 helix up and into the receptor (Figure 2), as it moves along the hydrophobic β-sheets surrounding it to create new interactions sites within the GTPase domain and to the helical domain [9]. This rotation signals to the rest of the complex through an altered interaction network that the Gα subunit is bound to the receptor. In this receptor-bound conformation, the Gα subunit’s affinity for GDP is drastically reduced as its flexible helical domain opens to allow nucleotide escape [10]. Upon GDP release, the Gα subunit has a high affinity for GTP, though the nucleotides only differ in the addition of a single phosphate group. Once GTP is present in the binding pocket, the Gα subunit once again alters its conformation and affinity for both the activated receptor and the Gβγ subunits bound to it. Subsequent dissociation of the Gα subunit from this complex frees Gα, as well as Gβγ, to interact with downstream signaling effector proteins and regulator molecules in order to continue the signaling cascade [11]. In this GTP-bound, active conformation, the Gα subunit possesses different binding interfaces to interact with various effector moieties [3,12]. The intrinsic enzymatic ability of Gα hydrolyzes GTP back to GDP [2]. The rate of hydrolysis can be altered by interacting with accessory proteins which alter the enzyme’s catalytic efficiency [13]. Upon cleavage of the γ phosphate group, the Gα subunit structure returns to its basal state where its propensity to complex with Gβγ is once again higher than its affinity to interact with other signaling moieties; the reunion of the heterotrimer allows the signaling cycle to terminate or for the complex to begin additional rounds of signaling [1].

    Figure 2. A) Representative Gαi1(GDP) structure in the basal state (β1γ1removed for clarity) and rotated 180°. Basal nucleotide (GDP) is depicted in dark blue. B) The sequence is derived from rat Gαi1. Secondary structure elements (red—helices, blue—sheets, and green—critical loop regions) are labeled as described in [3].

    1.2. Significance

    Current progress in crystallization of GPCRs has greatly aided in our understanding of the G protein’s role within the ternary complex model. Recent work from the Kobilka laboratory has provided the first glimpse of an activated GPCR, the β2-Adrenergic receptor, in complex with a Gαs heterotrimeric G protein [5]. However, the experimental structure does not provide information on the energetic interactions between amino acids critical for the signaling process. What are the energetic contributions of interactions, broken and newly made, that move the signal from the receptor to the nucleotide binding site? Such an analysis is complicated as the experimental structure presents a static image of interactions in a dynamic system. Crystal structures alone cannot show the conformational dynamics the Gα subunit must continue to undergo to propagate information to the rest of the complex. Further, the use of nanobodies, mutations, and various crystallization aids can alter physiologically relevant conformations of the protein to achieve the most energetically stable interactions for crystal formation.

    To better understand the modulatory process the Gα subunit undergoes to propagate its signaling information, an energetic analysis of these conformational changes was performed. We introduce a new pairwise, residue-residue assessment of protein side chain and backbone interactions to describe tertiary topology. Using the available crystallographic structures of each conformation the Gα subunit progresses through during different signaling states, we have created interaction network “maps”. Specifically, we have chosen to investigate the heterotrimeric G protein α subunit in its basal, receptor-unbound Gαi1(GDP)βγ state, the receptor-bound R*-Gαi1(empty)βγ state, and the activated, monomeric Gαi1(GTP) state using the protein software suite, ROSETTA (Figure 1B).

    Understanding the mechanism of cellular signaling is a crucial step in understanding the biology of any living organism. This article analyzes changes in conformational and structural information by evaluating the predicted energy of interactions required to maintain function of the Gα subunit before, during, and after binding with the membrane-bound receptor. The ROSETTA protein modeling software allows interrogation of intra-protein and inter-protein interactions on the amino acid level. Using an established comparative modeling protocol [14,15] and binding interface analysis [16,17], we have created the first comprehensive framework for interrogation of pairwise amino acid interactions across each of the signaling states. This analysis has allowed us to create predictive communication maps between interacting side chain pairs throughout the Gα structure as the conformational shifts propagate.

    2. Materials and Methods

    2.1. Models

    To create interaction networks within the different signaling states of the G protein α subunit, we have combined several methodologies. Using previously published comparative models of the GPCR-Gαi1 heterotrimeric proteins [9], we have created an ensemble of structures for both the basal Gαi1(GDP)βγ and the receptor-bound R*-Gαi1(empty)βγ states. Likewise, we have utilized the available crystal structures of activated, monomeric Gαi1 for a similar analysis (PDBIDs: 1GIA, 1GIL). Each structure of activated Gαi1 was energy-minimized in the presence of its GTP-analogue. To ensure a robust sampling of the backbone and side chain conformational space consistent with low energy, 500 models were created based on a Gαi crystal structure (PDBID 1GIA). As more extensive sampling with 1000 poses was not shown to greatly increase model quality, generation of 500 models was used for all other structures. This is consistent with the findings of previous protocols [9]. Of these models, the ten lowest scoring models by ROSETTA score were shown to cover the spread of structural flexibility without allowing for larger structural deviations (Supplemental Figure 1). These ten models were employed for further analysis. For all analyses herein, each model possessed the appropriate nucleotide for the given signaling state during all calculations.

    2.2. ΔΔG

    From these initial models we then probed for intra- and intermolecular interaction energies using the ROSETTA computer modeling software suite. Three signaling states of the G protein α subunit were addressed: Gαi1(GDP)βγ, R*-Gαi1(empty)βγ, and Gαi1(GTP) (Figure 1B). For each state, the binding interface energy (ΔΔG) was calculated for various key inter-protein interfaces across the complex and within the GTPase and the helical domains of the Gα subunit. Regions for analysis were selected for their roles as protein-protein interfaces or for their apparent role in maintaining protein stability within each conformational state. Specifically, key secondary structure elements (Figure 2) were evaluated for their ability to contribute to overall protein stability by calculating the changes in free energy before and after removal from the structure. Note that all energies are given in ROSETTA Energy Units (REUs) and include predicted contributions of van der Waals interactions, desolvation effects, hydrogen bonds, and electrostatics. While the ROSETTA-predicted energy has been shown to correlate with the free energy in kcal/mol [16,17], it is important to highlight that inaccuracies in the structural models and simplifications in the ROSETTA energy function lead to deviations between predicted and experimentally observed energies. Furthermore, the internal energy of small molecules is assumed to be unaltered upon binding to the protein; the energy measurements herein reflect energy perturbations induced by the ligand when binding to the protein. All ΔΔG results are reported as the absolute value of REU scores for consistency with previously published data [9].

    2.3. Pairwise interaction score analysis

    Each of the three signaling states of the Gαi1 subunit were then interrogated at the amino acid level utilizing ROSETTA’s pairwise score breakdown assessment. This feature calculates the interaction score for each possible amino acid pair. Note, that while this score is also measured in ROSETTA Energy Units (REUs) it is not a free energy in the thermodynamic sense. We therefore call these values consistently ‘interaction scores’. However, this analysis allows for intra-molecular probing of information flow across signaling states while creating a network of stabilizing amino acid interactions. A protocol capture for this application has been validated externally and is available for public use within the ROSETTA framework. Herein, we apply this method to the G protein αi1 subunit to highlight the method’s effectiveness in predicting relevant structural nuances. Each of the signaling states of Gαi1 were assessed by averaging the per-residue contribution of the top ten lowest scoring models. The appropriate nucleotides and subunits were present throughout all calculations.

    2.4. Pairwise interaction score calculation

    Pairwise interaction scores were calculated using the ROSETTA software suite. The per residue score breakdown was calculated on ten comparative models which were created as previously described [9].

    /residue_energy_breakdown.linuxgccrelease -database /rosetta/main/database/ -in:files:s <list individual pdbs> -output:prefix <output file name> -restore_pre_talaris_2013_behavior

    2.5. Protocols for pairwise interaction score analysis

    Average per residue interaction pairs were calculated across ten models per signaling state in MATLAB using the following script:

    file_1 = 'model_1.xlsm';

    [~, ~, raw_1] = xlsread(file_1);

    model_1 = zeros(5223, 3);

    model_1(:, 1) = cell2mat(raw_1(1:end, 3));

    model_1(:, 2) = cell2mat(raw_1(1:end, 5));

    model_1(:, 3) = cell2mat(raw_1(1:end, 26));

    new_matrix_1 = nan(354, 354);

    for i = 1:size(model_1)

     new_matrix_1(model_1(i, 1), model_1(i, 2))= model_1(i, 3);

    end

    Continued for all models analyzed, then average scores across all models:

    ave_matrix = nan(354, 354);

    for ii = 1:354

    for jj = 1:354

      ave_matrix(ii, jj) = mean([new_matrix_1(ii, jj) new_matrix_2(ii, jj) new_matrix_3(ii, jj) etc.]);

    end

    end

    g = ave_matrix(~isnan(ave_matrix));

    [i, j] = ind2sub(size(ave_matrix), find(~isnan(ave_matrix)));

    fin = [i, j, g];

    2.6. Protocol capture

    For further breakdown of all computational methods utilized herein, please refer to the companion Protocol Capture. All in silico methods and calculations were graciously verified by an external reviewer, Dr. J. Koehler Leman, Chemical and Biomolecular Engineering, Johns Hopkins University, Baltimore, MD.

    3. Results

    3.1. Estimating free energy changes across protein-protein interfaces

    Predicting free energy changes across protein-protein interfaces has been a staple in understanding the dynamics and kinetics of protein-protein interaction [16,18,19]. Used as a measure of binding efficiency, ΔΔG estimates are a useful means of probing the thermodynamic stability of a protein interface in the bound and unbound states [9,19,20]. For our purposes, we utilized this measure to assess the energetic contribution secondary structure elements possessed along intra-protein interfaces between the helical and GTPase domains as well as for inter-domain stability.

    For our calculations, specific secondary structure elements (Figure 2) were evaluated for their ability to contribute to overall protein stability by calculating the changes in free energy before and after their removal from the subunit structure. For all calculations, the appropriate nucleotides were present. The top ten lowest scoring models for the Gαi1(GDP)βγ, R*-Gαi1(empty)βγ, and Gαi1(GTP) states were each assessed, and their ROSETTA scores were averaged.

    3.1.1. GDP vs. GTP-bound models

    The Gαsubunit possesses similar energy in both the basal, Gαi1(GDP)βγ, and activated, Gαi1(GTP), states. This is expected as the two states differ only in the addition of a γ-phosphate ion. Though the Gβγ subunits were present for the basal calculations of the trimer, they do not significantly alter Gα’s energetics when evaluating regions such as the α1, α5, or αF helices (Figures 3-4,and Supplemental Tables 1-3). When evaluating these regions, the resulting energies highlight a consistency between these two states suggesting that any structural changes within these regions begin and end with similar energies of interaction.

    Figure 3. Structural representation of predicted ΔΔG of the α1 helix across three states of Gα signaling—Gαi1(GDP)β1γ1, R*-Gαi1(empty)β1γ1, and Gαi1(GTP). The α1 helix was defined as residues G45-E58 based on rat Gαi1 sequence. All calculations were averaged across the top ten scoring models for each state. Values reported here represent the absolute values of Rosetta Energy Units (REUs). REUs above 0.5 are considered significant. Residue contributions to the interface are color coded to indicate a greater contribution to stability. Lighter blue indicate a lower REU value relative to the darker shades.
    Figure 4. Structural representation of predicted ΔΔG of the α5 helix across three states of Gα signaling—Gαi1(GDP)β1γ1, R*-Gαi1(empty)β1γ1, and Gαi1(GTP). The α5 helix was extended to include part of the TCAT motif and is defined as residues C325-F354 based on rat Gαi1 sequence. All calculations were averaged across the top ten scoring models for each state. Values reported here represent the absolute values of ROSETTA Energy Units (REUs). REUs above 0.5 are considered significant. Residue contributions to the interface are color coded to indicate a greater contribution to stability. Lighter blue indicate a lower REU value relative to the darker shades. *Note: Gαi1(GTP) crystal structure only extends to residue I343 preventing analysis of the α5 helix beyond this residue in the activated, monomeric state.

    Noteworthy alterations in energies are seen around the nucleotide binding pocket and residues involved in stabilizing the Gβ interface between the basal and activated states. Examination of the P-loop and the variable Switch regions (I-III) (Figure 2) indicate more subtle ΔΔG changes across these regions (Supplemental Tables 4-7). In the basal, trimeric state, the Gβ subunit organizes the loop regions into a binding interface. In its absence, the activated monomeric models do not show significant changes as seen in ROSETTA energy scores overall, though specific amino acid positions are reported to modulate.

    3.1.2. Receptor-induced conformational changes

    In contrast to the basal and activated states, the R*-Gαi1(empty)βγ models show a stark transition in the communication network across the secondary structure elements of the Gα subunit. During this phase of the signaling cycle, the Gα subunit undergoes a large conformational change which can be seen in the shifting of energetics around the α1 helix, the α5 helix (Figures 3-4,Supplemental Tables 1-2), and regions involved with nucleotide stability, namely the P-loop and the variable Switch (I-III) regions (Supplemental Table 4-7). It is during this stage of the signaling cycle that the receptor induces activation, the helical domain is opened, and the guanine nucleotide is allowed to exchange. The results from our models are consistent with experimental studies of these structural changes [9,10,21].

    3.2. Predicting pairwise residue-residue contributions to protein stability

    To interrogate the conformational changes that must occur at the amino acid network level between the signaling states, we devised a new application for the Rosetta modeling software’s per-residue assessment of predicted interactions (publically available); this application allowed us to evaluate individual amino acid contributions to stability and function. For each of the three signaling states, the top ten models were assessed for each amino acid pair contribution to stability. The average score across the ten models was then plotted for each state (Figures 5-7,Supplemental Figures 2-8).

    Figure 5. Pairwise analysis of ROSETTA scores for individual amino acid interactions as a means to monitor information networks across signaling states. These interaction networks represent side chain and backbone atom contributions to the stability and functionality of the protein structure. These matrices compare across the protein signaling states to investigate predicted interaction (and therefore structural) changes between residue pairs. The x- and y-axes represent each residue position of the Gαsubunit compared across all other possible residue positions. Above the diagonal depicts the score difference (in REU) between the basal, heterotrimeric Gαi1(GDP)β1γ1structure and the receptor-bound complex, R*Gαi1(empty)β1γ1. The lower matrix below the diagonal depicts the score difference (in REU) between the basal, heterotrimeric Gαi1(GDP)β1γ1structure and the activated Gαi1(GTP) monomeric subunit after dissociation from Rhodopsin and β1γ1. Only the Gαsubunit’s amino acid contributions are shown for clarity. Residue-residue interactions in the range of −0.5 to 0.5 REU were removed to highlight more significant differences in contributions. Stabilizing residue interactions are depicted in red while a predicted loss of interaction scores are shown in blue. Note* The crystal structures used for the monomeric Gαi1(GTP) models lack residues 1-34, and 343-354. These residues are therefore removed from the analysis.
    Figure 6. Pairwise analysis of individual amino acid interactions across three Gαsignaling states to investigate changes between residue pairs interacting with the α1 helix and Linker 1 region (K46-I56, & H57-S62, respectfully). A) The heterotrimeric Gαi1(GDP)β1γ1structure in the basal state. B) The heterotrimeric Gαi1(empty)β1γ1subunits interacting with the GPCR, Rhodopsin. C) The activated Gαi1(GTP) monomeric subunit after dissociation from Rhodopsin and β1γ1. Only the Gαsubunit’s pairwise amino acid contributions are shown for A-C. REUs for individual pairs are color coded ranging from more stable predicted interaction scores (minimum −2.32) in blue to positive, repulsive scores terms (maximum 0.26) in red.
    Figure 7. Pairwise analysis of individual amino acid interactions across three Gαsignaling states to investigate changes between residue pairs interacting with the α5 helix (N331-I343). A) The heterotrimeric Gαi1(GDP)β1γ1structure in the basal state. B) The heterotrimeric Gαi1(empty)β1γ1subunits interacting with the GPCR, Rhodopsin. C) The activated Gαi1(GTP) monomeric subunit after dissociation from Rhodopsin and β1γ1. Only the Gαsubunit’s amino acid contributions are shown for A-C. REUs for individual pairs are color coded ranging from more stable predicted interaction scores (minimum −2.30) in blue to positive, repulsive score terms (maximum 0.31) in red. *Note: Gαi1(GTP) crystal structure lacks residues 344-354 preventing analysis of the full carboxyl terminus.

    To evaluate which interactions were made and broken between the different signaling states, we compared the basal, heterotrimeric Gαi1(GDP)β1γ1 model scores to the receptor-bound, R* Gαi1(empty)β1γ1 and to the monomeric, Gαi1(GTP) active state (Figure 5). From this calculation we show the variability of the Switch regions, as interactions are lost, or are diminished during receptor binding (red, above the diagonal) and remade in the active state (blue, below the diagonal). Some of this variability may be due to the loss of β1γ1 binding upon activation.

    The predicted opened and closed conformations of the helical domain are also recognized when evaluating residue-residue interactions across states. The receptor binding induces structural rearrangements that ultimately lead to helical domain opening [5,9,10,21]; therefore, the upper matrix, above the diagonal, indicates the helical domain must break contacts for activation (red). The basal and active Gαi1 subunits possess very similar secondary structure and tertiary fold. Therefore, fewer interactions are lost or diminished between the two states (below the diagonal). New interactions or more favorable interactions (blue) must be made to accommodate the GTP nucleotide and the lack of β1γ1 subunits.

    However, this broad representation does not do justice to the nuanced alterations of residue-residue interaction. In addition the overall number of intraprotein Gα interactions is not expected to change across the different signaling states as all secondary structure elements and the global tertiary fold is maintained. Though there are technically fewer intraprotein contacts when the helical domain is opened during the receptor bound state, these differences are subtracted from interaction scores that are present in the GDP-bound trimer; the result is a change in magnitude from interaction to no interaction that is recorded in this matrix. Additionally changes in magnitude for the pairwise interactions in the range of −0.5 to 0.5 REU were removed to highlight more significant contributions.

    3.2.1. The Switch Regions

    Across the three signaling states, a pattern of interaction emerges. As seen with the ΔΔG calculations (Figures 3-4, Supplemental Tables 1-8), the basal and activated Gα subunits maintain similar amino acid interactions. However, the γ phosphate group present in the activated Gα monomer leads to shifts in the communication networks of the Switch I-III regions (Supplemental Figures 2-4). As implied by their name, these regions have been shown to alter their conformation in the presence of GTP instead of GDP in crystal structures [22,23].

    The largest shift among these three elements is shown in the Switch II region (Supplemental Figure 3). This is expected as the Switch II region also interfaces with the Gβ subunit. Present in this analysis during the trimeric basal and receptor-bound states, the pairwise interaction map of Gβ with the Switch II region maintains interaction similarity and therefore structural similarity between these two states. Key differences can be seen around the Switch I and β2 elements with which the Switch II region interacts in the GDP-bound state, but not during the receptor bound state.

    Alterations in the communication network along the Gβ subunit itself were not the primary focus of the current study; however, the Gβ/Gγ subunits were present for the analysis of the basal and receptor-bound states. Therefore, they are included as interaction partners along the corresponding interface residues. Interestingly, the Gβ subunit does show an altered conformation network between the receptor-unbound and bound states suggesting some flexibility between the two G protein subunits. This modulation of the Gα Switch II region does not seem to show similar intra-protein interaction flexibility within the Gα subunit itself, but rather it highlights relevant changes within the heterotrimeric complex which may contribute to the mechanisms of receptor induced activation.

    3.2.2. Rearrangements from nucleotide exchange

    With this detailed analysis, we show that more elements other than the Switch regions possess an altered communication network. Subtle changes in the α1 helix, α5 helix, αF helix and P-loop highlight structural alterations induced by the nucleotide (Figures 6-7, Supplemental Figures 5-6). Specifically, the GDP-bound versus GTP-bound Gα subunit show altered network intensities along the β6-α5 loop within the highly conserved TCAT motif (residues 326-329 in Figure 2B). Changes in the P-loop are also much more dynamic than we had originally predicted (Supplemental Figure 6). Interactions with the residues 147-150 of the αD-αE loop in the basal state are not recovered in the active state. Likewise Switch II and III, and β4 interact with variable degrees of binding intensity (as defined by ROSETTA Energy Units) with the P-loop suggesting more dynamic structural rearrangements in this region.

    3.2.3. Receptor-induced network changes

    As expected, the receptor-bound heterotrimer possesses an altered interaction network indicative of altered structure. These conformational changes are highlighted in interaction shifts along the α1 helix and the α5 helix (Figures 6-7) as these secondary structure elements move to make transient connections. Connections are also lost between Switch I and the Switch II/β3 interface during receptor binding, which are recovered upon Gα activation and dissociation.

    On the backside of the Gα subunit, the P-loop, which has also been implicated in nucleotide stability and possible mechanisms of release [9,24,25] shows a drastic structural rearrangement and transition during receptor binding (Supplemental Figure 6). As observed above, the P-loop possesses a structural alteration resulting in a loss of interaction with the αD-αE loop that is not present during receptor binding nor is it recovered post-dissociation in the monomeric, active state.

    The linker 1 region connecting the helical domain to the GTPase domain via the α1 to αA helices also possesses a shift in conformation (Figure 6,Supplemental Figure 7). This element was hypothesized to be an important mechanistic feature to allow domain opening for nucleotide escape [10,24]. However some movement is expected as it does not possess any secondary structure elements.

    3.2.4. The Helical Domain as a rigid body

    Interesting secondary structural elements within the helical domain, such as the αA helix, do not drastically alter their interaction networks across the three signaling states. This suggests that these elements move together while maintaining a similar tertiary fold (Supplemental Table 8,Supplemental Figure 8). These results are in agreement with DEER, EPR, NMR and crystallographic data [5,10,25], which suggests the helical domain moves as rigid body away from the nucleotide binding pocket [5,10,21].

    4. Discussion and Conclusions

    The heterotrimeric G protein undergoes dynamic changes in its structure and its binding affinity throughout the stages of the signaling cycle. We utilized structural models of these conformational states to analyze the energetic contributions that stabilize intra- and inter-molecular interactions that define these states, specifically within the Gαi1 subunit. This new analysis application predicts key amino acids to be nodes within the information network that propagate the signal across the complex upon interaction with the receptor.

    Utilizing the ROSETTA software suite, we computed energy values for residue interactions along different binding interfaces. This benchmarked computational technique has been shown to provide useful insight in the following studies [16,17,26]. Likewise, ROSETTA was used to compute pairwise interactions between individual amino acids within the Gα subunit of the heterotrimeric G protein. This technique allowed us to compare the predicted thermodynamically stabilizing interactions between the basal, receptor-bound and activated conformations of the Gα subunit. Through this analysis we were able to detect intra-protein differences in amino acid interaction networks important for propagating conformational changes.

    In a previous analysis [9] the Gαi1 subunit was evaluated in the basal, GDP-bound trimeric state and in the receptor-bound state through the use of ΔΔG analysis. Our current study expands on this progress by also including the activated monomeric state for comparison of energy contributions made by key secondary structure elements to evaluate critical regions for G protein activation. In addition we have modeled all three signaling states to evaluate changes in residue pair contributions during signaling.

    4.1. GDP- vs GTP-bound models

    From this analysis, we have highlighted the similarity of the Gαi1 GDP- versus GTP-bound structures. By excising specific structural elements, a broad map of protein stability can be painted. Regions important for interfacing with other proteins, such as the α5 helix and the Switch II domain show the most altered energy changes between these two states (Figure 4,Supplemental Table 2,6). This is expected as the binding partners contribute to the relative energy of the system and inhibit interface flexibility. Regions not involved in protein-protein interactions or large structural rearrangements, such as the αA helix (Supplemental Table 8), remain more energetically stable and consistent across the different models in the GDP and GTP-bound Gα subunit. This result is in agreement with other structural studies that suggest the helical domain moves as a rigid body throughout G protein activation [4,10,21,27].

    4.2. Receptor-induced activation

    The ΔΔG calculations serve to highlight the role of key secondary structure elements as well as specific non-structured linker regions in G protein activation via receptor coupling, R*-Gαi1(empty)βγ. During this structural transition state in which Gα must undergo a dynamic conformational change, the ΔΔG analysis shows a shift in interaction partners for the α1 helix, α5 helix, and P-loop (Figures 3-4,Supplemental Tables 1-2,4). This conformation must therefore propagate from the receptor to the helical domain of the Gα subunit in order to disrupt binding of GDP. Each of these elements has been implicated in the mechanism of nucleotide escape and G protein activation [22,24,25,28]. From this analysis alone, however, no direct conclusions could be made on the order or dynamics of conformational propagation across the subunit.

    4.3. Residue-Residue changes within the network

    To better address this, a more detailed analysis of the structural differences was performed. The informational network mapping through the per-residue pairwise analysis highlighted subtle changes in G protein side chains induced by the γ phosphate group of the nucleotide. These altered interaction scores are indicative of altered structures which may prove to be important for interaction with downstream signaling and regulator moieties. However, we do not predict that all changes seen between these two states contribute to effector selectivity and interaction, as some of the altered network must be involved in maintaining the stability of the new structure without contributing to function.

    Our pairwise analysis provides insight into possible routes of this information flow from the receptor to the nucleotide binding pocket. Through examination of the α1 helix, the α5 helix, and the P-loop, extreme displacement of the interaction pairs predicts the importance of these structural elements in allowing nucleotide exchange and G protein activation (Figures 6-7,Supplemental Figure 6). To further test and validate these predictions, additional experiments must be performed to further elucidate the mechanism of G protein activation.

    From these analyses, we have created full, downloadable interaction matrices of our results to provide further understanding of G protein structure and modulation (Supplemental Material). By including pairwise score information across several signaling states, we hope this data will prompt new and unique questions on G protein activation and its signaling mechanics through investigation of these interactive communication maps. The values represent averaged relative interaction scores within these protein complexes as derived from comparative modeling based on published crystal structures. Future studies will be required to investigate the true predictive power of these results in vitro.

    4.4. Method development

    The use of ΔΔG calculations in evaluating protein-protein interfaces has long been an important application within ROSETTA [9,16,17,26]. We utilized this analysis not only for evaluating changes along known protein-protein interfaces, but also along key secondary structure elements thought to be important for propagating conformational changes across the protein subunit or necessary for stability. By mapping the ΔΔG of critical structures across multiple models, we were able to compare relative energy contributions as described by the ROSETTA score function for multiple structural snapshots.

    One of the primary purposes for the creation of these energy calculations was to apply and validate a new method of interaction analysis available in the ROSETTA modeling software suite. Here we introduce a new methodology for evaluating the communication networks underlying three dimensional protein topology. By evaluating the residue-residue contributions to protein structure, we have created a technique to map interaction partners necessary for structural stability and conformation transmission. The ROSETTA score term for each contributing residue pair provides a roadmap for amino acid interactions necessary for both structure and function. This pairwise analysis also highlights key nodes of information flow when calculated across multiple protein structural states. The protocol utilized herein has been externally validated and made available for academic and public use with the ROSETTA software suite.

    5. Downloadable Communication Maps

    From these analyses, we have created downloadable interaction matrices available as supplementary material. They combine secondary structure stability with individual ROSETTA scores of interactions on a residue-residue level. This novel perspective has allowed us to begin to probe regionally specific interactions required for GPCR-G protein interaction, residues required to propagate intra-domain conformational changes, and stabilize the basal, receptor-bound, and activated Gα states. The download also possesses general features about the regional selection such as secondary structure elements, relative evolutionary conservation, amino acid composition etc. as specific to the Gαi1 subunit sequence.

    Acknowledgements

    The authors would like to thank Dr. Rocco Moretti for creating the residue_energy_breakdown application within ROSETTA as well as Dr. Ali Kaya for reviewing the manuscript and for helpful discussion.

    Funding for this work was provided by the NIH (R01 EY006062, R01 GM080403, R01 GM099842, R01 DK097376, R01 HL122010, R01 GM073151, U19 AI117905) and NSF (CHE 1305874).

    Conflicts of Interests

    All authors declare no conflicts of interest in this manuscript.

    Author Contributions

    AL performed the analyses, wrote the manuscript, created models for the signaling states, and wrote some of the scripts needed for analysis. JLK edited the manuscript, wrote some of the scripts needed for analysis, and validated the Protocol Capture. KK wrote some of the scripts needed for analysis. NA created models for the signaling states and wrote some of the scripts needed for analysis. HH edited the manuscript and provided insight and discussion. JM planned the research, edited the manuscript, and provided guidance in protocol development.

    [1] Gibbs GM, Roelants K, O'Bryan MK (2008) The CAP superfamily: cysteine-rich secretory proteins, antigen 5, and pathogenesis-related 1 proteins--roles in reproduction, cancer, and immune defense. Endocr Rev 29: 865–897.
    [2] Gibbs GM, O'Bryan MK (2007) Cysteine rich secretory proteins in reproduction and venom. Soc Reprod Fertil Suppl 65: 261–267.
    [3] Yamazaki Y, Morita T (2004) Structure and function of snake venom cysteine-rich secretory proteins. Toxicon 44: 227–231.
    [4] Choudhary V, Schneiter R (2012) Pathogen-Related Yeast (PRY) proteins and members of the CAP superfamily are secreted sterol-binding proteins. Proc Natl Acad Sci USA 109: 16882–16887.
    [5] Xu X, Francischetti IM, Lai R, et al. (2012) Structure of protein having inhibitory disintegrin and leukotriene scavenging functions contained in single domain. J Biol Chem 287: 10967–10976.
    [6] Kelleher A, Darwiche R, Rezende WC, et al. (2014) Schistosoma mansoni venom allergen-like protein 4 (SmVAL4) is a novel lipid-binding SCP/TAPS protein that lacks the prototypical CAP motifs. Acta Crystallogr D Biol Crystallogr 70: 2186–2196.
    [7] Milne TJ, Abbenante G, Tyndall JD, et al. (2003) Isolation and characterization of a cone snail protease with homology to CRISP proteins of the pathogenesis-related protein superfamily. J Biol Chem 278: 31105–31110.
    [8] Eberle HB, Serrano RL, Fullekrug J, et al. (2002) Identification and characterization of a novel human plant pathogenesis-related protein that localizes to lipid-enriched microdomains in the Golgi complex. J Cell Sci 115: 827–838.
    [9] Serrano RL, Kuhn A, Hendricks A, et al. (2004) Structural analysis of the human Golgi-associated plant pathogenesis related protein GAPR-1 implicates dimerization as a regulatory mechanism. J Mol Biol 339: 173–183.
    [10] Shoji-Kawata S, Sumpter R, Leveno M, et al. (2013) Identification of a candidate therapeutic autophagy-inducing peptide. Nature 494: 201–206.
    [11] Kuballa P, Nolte WM, Castoreno AB, et al. (2012) Autophagy and the immune system. Annu Rev Immunol 30: 611–646.
    [12] Eberle HB, Serrano RL, Fullekrug J, et al. (2002) Identification and characterization of a novel human plant pathogenesis-related protein that localizes to lipid-enriched microdomains in the Golgi complex. J Cell Sci 115: 827–838.
    [13] Zhou Q, Hao L, Huang W, et al. (2016) The Golgi-Associated Plant Pathogenesis-Related Protein GAPR-1 Enhances Type I Interferon Signaling Pathway in Response to Toll-Like Receptor 4. Inflammation 39: 706–717.
    [14] Baxter RM, Crowell TP, George JA, et al. (2007) The plant pathogenesis related protein GLIPR-2 is highly expressed in fibrotic kidney and promotes epithelial to mesenchymal transition in vitro. Matrix Biol 26: 20–29.
    [15] Aalberts M, van Dissel-Emiliani FM, van Adrichem NP, et al. (2012) Identification of distinct populations of prostasomes that differentially express prostate stem cell antigen, annexin A1, and GLIPR2 in humans. Biol Reprod 86: 82:1–8.
    [16] Van Galen J, Van Balkom BW, Serrano RL, et al. (2010) Binding of GAPR-1 to negatively charged phospholipid membranes: unusual binding characteristics to phosphatidylinositol. Mol Membr Biol 27: 81–91.
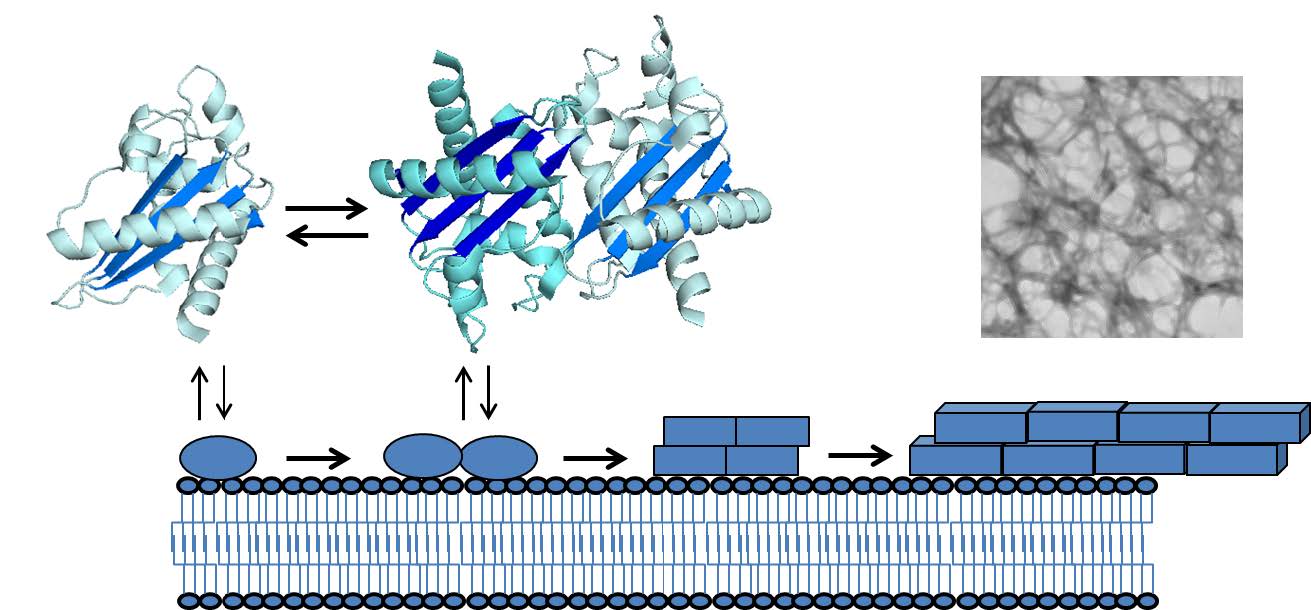
    [17] van Galen J, Olrichs NK, Schouten A, et al. (2012) Interaction of GAPR-1 with lipid bilayers is regulated by alternative homodimerization. Biochim Biophys Acta 1818: 2175–2183.
    [18] Olrichs NK, Mahalka AK, Kaloyanova D, et al. (2014) Golgi-Associated plant Pathogenesis Related protein 1 (GAPR-1) forms amyloid-like fibrils by interaction with acidic phospholipids and inhibits Abeta aggregation. Amyloid 21: 88–96.
    [19] Yoshiike Y, Minai R, Matsuo Y, et al. (2008) Amyloid oligomer conformation in a group of natively folded proteins. PLoS One 3: e3235.
    [20] Schwarzman AL, Gregori L, Vitek MP, et al. (1994) Transthyretin sequesters amyloid beta protein and prevents amyloid formation. Proc Natl Acad Sci USA 91: 8368–8372.
    [21] Chen J, Yagi H, Sormanni P, et al. (2012) Fibrillogenic propensity of the GroEL apical domain: a Janus-faced minichaperone. FEBS Lett 586: 1120–1127.
    [22] Rekas A, Ahn KJ, Kim J, et al. (2012) The chaperone activity of alpha-synuclein: Utilizing deletion mutants to map its interaction with target proteins. Proteins 80: 1316–1325.
    [23] Ofengeim D, Ito Y, Najafov A, et al. (2015) Activation of necroptosis in multiple sclerosis. Cell Rep 10: 1836–1849.
    [24] Zhang L, Qu S, Liang A, et al. (2015) Gene expression microarray analysis of the sciatic nerve of mice with diabetic neuropathy. Int J Mol Med 35: 333–339.
    [25] Karlsson O, Berg AL, Hanrieder J, et al. (2015) Intracellular fibril formation, calcification, and enrichment of chaperones, cytoskeletal, and intermediate filament proteins in the adult hippocampus CA1 following neonatal exposure to the nonprotein amino acid BMAA. Arch Toxicol 89: 423–436.
    [26] Nishi H, Hashimoto K, Madej T, et al. (2013) Evolutionary, physicochemical, and functional mechanisms of protein homooligomerization. Prog Mol Biol Transl Sci 117: 3–24.
    [27] Marianayagam NJ, Sunde M, Matthews JM (2004) The power of two: protein dimerization in biology. Trends Biochem Sci 29: 618–625.
    [28] Ali MH, Imperiali B (2005) Protein oligomerization: how and why. Bioorg Med Chem 13: 5013–5020.
    [29] Wang X, Sharp JS, Handel TM, et al. (2013) Chemokine oligomerization in cell signaling and migration. Prog Mol Biol Transl Sci 117: 531–578.
    [30] Zimmerberg J, Kozlov MM (2006) How proteins produce cellular membrane curvature. Nat Rev Mol Cell Biol 7: 9–19.
    [31] Park PS, Filipek S, Wells JW, et al. (2004) Oligomerization of G protein-coupled receptors: past, present, and future. Biochemistry 43: 15643–15656.
    [32] Adi-Harel S, Erlich S, Schmukler E, et al. (2010) Beclin 1 self-association is independent of autophagy induction by amino acid deprivation and rapamycin treatment. J Cell Biochem 110: 1262–1271.
    [33] Ku B, Woo JS, Liang C, et al. (2008) An insight into the mechanistic role of Beclin 1 and its inhibition by prosurvival Bcl-2 family proteins. Autophagy 4: 519–520.
    [34] Chiti F, Dobson CM (2006) Protein misfolding, functional amyloid, and human disease. Annu Rev Biochem 75: 333–366.
    [35] Dobson CM (2003) Protein folding and misfolding. Nature 426: 884–890.
    [36] Iannuzzi C, Irace G, Sirangelo I (2015) The effect of glycosaminoglycans (GAGs) on amyloid aggregation and toxicity. Molecules 20: 2510–2528.
    [37] Oskarsson ME, Singh K, Wang J, et al. (2015) Heparan Sulfate Proteoglycans Are Important for Islet Amyloid Formation and Islet Amyloid Polypeptide-induced Apoptosis. J Biol Chem 290: 15121–15132.
    [38] Kinnunen PK (2009) Amyloid Formation on Lipid Membrane Surfaces. The Open Biology Journal 2: 163–175.
    [39] Burke KA, Yates EA, Legleiter J (2013) Biophysical insights into how surfaces, including lipid membranes, modulate protein aggregation related to neurodegeneration. Front Neurol 4: 17.
    [40] Sunde M, Serpell LC, Bartlam M, et al. (1997) Common core structure of amyloid fibrils by synchrotron X-ray diffraction. J Mol Biol 273: 729–739.
    [41] Glabe CG (2008) Structural classification of toxic amyloid oligomers. J Biol Chem 283: 29639–29643.
    [42] Kayed R, Lasagna-Reeves CA (2013) Molecular mechanisms of amyloid oligomers toxicity. J Alzheimers Dis 33 Suppl 1: S67–78.
    [43] Breydo L, Uversky VN (2015) Structural, morphological, and functional diversity of amyloid oligomers. FEBS Lett 589: 2640–2648.
    [44] Haass C, Selkoe DJ (2007) Soluble protein oligomers in neurodegeneration: lessons from the Alzheimer's amyloid beta-peptide. Nat Rev Mol Cell Biol 8: 101–112.
    [45] Kagan BL, Jang H, Capone R, et al. (2012) Antimicrobial properties of amyloid peptides. Mol Pharm 9: 708–717.
    [46] Greenwald J, Riek R (2012) On the possible amyloid origin of protein folds. J Mol Biol 421: 417–426.
    [47] Gsponer J, Babu MM (2012) Cellular strategies for regulating functional and nonfunctional protein aggregation. Cell Rep 2: 1425–1437.
    [48] Fowler DM, Koulov AV, Balch WE, et al. (2007) Functional amyloid--from bacteria to humans. Trends Biochem Sci 32: 217–224.
    [49] Maji SK, Perrin MH, Sawaya MR, et al. (2009) Functional amyloids as natural storage of peptide hormones in pituitary secretory granules. Science 325: 328–332.
    [50] Puzzo D, Arancio O (2013) Amyloid-beta peptide: Dr. Jekyll or Mr. Hyde? J Alzheimers Dis 33 Suppl 1: S111–20.
    [51] Hervas R, Li L, Majumdar A, et al. (2016) Molecular Basis of Orb2 Amyloidogenesis and Blockade of Memory Consolidation. PLoS Biol 14: e1002361.
    [52] Jacob RS, George E, Singh PK, et al. (2016) Cell Adhesion on Amyloid Fibrils Lacking Integrin Recognition Motif. J Biol Chem .
    [53] Halfmann R, Jarosz DF, Jones SK, et al. (2012) Prions are a common mechanism for phenotypic inheritance in wild yeasts. Nature 482: 363–368.
    [54] Li J, McQuade T, Siemer AB, et al. (2012) The RIP1/RIP3 necrosome forms a functional amyloid signaling complex required for programmed necrosis. Cell 150: 339–350.
    [55] Parry TL, Melehani JH, Ranek MJ, et al. (2015) Functional Amyloid Signaling via the Inflammasome, Necrosome, and Signalosome: New Therapeutic Targets in Heart Failure. Front Cardiovasc Med 2: 25.
    [56] Rapsinski GJ, Wynosky-Dolfi MA, Oppong GO, et al. (2015) Toll-like receptor 2 and NLRP3 cooperate to recognize a functional bacterial amyloid, curli. Infect Immun 83: 693–701.
    [57] Heneka MT, Kummer MP, Latz E (2014) Innate immune activation in neurodegenerative disease. Nat Rev Immunol 14: 463–477.
    [58] Maldera JA, Vasen G, Ernesto JI, et al. (2011) Evidence for the involvement of zinc in the association of CRISP1 with rat sperm during epididymal maturation. Biol Reprod 85: 503–510.
    [59] Lu S, Faris JD, Sherwood R, et al. (2014) A dimeric PR-1-type pathogenesis-related protein interacts with ToxA and potentially mediates ToxA-induced necrosis in sensitive wheat. Mol Plant Pathol 15: 650–663.
    [60] Borloo J, Geldhof P, Peelaers I, et al. (2013) Structure of Ostertagia ostertagi ASP-1: insights into disulfide-mediated cyclization and dimerization. Acta Crystallogr D Biol Crystallogr 69: 493–503.
    [61] Prados-Rosales RC, Roldan-Rodriguez R, Serena C, et al. (2012) A PR-1-like protein of Fusarium oxysporum functions in virulence on mammalian hosts. J Biol Chem 287: 21970–21979.
    [62] Sugiyama H, Burnett L, Xiang X, et al. (2009) Purification and multimer formation of allurin, a sperm chemoattractant from Xenopus laevis egg jelly. Mol Reprod Dev 76: 527–536.
    [63] Asojo OA, Goud G, Dhar K, et al. (2005) X-ray structure of Na-ASP-2, a pathogenesis-related-1 protein from the nematode parasite, Necator americanus, and a vaccine antigen for human hookworm infection. J Mol Biol 346: 801–814.
    [64] Ma D, Francischetti IM, Ribeiro JM, et al. (2015) The structure of hookworm platelet inhibitor (HPI), a CAP superfamily member from Ancylostoma caninum. Acta Crystallogr F Struct Biol Commun 71: 643–649.
    [65] Tsolis AC, Papandreou NC, Iconomidou VA, et al. (2013) A consensus method for the prediction of 'aggregation-prone' peptides in globular proteins. PLoS One 8: e54175.
    [66] Egge N, Muthusubramanian A, Cornwall GA (2015) Amyloid properties of the mouse egg zona pellucida. PLoS One 10: e0129907.
    [67] Guyonnet B, Egge N, Cornwall GA (2014) Functional amyloids in the mouse sperm acrosome. Mol Cell Biol 34: 2624–2634.
    [68] Swanson WJ, Aagaard JE, Vacquier VD, et al. (2011) The molecular basis of sex: linking yeast to human. Mol Biol Evol 28: 1963–1966.
    [69] Garcia MC, Lee JT, Ramsook CB, et al. (2011) A role for amyloid in cell aggregation and biofilm formation. PLoS One 6: e17632.
    [70] Da Ros VG, Munoz MW, Battistone MA, et al. (2015) From the epididymis to the egg: participation of CRISP proteins in mammalian fertilization. Asian J Androl 17: 711–715.
    [71] Caballero J, Frenette G, D'Amours O, et al. (2012) Bovine sperm raft membrane associated Glioma Pathogenesis-Related 1-like protein 1 (GliPr1L1) is modified during the epididymal transit and is potentially involved in sperm binding to the zona pellucida. J Cell Physiol 227: 3876–3886.
    [72] Busso D, Goldweic NM, Hayashi M, et al. (2007) Evidence for the involvement of testicular protein CRISP2 in mouse sperm-egg fusion. Biol Reprod 76: 701–708.
    [73] Doty A, Buhi WC, Benson S, et al. (2011) Equine CRISP3 modulates interaction between spermatozoa and polymorphonuclear neutrophils. Biol Reprod 85: 157–164.
    [74] Ernesto JI, Weigel Munoz M, Battistone MA, et al. (2015) CRISP1 as a novel CatSper regulator that modulates sperm motility and orientation during fertilization. J Cell Biol 210: 1213–1224.
    [75] Burnett LA, Xiang X, Bieber AL, et al. (2008) Crisp proteins and sperm chemotaxis: discovery in amphibians and explorations in mammals. Int J Dev Biol 52: 489–501.
    [76] Burnett LA, Anderson DM, Rawls A, et al. (2011) Mouse sperm exhibit chemotaxis to allurin, a truncated member of the cysteine-rich secretory protein family. Dev Biol 360: 318–328.
    [77] Usmani SM, Zirafi O, Muller JA, et al. (2014) Direct visualization of HIV-enhancing endogenous amyloid fibrils in human semen. Nat Commun 5: 3508.
    [78] Castellano LM, Shorter J (2012) The Surprising Role of Amyloid Fibrils in HIV Infection. Biology (Basel) 1: 58–80.
    [79] Doncel GF (2006) Exploiting common targets in human fertilization and HIV infection: development of novel contraceptive microbicides. Hum Reprod Update 12: 103–117.
    [80] Gebbink MF, Claessen D, Bouma B, et al. (2005) Amyloids--a functional coat for microorganisms. Nat Rev Microbiol 3: 333–341.
    [81] Garcia-Sherman MC, Lundberg T, Sobonya RE, et al. (2015) A unique biofilm in human deep mycoses: fungal amyloid is bound by host serum amyloid P component. NPJ Biofilms Microbiomes 1: 15009.
    [82] Syed AK, Boles BR (2014) Fold modulating function: bacterial toxins to functional amyloids. Front Microbiol 5: 401.
    [83] Pisa D, Alonso R, Rabano A, et al. (2015) Different Brain Regions are Infected with Fungi in Alzheimer's Disease. Sci Rep 5: 15015.
    [84] Oh J, Kim JG, Jeon E, et al. (2007) Amyloidogenesis of type III-dependent harpins from plant pathogenic bacteria. J Biol Chem 282: 13601–13609.
    [85] van Loon LC, Rep M, Pieterse CM (2006) Significance of inducible defense-related proteins in infected plants. Annu Rev Phytopathol 44: 135–162.
    [86] Van Loon LC, Van Strien EA (1999) The families of pathogenesis-related proteins, their activities, and comparative analysis of PR-1 type proteins. Physiol Mol Plant Pathol 55: 85–97.
    [87] Niderman T, Genetet I, Bruyere T, et al. (1995) Pathogenesis-related PR-1 proteins are antifungal. Isolation and characterization of three 14-kilodalton proteins of tomato and of a basic PR-1 of tobacco with inhibitory activity against Phytophthora infestans. Plant Physiol 108: 17–27.
    [88] Rauscher M, Adam AL, Wirtz S, et al. (1999) PR-1 protein inhibits the differentiation of rust infection hyphae in leaves of acquired resistant broad bean. Plant J 19: 625–633.
    [89] Benhamou N (1995) Immunocytochemistry of plant defense mechanisms induced upon microbial attack. Microsc Res Tech 31: 63–78.
    [90] Lee YK, Hippe-Sanwald S, Lee SC, et al. (2000) In situ localization of PR-1 mRNA and PR-1 protein in compatible and incompatible interactions of pepper stems with Phytophthora capsici. Protoplasma 211: 64–75.
    [91] Santén K, Marttila S, Liljeroth E, et al. (2005) Immunocytochemical localization of the pathogenesis-related PR-1 protein in barley leaves after infection by Bipolaris sorokiniana. Physiol Mol Plant Pathol 66: 45–54.
    [92] Teixeira PJ, Costa GG, Fiorin GL, et al. (2013) Novel receptor-like kinases in cacao contain PR-1 extracellular domains. Mol Plant Pathol 14: 602–609.
    [93] Jiang G, Hunter T (1999) Receptor signaling: when dimerization is not enough. Curr Biol 9: R568–71.
    [94] Chen YL, Lee CY, Cheng KT, et al. (2014) Quantitative peptidomics study reveals that a wound-induced peptide from PR-1 regulates immune signaling in tomato. Plant Cell 26: 4135–4148.
    [95] Chien PS, Nam HG, Chen YR (2015) A salt-regulated peptide derived from the CAP superfamily protein negatively regulates salt-stress tolerance in Arabidopsis. J Exp Bot 66: 5301–5313.
    [96] Buch F, Pauchet Y, Rott M, et al. (2014) Characterization and heterologous expression of a PR-1 protein from traps of the carnivorous plant Nepenthes mirabilis. Phytochemistry 100: 43–50.
    [97] Osman A, Wang CK, Winter A, et al. (2012) Hookworm SCP/TAPS protein structure--A key to understanding host-parasite interactions and developing new interventions. Biotechnol Adv 30: 652–657.
    [98] Moyle M, Foster DL, McGrath DE, et al. (1994) A hookworm glycoprotein that inhibits neutrophil function is a ligand of the integrin CD11b/CD18. J Biol Chem 269: 10008–10015.
    [99] Asojo OA (2011) Structure of a two-CAP-domain protein from the human hookworm parasite Necator americanus. Acta Crystallogr D Biol Crystallogr 67: 455–462.
    [100] Del Valle A, Jones BF, Harrison LM, et al. (2003) Isolation and molecular cloning of a secreted hookworm platelet inhibitor from adult Ancylostoma caninum. Mol Biochem Parasitol 129: 167–177.
    [101] Horn M, Bertling A, Brodde MF, et al. (2012) Human neutrophil alpha-defensins induce formation of fibrinogen and thrombospondin-1 amyloid-like structures and activate platelets via glycoprotein IIb/IIIa. J Thromb Haemost 10: 647–661.
    [102] Canobbio I, Abubaker AA, Visconte C, et al. (2015) Role of amyloid peptides in vascular dysfunction and platelet dysregulation in Alzheimer's disease. Front Cell Neurosci 9: 65.
    [103] Wang YL, Kuo JH, Lee SC, et al. (2010) Cobra CRISP functions as an inflammatory modulator via a novel Zn2+- and heparan sulfate-dependent transcriptional regulation of endothelial cell adhesion molecules. J Biol Chem 285: 37872–37883.
    [104] Alexandrescu AT (2005) Amyloid accomplices and enforcers. Protein Sci 14: 1–12.
    [105] Hughes AJ, Hussain R, Cosentino C, et al. (2012) A zinc complex of heparan sulfate destabilises lysozyme and alters its conformation. Biochem Biophys Res Commun 425: 794–799.
    [106] Berthelot K, Lecomte S, Coulary-Salin B, et al. (2016) Hevea brasiliensis prohevein possesses a conserved C-terminal domain with amyloid-like properties in vitro. Biochim Biophys Acta 1864: 388–399.
    [107] Lay FT, Mills GD, Poon IK, et al. (2012) Dimerization of plant defensin NaD1 enhances its antifungal activity. J Biol Chem 287: 19961–19972.
    [108] Poon IK, Baxter AA, Lay FT, et al. (2014) Phosphoinositide-mediated oligomerization of a defensin induces cell lysis. Elife 3: e01808.
    [109] Garvey M, Meehan S, Gras SL, et al. (2013) A radish seed antifungal peptide with a high amyloid fibril-forming propensity. Biochim Biophys Acta 1834: 1615–1623.
    [110] Marangon M, Van Sluyter SC, Waters EJ, et al. (2014) Structure of haze forming proteins in white wines: Vitis vinifera thaumatin-like proteins. PLoS One 9: e113757.
    [111] Yu XM, Griffith M (1999) Antifreeze proteins in winter rye leaves form oligomeric complexes. Plant Physiol 119: 1361–1370.
  • This article has been cited by:

    1. Ali I. Kaya, Alyssa D. Lokits, James A. Gilbert, T.M. Iverson, Jens Meiler, Heidi E. Hamm, A Conserved Hydrophobic Core in Gαi1 Regulates G Protein Activation and Release from Activated Receptor, 2016, 291, 00219258, 19674, 10.1074/jbc.M116.745513
  • Reader Comments
  • © 2016 the Author(s), licensee AIMS Press. This is an open access article distributed under the terms of the Creative Commons Attribution License (http://creativecommons.org/licenses/by/4.0)
通讯作者: 陈斌, bchen63@163.com
  • 1. 

    沈阳化工大学材料科学与工程学院 沈阳 110142

  1. 本站搜索
  2. 百度学术搜索
  3. 万方数据库搜索
  4. CNKI搜索

Metrics

Article views(7416) PDF downloads(1523) Cited by(13)

Article outline

Figures and Tables

Figures(2)

Other Articles By Authors

/

DownLoad:  Full-Size Img  PowerPoint
Return
Return

Catalog