


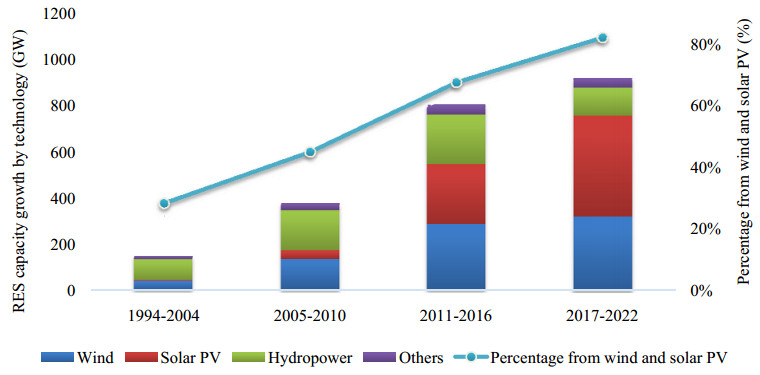
Figure 1.
Renewable electricity capacity growth by technology worldwide.
Citation: Géremi Gilson Dranka, Jorge Cunha, José Donizetti de Lima, Paula Ferreira. Economic evaluation methodologies for renewable energy projects[J]. AIMS Energy, 2020, 8(2): 339-364. doi: 10.3934/energy.2020.2.339
| [1] | Abdolmajid Erfani, Mehdi Tavakolan, Ali Hassandokht Mashhadi, Pouria Mohammadi . Heterogeneous or homogeneous? A modified decision-making approach in renewable energy investment projects. AIMS Energy, 2021, 9(3): 558-580. doi: 10.3934/energy.2021027 |
| [2] | Nadejda Komendantova, Masoud Yazdanpanah, Roshanak Shafiei . Studying young people’ views on deployment of renewable energy sources in Iran through the lenses of Social Cognitive Theory. AIMS Energy, 2018, 6(2): 216-228. doi: 10.3934/energy.2018.2.216 |
| [3] | Marmelia P. Dewi, Andri D. Setiawan, Yusuf Latief, Widodo Wahyu Purwanto . Investment decisions under uncertainties in geothermal power generation. AIMS Energy, 2022, 10(4): 844-857. doi: 10.3934/energy.2022038 |
| [4] | Samuel Asumadu-Sarkodie, Phebe Asantewaa Owusu . A review of Ghana’s solar energy potential. AIMS Energy, 2016, 4(5): 675-696. doi: 10.3934/energy.2016.5.675 |
| [5] | Pugazenthi D, Gopal K Sarangi, Arabinda Mishra, Subhes C Bhattacharyya . Replication and scaling-up of isolated mini-grid type of off-grid interventions in India. AIMS Energy, 2016, 4(2): 222-255. doi: 10.3934/energy.2016.2.222 |
| [6] | Surender Reddy Salkuti . Sustainable energy technologies for emerging renewable energy and electric vehicles. AIMS Energy, 2024, 12(6): 1264-1270. doi: 10.3934/energy.2024057 |
| [7] | Emmanuel Arthur . Energy development: A global perspective and advances in Ghana. AIMS Energy, 2022, 10(2): 306-339. doi: 10.3934/energy.2022017 |
| [8] | Ladislas Mutunda Kangaji, Atanda Raji, Efe Orumwense . Cutting-edge progress in offshore wind and tidal stream power technology—State-of-the-Art. AIMS Energy, 2025, 13(1): 188-230. doi: 10.3934/energy.2025007 |
| [9] | Jin H. Jo, Jamie Cross, Zachary Rose, Evan Daebel, Andrew Verderber, David G. Loomis . Financing options and economic impact: distributed generation using solar photovoltaic systems in Normal, Illinois. AIMS Energy, 2016, 4(3): 504-516. doi: 10.3934/energy.2016.3.504 |
| [10] | Kareem Othman, Rana Khallaf . Analyzing the factors that affect the renewable energy PPP market: A comparative analysis between developing and developed countries. AIMS Energy, 2024, 12(2): 505-531. doi: 10.3934/energy.2024024 |
Abbreviations: ROIA: Additional Return on Investment; ANPV: Annualized Net Present Value; BCR: Benefit-Cost Ratio; CMIA: Classical Methodologies of Investment Analysis; MRE: Energy Reallocation Mechanism; EMIM: Extended Multi-Index Methodology; IRR: Internal Rate of Return; IP: Investment Projects; LCOE: Levelized Cost of Electricity; LCA: Life Cycle Assessment; MIRR: Modified Internal Rate of Return; MIM: Multi-Index Methodology; NPV: Net Present Value; PV: Present Value; ROA: Real Options Analysis; RCE: Regulated Contracting Environment; REP: Renewable Energy Projects; RES: Renewable Energy Sources; ROI: Return On Investment; SHP: Small-scale Hydropower Plant
The growing interest in Renewable Energy Projects (REP) has become a reality over the last years worldwide mainly due to climate change concerns and sustainability aspects [1,2]. The investment in low-carbon energy, electricity networks and energy efficiency increased from 39% in 2014 to 45% in 2015 of the total energy investment worldwide [3]. Additionally, the renewable energy capacity has been growing rapidly over the past years in the power sector with a particularly high share from wind and solar photovoltaics (PV) systems [4,5]. Figure 1 illustrates the worldwide renewable power generation capacity growth by technology over the last two decades and the projections for the next couple of years revealing that there has been a marked increase in the number of renewable energy systems worldwide [5].
On the other side, there have been several challenges concerning the decisions and timing of new investments in the power electricity generation sector due to the uncertain environment of this segment, such as the volatility of electricity prices and the variable and intermittency nature of Renewable Energy Sources (RES) [6,7,8]. The technical impacts of REP on power grids have been extensively addressed [9,10,11,12] over the literature. The authors of [13], for instance, evaluated the cost-effectiveness of energy efficiency investments for high renewable electricity systems with a particular focus on the case of Brazil. Nevertheless, less attention has been paid to the economic evaluation of renewable energy Investment Projects (IP). Also, it is well-known that renewable energy investments require high up-front capital costs [14]. Renewable energy investors, for example, should select among a set of alternatives the ones with the best return for a given level of risk [15,16]. However, considering the high number of dimensions to be considered in the decision-making process, this selection is not an easy task [17]. In addition to the risk and return dimensions, the authors of [15] identified the policy dimension as an important driver in the decision-making process of renewable energy investments. Policy and regulatory aspects were identified as the main risks concerning renewable energy investments in [18]. Furthermore, 'renewable energy projects are subject to different types of risk throughout their life-cycle, from the planning stage right through to decommissioning, each of which require active management in order to attract financing [19]'. In this context, the authors of [20] assessed the importance of project finance for renewable energy projects. A risk analysis using a double-criteria analysis method is undertaken in [21] for decentralized renewable energy projects. Therefore, it is clear that advanced risk management tools are required to support renewable energy investments [21].
The use of traditional methods such as the Levelized Cost of Electricity (LCOE) to guide the decision-making process is addressed in [22] but the authors draw attention to the fact that levelized cost measures consider the economic variables as unchangeable at the time the investment decision is made. A renewable energy investment risk evaluation model was proposed by [23] considering three main risk categories: policy, market and technology risk. The trade-off between risk and return for REP was modelled in [24] considering the time-varying characteristic of risk. The framework proposed by [25] employed the following classical economic indicators: simple Payback period, discounted Payback period, NPV and the LCOE. The authors of [26] emphasize the use of NPV and Internal Rate of Return (IRR) as two conventional investment appraisal tools widely disseminated in the literature but also point out the drawbacks associated with the traditional IRR calculation. According to [26], projects with alternating periods of positive and negative cash flow should consider the use of the Modified Internal Rate of Return (MIRR) instead of the traditional IRR. A framework to support the decision-making process in renewable energy investments was developed by the authors of [17] considering twenty-three criteria divided into technical, economic, environmental and social dimensions. The future analysis (2050) for the Brazilian power sector is discussed in [11] in which renewable scenarios are compared for technical, cost and risk dimensions. This last study also carried out the economic assessment of REP using the LCOE. In [27] the authors demonstrated how the uncertainties in input data parameters affect the LCOE for renewable and non-renewable energy investments.
Given the aforementioned background, it is possible to infer that literature has extensively addressed the evaluation of REPs considering the CMIA. One of the most significant current discussions in the energy field gives rise to the need for new methodologies to evaluate REP in order to account for the high level of risk and uncertainties that have been posed to the sector mainly in the last years [21]. The Multi-Index Methodology (MIM) [28] comes out extending the classical indicators used in the CMIA. The MIM can be split up into two main categories (ⅰ) return and (ⅱ) risk indicators. The first set of indicators (i.e., return) includes the Net Present Value (NPV), NPV Annualized (NPVA), Benefit-Cost Ratio (BCR), Annualized Return on Investment (ROIA), index ROIA/MRA and Return on Investment (ROI) [28]. The second category includes a set of risk indicators, which are measured from a zero-scale (absence of risk) to one (maximum risk) and are composed by the IRR, Payback, index MRA/IRR, index Payback/N, Management Risk (MR), Business Risk (BR), Degree of Revenue Spent (DRS) and Fisher Point [28,29,30,31]. Recently, the Extended Multi-Index Methodology (EMIM) [29,30] expanded the MIM by including a new set of indexes to perform a (ⅲ) Sensitivity Analysis (SA) over the main parameters that affect the economic viability of the IP. This new set of indicators aims to increase the perception and better evaluate the dimension of risk associated with the IP. The detailed description of each indicator will be further described (Table 1). However, although the variety of existing methodologies to evaluate investment projects such as the CMIA, MIM and EMIM; to the best of authors' knowledge, the following research question is not yet fully addressed by available literature and it was established to provide a clearer goal of the paper: How to choose the most suitable methodology to evaluate renewable energy investments?
Therefore, the work proposed in this paper contributes to a better understanding of the usefulness of different methodologies concerning the economic evaluation of REP. These methodologies are grouped into four categories: ⅰ) Classical Methodologies of Investment Analysis (CMIA), ⅱ) Multi-Index Methodology (MIM), ⅲ) Extended Multi-Index Methodology (EMIM), and ⅳ) Real Options Analysis (ROA). To the best of the authors' knowledge, this analysis can be considered a novel approach since this comparison has not yet been performed in the literature. In addition to the analysis of the complementarity among different economic evaluation methodologies for decision making regarding REP, this paper proposes a comprehensive framework to help decision-makers and companies in identifying the most suitable methodology for investment appraisal. This framework is mainly supported by the volatility analysis of a set of variables inherent to the decision-making process, allowing then to combine risk and return for the economic evaluation of the REP.
The remainder of the paper is organized as follows. Section 2 establishes the context, background and the importance of the economic evaluation methodologies for REP. Section 3 presents the proposed framework for choosing a suitable methodology for conducting economic analysis in REP. The description of the case study along with the basic data used are also introduced in Section 3. Section 4 presents the project evaluation applying the proposed framework considering the use of the CMIA, MIM, EMIM and ROA. Finally, Section 5 draws the main conclusions of the paper and outlines the possible avenues for further research.
Renewable energy projects are often among the riskiest types of projects to invest and managers face different uncertainties when making a renewable energy decision investment. Several methodologies are available to evaluate investments in energy generation projects [32]. The most commonly used methodology to evaluate investments is the NPV, which can be considered a CMIA [33]. Considering the high capital expenditure associated with REP; recent changes in the regulatory structure; management flexibility and irreversibility of the electricity sector; the use of CMIA may lead to an oversimplified economic project evaluation [32,34]. Additionally, due to its inflexible nature, classical methodologies are becoming increasingly unpopular [33]. In this sense, new evaluation methodologies appear as a complement to evaluate investments, e.g., multi-index methodologies, portfolio theory [35], Life Cycle Assessment (LCA) and the use of the ROA. Specifically for REP, ROA is considered in the literature a more suitable tool for assessing investments with management flexibility [34].
However, there are relatively few works in the literature addressing the use of Real Options Analysis (ROA) to evaluate REP such as in [32,34,36,37], just to name a few. In [34] the authors compare the traditional NPV methodology with the ROA approach using a hydroelectric power plant as the case study. The work proposed by [34] presented an advanced ROA methodology that considers flexible design and timing simultaneously. In order to assess renewable energy investments, the use of traditional indicators is compared to the use of ROA in [32]. Nevertheless, in [32] only a few set of indicators, namely NPV, IRR, Return On Investment (ROI) and Benefit Cost Ratio (BCR) are considered in the economic evaluation of the REP. The authors highlight that ROA offers an advantage over traditional methodologies since it takes into consideration aspects such as irreversibility, uncertainty, and managerial flexibility. In [37], it is considered the use of ROA to evaluate both wind farms and Small Hydropower Plant (SHP) investments. The major differences between CMIA (e.g. NPV and IRR) and ROA were addressed in [38].
The authors of [39] also highlight the use of Cost-Benefit Analysis (CBA) for evaluating projects with external impacts. As stated by [39], the economic evaluation of projects should also be addressed in terms of risk and uncertainty. The risk assessment is usually incorporated into the analysis of the economic viability of IPs using the sensitivity analysis or the scenario analysis [29,40]. Risk analysis techniques such as the Monte Carlo Simulation (MCS) appear as a complementary tool for better evaluate investment decisions regarding REP, as shown for example in [40] and [41]. The MCS is widely-reported by literature as a powerful alternative to the risk estimation of an IP [40]. The use of the MCS to evaluate investments in small-scale PV systems is addressed in [40] in which the authors highlighted the advantages of the MCS over other traditional methodologies. A risk (using the MCS) and sensitivity analysis is considered in [41] to evaluate the economic profitability of a SHP investment.
Therefore, in the sense of REP investments, the different methodologies can be grouped into four main categories: CMIA, MIM, EMIM and ROA. The use of the CMIA is highlighted in Subsection 2.1. Subsection 2.2 will discuss the recent use of multi-index methodologies such as the MIM and the EMIM for evaluating investments. Subsection 2.3 will better discuss the use of ROA in the sense of economic evaluation of REP. Finally, Subsection 2.4 will present the indicators used for each methodology applied to the economic evaluation of IPs.
The literature has extensively explored the economic analysis of energy generation projects considering CMIA in which only a few set of indicators are taken into account, highlighting the Payback, NPV and IRR [29,31,42]. For this classical approach, for a positive NPV (NPV > 0) [43], IRR greater than the evaluating companies' required return on capital (IRR > MRA—Minimum Rate of Attractiveness) and Payback < N (where N represents the number of years considered in the remuneration period) will typically suggest the economic viability of the IP [26,44]. The definition and interpretation of each indicator of the CMIA are presented in Table 1.
However, the use of the CMIA and the related classical indicators may underestimate the investment analysis due to the existence of a degree of uncertainty and risk but also because of these methodologies are usually inflexible and based on a deterministic approach [29,45,46]. However, studies on capital budgeting practices show that companies still adopt these traditional practices, and risk analysis is still mainly dominated by sensitivity analysis (see for example [47,48,49]). A framework to guide companies on the selection of more complex methods, which explicitly integrate the risk dimension and ultimately lead companies to make more robust and consistent decisions, is still missing. Therefore, although the use of CMIA has been widely proposed and discussed in the literature, specialists have been criticizing the use of only these classical methodologies in project evaluation primarily because it neglects managerial flexibility and might lead to the project's undervaluation [28,34,45,50].
In order to better evaluate an IP, the authors of [28] proposed the Multi-Index Methodology (MIM) in which a new set of indicators (in addition to the NPV, payback and IRR proposed by the CMIA) are undertaken and divided into two main categories: return and risk. The MIM treats risk as a multidimensional component [51]. The main return indicators include NPV, NPV Annualized (NPVA), BCR, Annualized Return on Investment (ROIA), index ROIA/MRA, Return on Investment (ROI) and MIRR. Regarding the risk indicators, the MIM considers the use of the IRR, Payback, index MRA/IRR, index Payback/N, Management Risk (MR), Business Risk (BR), Degree of Revenue Spent (DRS) and Fisher Point [28,29,30,31]. The work proposed by [52] compared the CMIA with the MIM. The authors of [52] concluded that the MIM brings more transparency to the investment decision than simply using the CMIA. The definition and interpretation of each indicator of the MIM are also presented in Table 1.
Recently, supported by the literature, the works presented in [29] and [30] recommended a set of new indicators to expand the MIM. This new approach became known as Extended Multi-Index Methodology (EMIM) and considers indicators for the Sensitivity Analysis (SA) determining the maximum variation for each variable of the investment (costs, revenues and MRA, for example) before the economic unfeasibility occurrence [29]. The use of the EMIM was addressed by [53] to evaluate the impact analysis of wind power generation for industrial consumers considering different tariff modalities in Brazil. More recently, the work proposed by [54] also considered the EMIM for the economic and risk analysis of small-scale PV systems in different regions of Brazil. The EMIM has also been applied to the evaluation of different categories of projects such as in [55,56,57,58]. According to [30], the employment of the EMIM increases the perception and better evaluate the dimension of risk associated with the IP. The definition and interpretation of each indicator of the EMIM are also presented in Table 1 [29,30,59,60]. The EMIM can be divided into two main categories: deterministic and stochastic approach. For both approaches, the same indicators presented in Table 1 should be calculated. However, for the stochastic approach, the Monte Carlo Simulation should also be considered in the analysis, allowing a statistical analysis of risk and return dimensions.
Real options refer to current choices or opportunities for which an investor may take advantage. Thus, when a decision-maker chooses to make an irreversible investment, he exercises an option [7]. Investment opportunities in the energy generation sector are strongly affected by future expected electricity prices. The high uncertainty in future electricity prices can lead the investor to have more than only one possible investment decision. For example, the investor might postpone the investment in order to consider the timing of the investment. Therefore, he may choose to invest immediately or at an optimal time in the future as new information is revealed [7]. In these cases, ROA is considered worthwhile.
According to literature, the use of ROA is supposed to enhance the value of REP. In the context of REP, the managerial flexibility mostly includes the flexibility of delaying an investment decision. This option is expected to be valuable since optimal decisions might change over time as new information is released [61]. Managerial flexibility also expects to reduce the exposure of a project to market uncertainty [62]. According to [34] flexibility refers to 'the capability of managers to modify projects according to the evolution of uncertainty'.
The real option value corresponds to the difference between the expanded NPV, which includes the value of managerial flexibility, and the traditional NPV, which does not value managerial flexibility, according to Eq (1)
| Realoptionvalue=NPVexpanded−NPVtraditional | (1) |
For both American and European options, numerical methods are needed for their evaluation. The main models described in the literature to evaluate ROA are the Black-Scholes and the binomial tree [45,63]. The binomial tree model has been widely applied for ROA in the context of renewable energy investment decisions and its usefulness and practical implementation is well demonstrated [32,64]. In summary, the binomial tree helps to decide between the possibility of exercising the option or to wait until its maturity date. This paper will use the binomial tree model as illustrated in Figure 2.
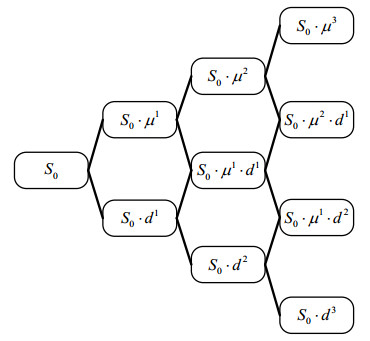
The price of the underlying asset (S), which in this case corresponds to the present value of the REP cash flows, might increase (by a factor µ) or decrease (by a factor d) at each period Δt. The coefficients µ and d reflect respectively the favorable or unfavorable market conditions and are dependent on the volatility (σ) according to Eqs (2) and (3).
| μ=eσ⋅√Δt, | (2) |
| d=e−σ⋅√Δt. | (3) |
The project's volatility is equal to the standard deviation of the underlying asset and the risk-neutral probability, p, determines how the project value is expected to increase or decrease and it is determined according to respectively Eqs (4) and (5)
| p=erf⋅Δt−dμ−d | (4) |
| q=1−p | (5) |
where rf is the risk-free interest rate.
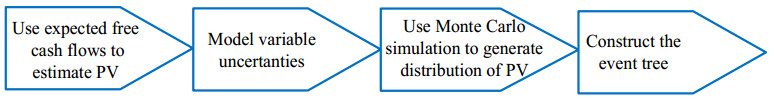
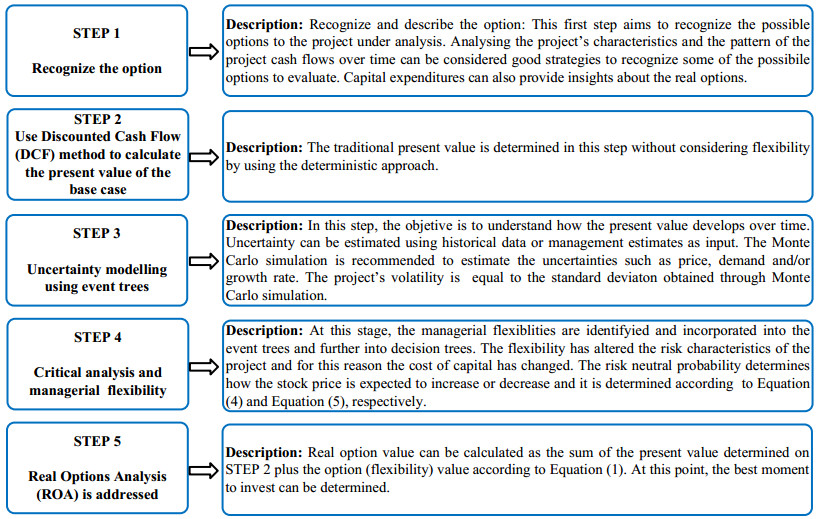
The specific procedure of applying the use of ROA in REP can be summarized as illustrated in Figure 3.
Estimating the project's volatility is not a trivial issue and it can be estimated by different approaches [66]. However, the literature usually describes this process without specifying the step-by-step necessary to determine the value of this variable [67]. The volatility is the most difficult variable to obtain since the project may have different sources of uncertainty and the selection of the appropriate sources of uncertainty of a project is essential to generate the project's volatility [66]. The authors of [68] addressed the different methodologies for estimating the project's volatility. In [66] the different approaches to calculating the project's volatility are also investigated considering an electricity distribution as the case-study.
The volatility estimation of the underlying asset has considerable relevance when using ROA since this variable is taken into consideration to determine the ascending (µ) and descending (d) factors and further to build the event tree [45]. The Monte Carlo Simulation can be employed to combine one or more uncertainties to further obtain the probability distributions required [67]. Usually, the probability of the present value of a project is undertaken. However, in this case, the volatility required to build the binomial tree corresponds to the volatility of the rate of return, z, as illustrated in Eq (6)
| z=ln(PV1+CF1PV0) | (6) |
where PV0 corresponds to the present value of the project obtained through the deterministic approach (Step 2 in Figure 3) and is kept unchanged during the Monte Carlo Simulation. CF1 is the cash flow at time 1 whereas PV1 is determined according to Eq (7)
| PV1=N∑t=2CFt(1+MRA)t−1 | (7) |
It should be emphasized that the standard deviation of the rate of return obtained through the Monte Carlo Simulation is equal to the project's volatility. After determining the project's volatility, the event tree can be built. Figure 4 illustrates the process of building a value-based event tree using the Monte Carlo Simulation based on [45].
This subsection aims to provide a general overview concerning the indicators used for each methodology (CMIA, MIM, EMIM and ROA) presented in the previous subsections 2.1, 2.2 and 2.3. Table 1 systematizes the indicators used for each methodology regarding the economic evaluation of IP and it is divided into four dimensions: return, risk, sensitivity analysis and ROA. In Table 1, CF0 is the initial investment and CFt corresponds to the cash flow for each period t.
| Dimension | Indicator | Definition |
| Return [28,30] | PV=N∑t=1CFt(1+MRA)t | Present Value (PV) is the current value of a future amount of cash flows given a specified rate of return. |
| Return [28,30] | NPV=−|CF0|+PV | Net Present Value (NPV) is the present value of an investment's expected cash inflows minus the costs of acquiring the investment. |
| Return [28,30] | NPVA=NPV⋅[MRA⋅(1+MRA)N](1+MRA)N−1 | The Annualized Net Present Value (ANPV) is the monetary value resulting from the distribution of the NPV per period, for the lifetime of the investment. |
| Return [28,30] | BCR=PV|CF0| | The Benefit-Cost Ratio (BCR) represents the expected benefits per unit of capital invested in addition to the gain if the same capital had been applied at the rate of MRA. |
| Return [28,30] | ROIA=N√BCR−1 | Additional Return on Investment (ROIA) is a measure of the extra profit obtained from the investment. This indicator is analogous to the concept of EVA (Economic Value Added) measured in percentage. |
| Return [28,30] | IndexROIA/MRA=ROIAMRA | The ROIA/MRA index is the ratio of ROIA to MRA. This index measures the magnitude of the extra return on investment. It is the additional return provided by the decision to invest in the project. |
| Return [28,30] | ROI=(1+MRA)⋅(1+ROIA)−1 | Return On Investment (ROI) or Modified Internal Rate of Return (MIRR) represents the relation between the present value of cash flows and the necessary investments to implement the project. |
| Risk [28,30] | −|CF0|+N∑t=1CFt(1+IRR)t=0 | Internal Rate of Return (IRR) represents the discount rate at which the NPV of all the cash flows from an investment equal zero. |
| Risk [28,30] | Payback Minimum{j}such that: N∑t=1CFt(1+MRA)t≥|CF0| |
Period of time required to recover the investment (Payback). |
| Risk [28,30] | IndexMRA/IRR=MRAIRR | The MRA/IRR index is the ratio of MRA to IRR and represents a financial risk. |
| Risk [28,30] | IndexPayback/N=PaybackN | The Payback/N index is the ratio between payback and the planning horizon (N) and it can be interpreted as the risk of non-recovery the invested capital. This indicator improves the risk perception regarding the recovery of the invested capital. |
| Sensitivity Analysis [29,30] |
Δ%MRAmax↑=γ=IRRMRA−1 | Maximum variation1 of MRA: If positive, it indicates the maximum variation that the MRA supports before the investment becomes economically unfeasible. If negative, it indicates the variation that the MRA must undergo to make the investment economically viable. |
| Sensitivity Analysis [29,30] |
Δ%CF0_max↑=φ=BCR−1 | Maximum variation1 of Initial Investment (CF0) |
| Sensitivity Analysis [29,30] |
Δ%CFj_max↓=λ=1−1BCR | Maximum variation1 of Cash Flow (CFj) |
| Sensitivity Analysis [29,30] |
Δ%(MRAmax↑∩CF0_max↑)=ϕ=γ⋅φγ+φ | Maximum variation1 of MRA and CF0 |
| Sensitivity Analysis [29,30] |
Δ%(MRAmax↑∩CFj_max↓)=θ=γ⋅ϕγ+ϕ | Maximum variation1 of MRA and CFj |
| Sensitivity Analysis [29,30] |
Δ%(CF0_max↑∩CFj_max↓)=α=λ⋅φλ+φ | Maximum variation1 of CF0 and CFj |
| Sensitivity Analysis [29,30] |
Δ%(MRAmax↑∩CF0_max↑∩CFj_max↓)=ββ=λ⋅φ⋅γλ⋅φ+λ⋅γ+φ⋅γ | Maximum variation1 of MRA, CF0 and CFj |
| Real Options Analysis [32] | ROvalue=NPVexpanded−NPVtraditional | The Real Option Value (ROvalue) corresponds to the difference between the expanded NPV, which includes the value of management flexibility, and the traditional NPV, which does not value managerial flexibility. |
 DownLoad:
CSV
DownLoad:
CSV
1 The variation occurs keeping the other parameters constant.
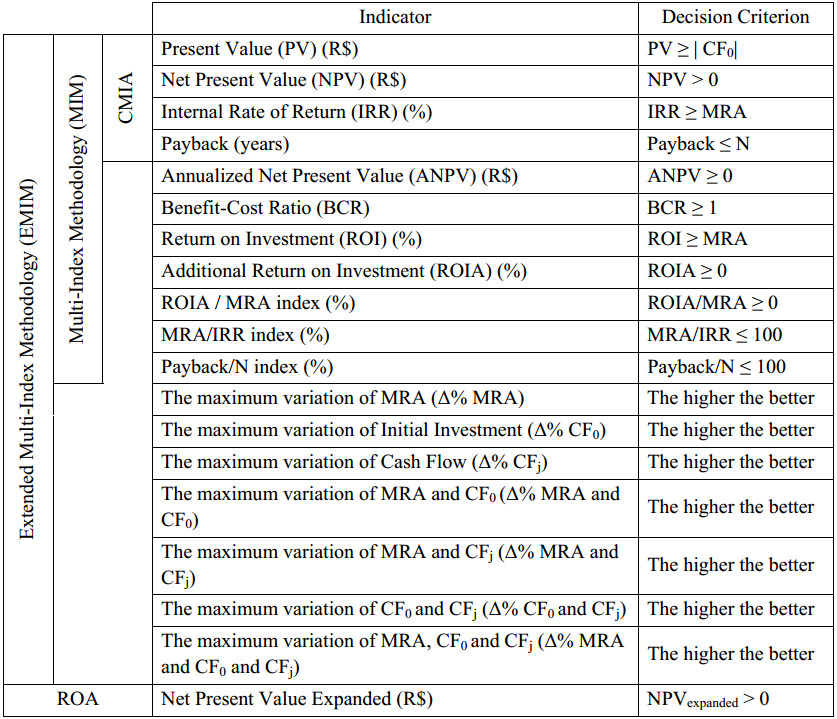
Table 2 summarizes the indicators and the decision criterion used for each methodology applied to the economic evaluation of REP. The complementarity among these methodologies is also highlighted in Table 2.
|
DownLoad:
CSV
The first objective of this paper is to identify and describe the complementarity among economic evaluation methodologies for decision making in REP. The methodologies were divided into four categories: ⅰ) CMIA, ⅱ) MIM, ⅲ) EMIM; and ⅳ) ROA. Furthermore, a comprehensive framework (illustrated in Figure 5) is proposed for choosing the most suitable methodology for conducting an economic analysis regarding REP. The main aim of this framework is to help decision-makers and companies in identifying the most suitable methodology considering the uncertainty associated with the MRA, CF0 and CFj.
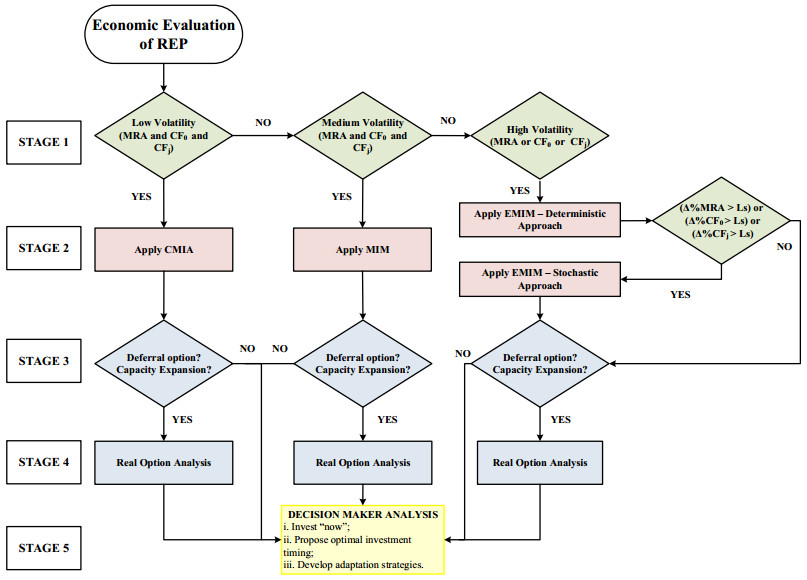
The framework is based on the volatility of the MRA, CF0 and CFj (Stage 1). The volatilities of the MRA and CF0 and CFj should be calculated considering the historical data collection for each variable. However, we point out the importance of basing these values considering the previous background knowledge and experience of the decision-maker since it would vary according to the type of REP under evaluation.
According to the proposed framework, for low volatility of the MRA and CF0 and CFj, the use of CMIA can be considered worthwhile (Stage 2). On the other side, for medium volatilities of the MRA and CF0 and CFj, the MIM should be applied to evaluate the investment (Stage 2). Finally, for a high estimated volatility of the MRA or CF0 or CFj, the model proposes firstly the use of the deterministic EMIM (Stage 2). If the maximum variation of MRA (Δ% MRA) or if the maximum variation of the initial investment (Δ%CF0) or even if the maximum variation of cash flow (Δ%CFj) is greater than a pre-defined threshold (LS) the stochastic approach of the EMIM should also be performed through the MCS. For the project under evaluation in this work the value of the threshold LS is defined as 20% (i.e., if Δ% MRA > 20% or if Δ% CF0 > 20% or even if Δ% CFj > 20% the stochastic approach of the EMIM should also be considered). The scale proposed for determining the 'low', 'medium' and 'high' volatilities are ('low': up to 5%; 'medium': between 5% and 20% and 'high': higher than 20%). This scale is proposed by the authors considering their background knowledge and experience in the field of the economic evaluation of REP. However, it is worth mentioning that the values of both the volatilities and the threshold LS could be different according to the perceptions and background knowledge of the decision-maker. Future studies will seek to estimate the thresholds for the volatility of each variable (MRA, CF0 and CFj) capturing aspects that are important for each specific REP.
If a now-or-never investment approach is considered, the corresponding methodology (CMIA, MIM or EMIM) should be applied and the ROA is not necessary (Stage 2). However, if there are one or more options embedded in the project such as the deferral option or adding facilities over time (capacity expansion) (Stage 3), the ROA should also be addressed (Stage 4) to estimate the value of this option and then the decision-maker analysis should be finally undertaken (Stage 5). Section 4 will demonstrate the application of the proposed methodology to a real REP case-study whose description is provided in the next subsection (Section 3.1).
This section provides the main characteristics of the REP under analysis regarding the capital and operational expenditures, variable costs and taxes. The investment used in this paper as the case-study is based on a real SHP project with an expected installed capacity of 7 MW and it is located in the South region of Brazil. The hydropower plant is expected to start operating preferably until 2022, according to the company's information. Also, the SHP investors aim to sell the energy of the proposed investment in the Regulated Contracting Environment (RCE) in which distributors acquire energy by auctions regulated by the government, resulting in a previously settled feed-in-tariff. The main characteristic of the SHP and its associated costs are presented in Table 3.
| Data | Values | Unit |
| Installed capacity | 7 | MW |
| Expected annual energy production | 36,792 | MWh |
| Investment costs | 31.5 | millions of R$ |
| Operating & maintenance costs—annual | 35,000 | R$ |
| Variable costs | 6 | R$/MWh |
| Feed-in tariff | 178.42 | R$/MWh |
| Annual discount rate | 8 | % |
| Remuneration period | 30 | years |
| Residual value | 8 | millions of R$ |
| Period of construction | 2 | years |
| PIS3 | 1.65 | (% over the annual gross revenue) |
| COFINS4 | 7.60 | (% over the annual gross revenue) |
| Service System Charge | 6 | (% over the annual gross revenue) |
| Administrative expenses | 0.5 | (% over the annual gross revenue) |
DownLoad:
CSV
3 PIS - Program of Social Integration.
4 COFINS - Contribution for the Financing of Social Security.
The expected annual power production and the forecasted capital expenditures were estimated based on previous studies undertaken by the entrepreneur. Other data needed relies mostly on information collected from the company and are displayed also in Table 3. The assumed annual MRA is equal to 8%, based on [69]. Most of the project funding (90%) will be obtained through the company's equity. Meanwhile, the remaining financing (10%) is supposed to come from a loan of the National Bank for Economic and Social Development (BNDES2) at an interest rate of 9% per year that should be paid in ten years (amortization period) with a grace period of 2 years.
2 BNDES is one of the few sources of long‐term financing in Brazil.
Furthermore, a set of key assumptions are considered. Firstly, the feed-in tariff for the traditional analysis was defined considering the mean value of historical data available on [70] for Brazilian electricity generation auctions between 2009 and 2016. Energy remuneration is assumed to remain constant throughout the project's lifetime. In the same way, the gross revenue should remain constant, as it is assumed that the SHP under evaluation will be a participant of the Energy Reallocation Mechanism (in Portuguese, MRE). The costs presented in Table 3 comprises technical support, administrative charges, maintenance and replacement needs, and other service supplies valued according to the company's description.
In this section, the proposed framework is applied to a case study of a real SHP project. In line with the proposed framework, for the project under evaluation in this paper, the EMIM is the most suitable methodology to apply since the estimated volatilities of the energy prices (affecting CFj) are considered high (20.40%—see Subsection 4.2). However, for the sake of simplicity and didactic purposes, in the next subsections, the project will be evaluated considering each methodology (CMIA, MIM, EMIM and ROA). Subsection 4.1 will present the economic evaluation of the SHP project considering the CMIA, MIM and EMIM. Firstly, the CMIA is applied to determine the NPV, IRR and the Payback. Secondly, a new set of indicators is determined using the MIM and the EMIM. Subsection 4.2 applies the ROA to the case-study. Section 4.3 presents a lively discussion regarding the mains findings of this research. For the SHP under analysis in this work, the investor considers as 'high' volatility, values higher than 20% for the MRA or CF0 or CFj. The indicators presented in Table 1 were calculated using an online tool known as $Λv€π (Systematic for the Analysis of the Economic Viability of Investment Projects) proposed by [60]. The results were validated using ExcelⓇ software.
This subsection aims to present the use of the proposed framework to evaluate the project's investment viability considering the CMIA, MIM and EMIM. Table 4 shows the projected cash flows for each year for the project under analysis.
| Variable | Values (thousands of R$) |
| Gross revenue | 6,564 |
| (-) PIS | 108 |
| (-) COFINS | 499 |
| Net revenue | 5,957 |
| (-) O & M | 221 |
| (-) Service System Charge | 394 |
| (-) Administrative expenses | 33 |
| (-) Depreciation | 1,050 |
| Cash flow before income tax and CSLL5 | 4,260 |
| (-) Income tax (IR) and CSLL | 1,448 |
| (+) Depreciation | 1,050 |
| Free cash flow | 3,861 |
DownLoad:
CSV
5 CSLL - Social Contribution on Net Profits.
The results of the project evaluation considering the assumptions previously mentioned are summarized in Table 5 for the CMIA, MIM and EMIM. Considering the CMIA, the investment is recovered in 14 years (Discounted Payback), with a positive NPV of R$ 12.61 million. The IRR is equal to 12.12%, higher than the discount rate of 8%. According to literature, it can be stated that considering the classical indicators obtained, the project has economic viability and should be implemented since NPV > 0, IRR > MRA and Payback < N.
However, supported by available literature [21,28,29,30,71], only the information of the NPV, IRR, and Payback are notoriously not enough to support an investment decision with high volatility. Using the MIM and the EMIM, a new set of indicators can be explored, increasing the investor's perception towards an integrated assessment of risk and return dimensions as illustrated in Table 5. The BCR measures the expectation of return for each unit of capital. For this investment project, the expectation is to obtain a BCR equal to 1.44. ROIA is estimated to be equal to 1.23% above MRA, representing the wealth generated by the project. The indicator ROIA is considered the best estimate of the profitability of an IP according to [30].
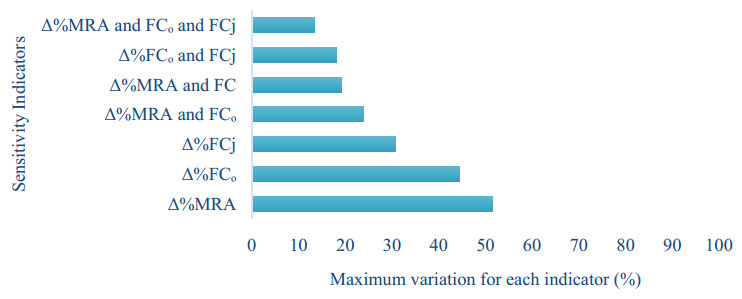
The risk measured by Payback/N and MRA/IRR indexes indicates, respectively a medium (46.67%) and medium-high (66.00%) risk according to the scale proposed in Table 6. The indicators of sensitivity analysis (EMIM) reveal that the initial investment (CF0) and MRA may grow up respectively by 44.50% and 51.50% before making the project economically unfeasible. The annual free cash flows (CFj), however, could have a decrease of up to 30.79% before making the project economically unfeasible. Clearly, the lowest value among the Δ%MRA, Δ%CFj and Δ%CF0 is for the Δ%CFj (30.79%) indicating a medium-high risk according to the scale presented in Table 6 whereas a medium risk is assigned for the Δ%MRA and Δ%CF0. Therefore, for this specific project under evaluation, the sensitivity analysis reveals that the annual free cash flows should receive greater attention of the investor since it has the lowest margin (30.79%) compared to the other individuals' margins (i.e., Δ%MRA and Δ%CF0). The same analysis can be performed for the other sensitivity indicators (Δ%MRA and CF0, Δ%MRA and CFj, Δ%CF0 and CFj, Δ%MRA and CF0 and CFj). The maximum variation for each indicator of the sensitivity analysis is presented in Figure 6.
| Category | Indicator | Low | Low-Medium | Medium | Medium-High | High |
| Return | ROIA/MRA | 15.43 | ||||
| Risk | Payback/N | 46.67 | ||||
| Risk | MRA/TIR | 66.00 | ||||
| Scale | 0–20% | 20%–40% | 40%–60% | 60%–80% | 80%–100% | |
| Category | Indicator | High | Medium-High | Medium | Low-Medium | Low |
| Sensitivity Indicator | Δ%MRA | 51.50 | ||||
| Sensitivity Indicator | Δ%CF0 | 44.50 | ||||
| Sensitivity Indicator | Δ%CFj | 30.79 | ||||
| Scale | 0–20% | 20%–40% | 40%–60% | 60%–80% | 80%–100% |
DownLoad:
CSV
Therefore, it can be concluded that the three methodologies (CMIA, MIM and EMIM) presented in this subsection can be considered complementary to each other. Using a larger set of indicators might provide the decision-maker with a more comprehensive view of the investment evaluation regarding both its profitability and risk. The application of each methodology (CMIA, MIM and EMIM) should be chosen considering the volatility of MRA, CF0 and CFj. If the values of MRA, CF0, and CFj are expected to remain constant (or expected to have low volatility) during the period under analysis, the CMIA may be considered suitable. Nevertheless, for most of the investments, such as the one evaluated in this paper and other REP, these variables usually tend to have a medium or high degree of volatility and the application of the MIM or EMIM may be better suited than the CMIA. Specifically, the use of the EMIM might provide to the decision-maker a better perception to support its decision regarding the dimensions of return and risk. Subsection 4.2 will explore the use of ROA considering the deferral option of the SHP project.
The SHP project evaluation is undertaken in this subsection considering the deferral option using ROA. There are two main sources of uncertainty regarding a SHP project: the final energy price [72] and the best moment of signing the Power Purchase Agreement (PPA). The data provided for the project evaluation in Subsection 3.1 and Subsection 4.1 are also taken into consideration in this subsection. This paper considers the volatility of energy prices (affecting the CFj) as the main source of uncertainty since other uncertainties as operational costs and technological changes do not suffer from high levels of uncertainty regarding this type of investment. The Geometric Brownian Motion is used for estimating the volatility of investment returns and software @RISKⓇ is used for the distribution fitting of data. The energy price uncertainty is modelled as a lognormal distribution based on the historical values of energy prices practiced in the auctions from 2009 to 2016.
The descriptive statistics of electricity prices (R$/MWh) of SHP auctions in Brazil from 2009 to 2016 [70] are presented in Table 7. The obtained mean and the standard deviation are equal to 178.42 and 36.4, respectively and these values will be used for required estimations. The risk-free interest rate considered is equal to 4.5% based on [69].
| 2009 | 2010 | 2013 | 2014 | 2015 | 2016 | 2009–2016 | |
| Minimum | 144.00 | 129.93 | 120.00 | 160.90 | 195.00 | 147.85 | 120.00 |
| Maximum | 144.00 | 154.49 | 139.20 | 162.50 | 207.64 | 235.00 | 235.00 |
| Mean | 144.00 | 146.54 | 134.52 | 161.97 | 204.63 | 204.69 | 178.42 |
| Standard deviation | - | 8.32 | 5.00 | 0.92 | 3.06 | 25.30 | 36.40 |
| Quantity | 1 | 11 | 23 | 3 | 15 | 40 | 93 |
DownLoad:
CSV
The project's volatility was obtained through a Monte Carlo simulation with 5,000 interactions using as the output variable the volatility of the rate of return. The standard deviation of the rate of return estimated is equal to 33.56% (equal to the volatility of the project) whereas the standard deviation of energy prices is equal to 20.40%.
The event tree gives the value of the underlying asset without flexibility as illustrated in Table 8. Table 9 presents the project value event tree with flexibility. Finally, Table 10 provides the option decisions into the nodes of the tree, coming up to a decision tree, which may be viewed as a collection of options on the underlying asset.
| 0 | 1 | 2 | 3 |
| R$ 53.58 | R$ 74.94 | R$ 104.83 | R$ 146.64 |
| R$ 38.30 | R$ 53.58 | R$ 74.97 | |
| R$ 27.38 | R$ 38.30 | ||
| R$ 19.57 |
DownLoad:
CSV
| 0 | 1 | 2 | 3 |
| R$ 21.25 | R$ 38.15 | R$ 65.67 | R$ 105.67 |
| R$ 7.28 | R$ 15.72 | R$ 33.98 | |
| R$ 0.00 | R$ 0.00 | ||
| R$ 0.00 |
DownLoad:
CSV
| 0 | 1 | 2 | 3 |
| Delay | Delay | Delay | Invest |
| Invest | Delay | Invest | |
| Do not invest | Do not invest | ||
| Do not invest |
DownLoad:
CSV
The value of the option to postpone the decision on investing is approximately R$ 21.25 million, which is 68.46% higher than the static NPV (R$ 12.61 million). Using Eq (1), the option value of delay can be calculated given by the difference between the expanded NPV and static NPV, resulting in approximately R$ 8.63 million. Therefore, using ROA the investor should postpone its decision until more favourable investment conditions appear. Because of the high level of uncertainty, the flexibility has added a relevant value to the project. Thus, the extra value of flexibility makes the project worthwhile. The value of a real option increases if the underlying project is very risky or if there is a long time before the investor is supposed to exercise the option. In this particular case, the project is risky mainly because of the high volatility estimated. Moreover, the investor has three years before deciding, and then the option to wait is probably to be valuable.
This section aims to highlight the importance of the complementarity among the methodologies for the economic evaluation of REP. Firstly, supported by the available literature, there is some evidence to suggest the need for new methodologies to better evaluate investments. The authors of [40], for instance, highlight the need for using a set of indexes to better evaluate renewable energy projects and also points out the importance of using not only investment return indicators but also the inclusion of risk indicators. Additionally, as argued by [15], renewable energy investors should compare investment opportunities 'by looking at their risk-adjusted returns'. Therefore, the analysis carried out in the previous sections clearly indicates that the proposed economic evaluation methodologies are complementary.
A comprehensive framework for choosing the most suitable methodology regarding the economic evaluation of a REP is also proposed based on the volatilities of MRA, CF0 and CFj. The framework may be considered as a novel approach regarding the use of different methodologies to evaluate energy investments and provides a better understanding of the usefulness of each methodology. We derived broadly applicable conclusions on the benefits and role of the proposed framework and provide evidence of an easy transferability of our approach to evaluate other REPs.
Our findings also suggest that the indicators proposed by the CMIA (i.e., NPV, IRR and Payback) should not be ignored in the economic evaluation of REP. On the contrary, they may be considered suitable for low volatilities of MRA, CF0 or CFj. However, the economic analysis should be supplemented by a new set of indicators for medium and high volatilities of MRA, CF0 and/or CFj applying respectively the MIM and the EMIM in order to increase the investor's perception. The sensitivity analysis of each input parameter for the MIM and the EMIM offer additional risk-return measures, increasing the investor's perception regarding the investment. Using the proposed framework, deferral options and capacity expansion decisions can be also improved using ROA.
Our proposal provides considerable methodological advantages when compared with traditional analysis of renewable energy investments to manage, for instance, with renewable energy project risks. The proposed framework also offers substantial value-added information, providing relevant evidence to investors and identifying the most suitable methodology before proceeding with the investment. For instance, for high volatilities of the input variables, the investor can assess the risk-return more easily and throughout the sensitivity analysis, the investor can also have a better perception of which of the input variables would mostly impact the investment's profitability and risk and also to account for flexibility in the case of using ROA.
This paper addressed the importance of using complementary economic evaluation methodologies to assess REP. Traditional methods such as Payback, NPV and IRR have been used extensively for evaluating investments and are usually referred to as simple and straightforward methods. The use of complementary methodologies such as the MIM and the EMIM have been recently proposed in the literature, enhancing the perception of the dimensions of return and risk. However, the use of these conventional methodologies can be inconsistent due to the high degree of uncertainty and irreversibility of REP. Traditional methodologies also do not allow the decision-maker to consider the timing of the investment neither estimates the value of project uncertainties. Therefore, the ability to account for flexibility options has stimulated the use of ROA for evaluating energy investments. The deferral option, for instance, might bring relevant value to the evaluation of renewable energy projects.
A comprehensive framework is proposed for selecting a suitable methodology for economic analysis focused on REP. However, the methodologies evaluated in this paper should not be considered absolute since the evaluation of investments carries out several uncertainties. For the CMIA, MIM and EMIM the project investment is evaluated using a deterministic approach based on a discounted cash-flow method. A stochastic approach should also be considered for the EMIM as illustrated in the proposed framework. For the EMIM, using a larger set of indicators might provide to the decision-maker a better perception related to the dimensions of risk and return before taking its decision. The use of ROA might bring relevant value to the evaluation of REP in cases in which the investor has the option to wait until more favorable conditions appear.
The generalisability of these results is subject to certain limitations. The scope of this study was limited in terms of evaluating only a case-study, for example. Therefore, the complementarity of the risk-return-flexibility analysis should be further explored for other REP and considering the specific characteristics of each power system (e.g., market and regulatory structure). The generalisability of the proposed scale for the volatilities is also somewhat limited to the evaluated case-study. Further work is required to establish the thresholds for the volatility of each variable (MRA, CF0 and CFj) capturing aspects that are important for each specific REP. Notwithstanding these limitations, our proposed framework would allow the investors to analyse the risk-return-flexibility aspects for different policies, such as through feed-in tariffs (i.e., increase/decrease in return), through loan guarantees (i.e., increase/decrease risk) or even considering the flexibility options (i.e., using ROA). We also highlight the usefulness of the framework to the government, allowing to shape its policies in line with its needs for increasing the renewable energy shares and therefore to support the transition towards a more sustainable energy future. The framework may help an entrepreneur or a company to optimally configure its portfolio for future REP investments in terms of maximizing the value of the portfolio; creating the right mix of projects considering priority criteria but also maximizing goal alignment and/or optimizing resources.
In addition to the aforementioned analysis regarding the main aspects related to each economic evaluation methodology, several other considerations will become increasingly important in the future and should, therefore, receive consideration both in designing new procedures and methodologies and in research on the topic. Although simplified, we believe our results offer important insights and bring some light on the importance of using complementary economic evaluation methodologies to assess renewable energy projects under different volatile conditions.
This work is supported by the National Council for Scientific and Technological Development (CNPq), Brazil. This work has been supported by FCT—Fundação para a Ciência e Tecnologia within the R & D Units Project Scope: UIDB/00319/2020.
The authors declare that there is no conflict of interest in publishing this paper.
| [1] |
Pukšec T, Leahy P, Foley A, et al. (2018) Sustainable development of energy, water and environment systems. Renewable Sustainable Energy Rev 82: 1685-1690. doi: 10.1016/j.rser.2017.10.057

|
| [2] | Selvakkumaran S, Ahlgren EO (2017) Understanding the local energy transitions process: a systematic review. Int J Sustainable Energy Plan Manage 14: 57-78. |
| [3] | OECD/IEA, IRENA (2017) Perspectives for the energy transition: Investment needs for a Low-Carbon energy system. Int Energy Agency 204. |
| [4] |
Söder L, Lund PD, Koduvere H, et al. (2018) A review of demand side flexibility potential in Northern Europe. Renewable Sustainable Energy Rev 91: 654-664. doi: 10.1016/j.rser.2018.03.104
|
| [5] | IEA (2017) Renewables 2017: Analysis and Forecasts to 2022. Paris: OECD Publishing, 6. Available from: https://www.iea.org/reports/renewables-2017. |
| [6] |
Dranka GG, Ferreira P (2019) Review and assessment of the different categories of demand response potentials. Energy 179: 280-294. doi: 10.1016/j.energy.2019.05.009
|
| [7] |
Kjærland F (2007) A real option analysis of investments in hydropower-The case of Norway. Energy Policy 35: 5901-5908. doi: 10.1016/j.enpol.2007.07.021
|
| [8] | Dranka GG, Ferreira P (2020) Towards a smart grid power system in Brazil: Challenges and opportunities. Energy Policy 136. |
| [9] |
McPherson M, Tahseen S (2018) Deploying storage assets to facilitate variable renewable energy integration: The impacts of grid flexibility, renewable penetration, and market structure. Energy 145: 856-870. doi: 10.1016/j.energy.2018.01.002
|
| [10] |
Koltsaklis NE, Dagoumas AS, Panapakidis IP (2017) Impact of the penetration of renewables on flexibility needs. Energy Policy 109: 360-369. doi: 10.1016/j.enpol.2017.07.026
|
| [11] |
Dranka GG, Ferreira P (2018) Planning for a renewable future in the Brazilian power system. Energy 164: 496-511. doi: 10.1016/j.energy.2018.08.164
|
| [12] | Sorknæs P, Lund H, Andersen AN, et al. (2014) Small-scale combined heat and power as a balancing reserve for wind-The case of participation in the German secondary control reserve. Int J Sustainable Energy Plan Manage 4: 31-42. |
| [13] |
Dranka GG, Ferreira P, Vaz AIF (2020) Cost-effectiveness of energy efficiency investments for high renewable electricity systems. Energy 198: 117198. doi: 10.1016/j.energy.2020.117198
|
| [14] |
Cedrick BZE, Long PW (2017) Investment motivation in renewable energy: A PPP Approach. Energy Procedia 115: 229-238. doi: 10.1016/j.egypro.2017.05.021
|
| [15] |
Wüstenhagen R, Menichetti E (2012) Strategic choices for renewable energy investment: Conceptual framework and opportunities for further research. Energy Policy 40: 1-10. doi: 10.1016/j.enpol.2011.06.050
|
| [16] | Cunha J, Ferreira PV (2014) Designing electricity generation portfolios using the mean-variance approach. Int J Sustainable Energy Plan Manage 4: 17-30. |
| [17] |
Ozorhon B, Batmaz A, Caglayan S (2018) Generating a framework to facilitate decision making in renewable energy investments. Renewable Sustainable Energy Rev 95: 217-226. doi: 10.1016/j.rser.2018.07.035
|
| [18] |
Gatzert N, Kosub T (2016) Risks and risk management of renewable energy projects: The case of onshore and offshore wind parks. Renewable Sustainable Energy Rev 60: 982-998. doi: 10.1016/j.rser.2016.01.103
|
| [19] | Liebreich M (2005) Financing RE: Risk management in financing renewable energy projects. Refocus 6: 18-20. |
| [20] |
Steffen B (2018) The importance of project finance for renewable energy projects. Energy Econ 69: 280-294. doi: 10.1016/j.eneco.2017.11.006
|
| [21] |
Arnold U, Yildiz Ö (2015) Economic risk analysis of decentralized renewable energy infrastructures-A Monte Carlo Simulation approach. Renewable Energy 77: 227-239. doi: 10.1016/j.renene.2014.11.059
|
| [22] |
Bistline JE, Comello SD, Sahoo A (2018) Managerial flexibility in levelized cost measures: A framework for incorporating uncertainty in energy investment decisions. Energy 151: 211-225. doi: 10.1016/j.energy.2018.03.036
|
| [23] |
Liu X, Zeng M (2017) Renewable energy investment risk evaluation model based on system dynamics. Renewable Sustainable Energy Rev 73: 782-788. doi: 10.1016/j.rser.2017.02.019
|
| [24] |
Sadorsky P (2012) Modeling renewable energy company risk. Energy Policy 40: 39-48. doi: 10.1016/j.enpol.2010.06.064
|
| [25] |
Akter MN, Mahmud MA, Oo AMT (2017) Comprehensive economic evaluations of a residential building with solar photovoltaic and battery energy storage systems: An Australian case study. Energy Build 138: 332-346. doi: 10.1016/j.enbuild.2016.12.065
|
| [26] |
Dalton G, Allan G, Beaumont N, et al. (2015) Economic and socio-economic assessment methods for ocean renewable energy: Public and private perspectives. Renewable Sustainable Energy Rev 45: 850-878. doi: 10.1016/j.rser.2015.01.068
|
| [27] |
Tran TTD, Smith AD (2018) Incorporating performance-based global sensitivity and uncertainty analysis into LCOE calculations for emerging renewable energy technologies. Appl Energy 216: 157-171. doi: 10.1016/j.apenergy.2018.02.024
|
| [28] | Souza A, Clemente A (2008) Financial decisions and investment analysis: Fundaments, techniques and applications. São Paulo, Atlas (original source in Portuguese). |
| [29] | Lima JD de, Trentin MG, Oliveira GA, et al. (2017) Systematic analysis of economic viability with stochastic approach: A proposal for investment. Eng Syst Networks. |
| [30] |
Lima JD de, Trentin MG, Oliveira GA, et al. (2015) A systematic approach for the analysis of the economic viability of investment projects. Int J Eng Manage Econ 5: 19-34. doi: 10.1504/IJEME.2015.069887
|
| [31] | Casarotto Filho NC, Kopittke BH (2010) Investment analysis: Financial mathematics, economic engineering, decision making, business strategy. São Paulo (original source in Portuguese). |
| [32] |
Santos L, Soares I, Mendes C, et al. (2014) Real options versus traditional methods to assess renewable energy projects. Renewable Energy 68: 588-594. doi: 10.1016/j.renene.2014.01.038
|
| [33] | Johansson E (2010) Real options in energy investments. Mathematics 64. |
| [34] |
Martínez-Ceseña EA, Mutale J (2011) Application of an advanced real options approach for renewable energy generation projects planning. Renewable Sustainable Energy Rev 15: 2087-2094. doi: 10.1016/j.rser.2011.01.016
|
| [35] | Joode J, Boots MG (2005) Concepts of investment risks and strategies in electricity generation. ECN-C-05-061. Netherlands. |
| [36] | Dranka GG, Cunha J, Ferreira P, et al. (2018) Real options theory applied to the evaluation of small hydropower investments in Brazil, ECOS 2018-Proceedings of the 31st International Conference on Efficiency, Cost, Optimization, Simulation and Environmental Impact of Energy Systems. |
| [37] | Giorgetto TM (2012) Investment decision for small hydroelectric plants and wind power plants: Application of the real options theory. Fundação Getulio Vargas, São Paulo. (original source in Portuguese). |
| [38] | Fernandes B, Cunha J, Ferreira P (2011) Real options theory in comparison to other project evaluation techniques. 1st International Conference on Project Economic Evaluation, ICOPEV 2011, Guimarães, Portugal, 187-193. |
| [39] | Junkes MB, Tereso AP, Sérgio P, et al. (2009) Current practice and teaching of engineering economics in Brazilian Universities. 4th International Symposium on Project Approaches in Engineering Education-(PAEE), São Paulo, Brazil, 301-308. |
| [40] |
Pereira EJ da S, Pinho JT, Galhardo MAB, et al. (2014) Methodology of risk analysis by Monte Carlo Method applied to power generation with renewable energy. Renewable Energy 69: 347-355. doi: 10.1016/j.renene.2014.03.054
|
| [41] | Cunha J, Ferreira PV (2014) A risk analysis of Small-Hydro Power (SHP) plants investments. Int J Sustainable Energy Plan Manage 2: 47-62. |
| [42] |
Talavera DL, Pérez-Higueras P, Almonacid F, et al. (2017) A worldwide assessment of economic feasibility of HCPV power plants: Profitability and competitiveness. Energy 119: 408-424. doi: 10.1016/j.energy.2016.12.093
|
| [43] | Kitzing L, Weber C (2015) Support mechanisms for renewables: How risk exposure influences investment incentives. Int J Sustainable Energy Plan Manage 7: 113-130. |
| [44] | Nogas PSM, Silva WV, Souza A (2010) Investment analysis: A probabilistic contribution to the TMA/TIR index of the multi-index methodology. Rev Iberoam Ciências Empres y Econ 2: 10-26 (original source in Spanish). |
| [45] | Copeland T, Antikarov V (2003) Real Options, Revised Edition: A Practitioner's Guide, Penguin Group. |
| [46] |
Fernandes B, Cunha J, Ferreira P (2011) The use of real options approach in energy sector investments. Renew Sustain Energy Rev 15: 4491-4497. doi: 10.1016/j.rser.2011.07.102
|
| [47] |
Andrés P de, Fuente G de, San Martín P (2015) Capital budgeting practices in Spain. BRQ Bus Res Q 18: 37-56. doi: 10.1016/j.brq.2014.08.002
|
| [48] | de Souza P, Lunkes RJ (2016) Capital budgeting practices by large Brazilian companies. Contaduría y Adm 61: 514-534. |
| [49] |
Schlegel D, Frank F, Britzelmaier B (2016) Investment decisions and capital budgeting practices in German manufacturing companies. Int J Bus Glob 16: 66. doi: 10.1504/IJBG.2016.073626
|
| [50] | Caloba GM, Neves C das, Costa RP, et al. (2008) Economic engineering and finance. Elsevier. (original source in Portuguese). |
| [51] | Harry J, Católica H, Alisson J, et al. (2014) Probabilistic approach of the TMA/TIR indicator to assess financial risk in investment projects. XXI Congresso Brasileiro de Custos, Natal, 16 (original source in Portuguese). |
| [52] | Johann ER, Souza A, Bispo CM (2014) Classical and multi-index methodologies in the financial evaluation of investment projects: A case study in the alpha company. Revista Gestão e Desenvolvimento, Novo Hamburgo, Brazil, v. 11, n. 1, jan. 2014. ISSN 2446-6875 (original source in Portuguese). |
| [53] | Dranka GG, Portolann CA, Casamali DF, et al. (2017) Impact analysis of wind power mini-generation for industrial consumers considering different tariff modalities in Brazil, 2016 12th IEEE International Conference on Industry Applications, INDUSCON 2016. |
| [54] |
Dranka GG, Lima JD de, Bonotto RC, et al. (2018) Economic and risk analysis of Small-Scale PV systems in Brazil. IEEE Lat Am Trans 16: 2530-2538. doi: 10.1109/TLA.2018.8795132
|
| [55] |
Caricimi R, Lima de JD (2018) Economic analysis for small hydroelectric power plant using extended Multi-Index methodology-An approach stochastic by the monte carlo simulation. IEEE Lat Am Trans 16: 2184-2191. doi: 10.1109/TLA.2018.8528233
|
| [56] | Goffi AS, Trojan F, de Lima JD, et al. (2019) Economic feasibility for selecting wastewater treatment systems. Water Sci Technol 78: 2518-2531. |
| [57] |
Gularte LCP, Lima JD de, Oliveira GA, et al. (2017) Economic feasibility study of the implementation of a waste recycling plant construction in Pato Branco, Paraná, using the extended multi-index methodology. Eng Sanit Ambient 22: 985-992. (original source in Portuguese). doi: 10.1590/s1413-41522017162097
|
| [58] | Da Silva KP, De Lima JD, Malacarne K, et al. (2019) Analysis of the economic viability of process automation: a case study in an agro-industrial poultry cooperative. Custos e Agronegocio Line 15: 537-555 (original source in Portuguese). |
| [59] | Lima JD de, Southier LFP (2019) Practical guide for user of SAVEPI, Pato Branco (original source in Portuguese). |
| [60] |
Lima JD de, Bennemann M, Southier FLP, et al. (2017) Savepi-Web System to support the teaching and learning process in engineering economics. Brazilian J Oper Prod Manage 14: 469-485. doi: 10.14488/BJOPM.2017.v14.n4.a4
|
| [61] | Henao A, Sauma E, Reyes T, et al. (2017) What is the value of the option to defer an investment in Transmission Expansion Planning ? An estimation using Real Options. Energy Econ 65: 194-207. |
| [62] |
Saleh JH, Mark G, Jordan NC (2009) Flexibility: A multi-disciplinary literature review and a research agenda for designing flexible engineering systems. J Eng Des 20: 307-323. doi: 10.1080/09544820701870813
|
| [63] | Fabrini KL (2011) Real options theory: An approach to investment analysis in the expansion of the power sector. Universidade Federal de Minas Gerais (original source in Portuguese). |
| [64] | Fenolio LM da S, Minardi AMAF, Monteiro L, et al. (2009) Applying real options theory to the valuation of small hydropower plants. Rev Econ e Adm 8: 347-369. |
| [65] | Luehrman T (1998) Investment opportunities as real options: Getting started on the numbers. Harv Bus Rev 76: 97-105. |
| [66] | Pamplona E de O, Brandão MC, Montevechi JAB, et al. (2013) Evaluating energy sector investments: Calculating volatility. Math Probl Eng 2013: 128309. |
| [67] | Neto JFC (2009) Elaboration and evaluation of investment projects, GEN Atlas, Rio de Janeiro (original source in Portuguese). |
| [68] | Vasseur JP, Sanchez NMP, Escobar MEM (2019). Real Options Volatility: Literature Review and a Case of Application in the Colombian Oil Sector. J Quant Methods Econ Bus Adm: 27: 136-155. |
| [69] | ANEEL (2013) Technical Note DEA 27/13, Brazil, ANEEL. |
| [70] | ANEEL (2016) Results from electricity auctions in the ACR environment from 2005 to 2016, 2016. Available from: http://www.aneel.gov.br/. |
| [71] |
Pereira EJ da S, Pinho JT, Galhardo MAB, et al. (2014) Methodology of risk analysis by Monte Carlo Method applied to power generation with renewable energy. Renewable Energy 69: 347-355. doi: 10.1016/j.renene.2014.03.054
|
| [72] |
Bøckman T, Fleten SE, Juliussen E, et al. (2008) Investment timing and optimal capacity choice for small hydropower projects. Eur J Oper Res 190: 255-267. doi: 10.1016/j.ejor.2007.05.044
|
| 1. | Piotr W. Saługa, Katarzyna Szczepańska-Woszczyna, Radosław Miśkiewicz, Mateusz Chłąd, Cost of Equity of Coal-Fired Power Generation Projects in Poland: Its Importance for the Management of Decision-Making Process, 2020, 13, 1996-1073, 4833, 10.3390/en13184833 | |
| 2. | Géremi Gilson Dranka, Paula Ferreira, Electric Vehicles and Biofuels Synergies in the Brazilian Energy System, 2020, 13, 1996-1073, 4423, 10.3390/en13174423 | |
| 3. | Wilhelm Kuckshinrichs, LCOE: A Useful and Valid Indicator—Replica to James Loewen and Adam Szymanski, 2021, 14, 1996-1073, 406, 10.3390/en14020406 | |
| 4. | Mojgan Pouralizadeh, A DEA model to sustainability improvement of the electricity supply chain in presence dual-role factors and undesirable outputs: A case on the power industry, 2020, 8, 2333-8334, 580, 10.3934/energy.2020.4.580 | |
| 5. | Vanderson Aparecido Delapedra-Silva, The different characteristics of real options in contracts of wind power in Brazil, 2021, 28, 1806-9649, 10.1590/1806-9649-2021v28e5652 | |
| 6. | Simone Andreia Guares, José Donizetti de Lima, Gilson Adamczuk Oliveira, Techno-economic model to appraise the use of cattle manure in biodigesters in the generation of electrical energy and biofertilizer, 2021, 150, 09619534, 106107, 10.1016/j.biombioe.2021.106107 | |
| 7. | Géremi Gilson Dranka, Paula Ferreira, A. Ismael F. Vaz, A review of co-optimization approaches for operational and planning problems in the energy sector, 2021, 304, 03062619, 117703, 10.1016/j.apenergy.2021.117703 | |
| 8. | Vanderson Delapedra-Silva, Paula Ferreira, Jorge Cunha, Herbert Kimura, Methods for Financial Assessment of Renewable Energy Projects: A Review, 2022, 10, 2227-9717, 184, 10.3390/pr10020184 | |
| 9. | Martina Bertoncini, Adele Boggio, Federico Dell'Anna, Cristina Becchio, Marta Bottero, An application of the PROMETHEE II method for the comparison of energy requalification strategies to design Post-Carbon Cities, 2022, 10, 2333-8334, 553, 10.3934/energy.2022028 | |
| 10. | Abdolmajid Erfani, Mehdi Tavakolan, Ali Hassandokht Mashhadi, Pouria Mohammadi, Heterogeneous or homogeneous? A modified decision-making approach in renewable energy investment projects, 2021, 9, 2333-8334, 558, 10.3934/energy.2021027 | |
| 11. | Guilherme Bolico Pletsch, Dalmarino Setti, José Donizetti de Lima, Gilson Adamczuk Oliveira, Tatiana Colombo Pimentel, A Multi-Criteria Model for the Techno-Economic Evaluation of Fat Removal Technologies From Dairy Waste, 2023, 13, 2158-2440, 10.1177/21582440231179155 | |
| 12. | Fernando M. Camilo, Paulo J. Santos, Pedro J. Lobato, Sandrina B. Moreira, Optimization of Offshore Wind Power Generation in Response to the 2022 Extreme Drought in Portugal, 2023, 16, 1996-1073, 7542, 10.3390/en16227542 | |
| 13. | Leonir Vilani, Antonio Zanin, Mauro Lizot, Marcelo Gonçalves Trentin, Paulo Afonso, José Donizetti de Lima, A Framework for Investment and Risk Assessment of Agricultural Projects, 2024, 17, 1911-8074, 378, 10.3390/jrfm17090378 | |
| 14. | Jana Fabianová, Jaroslava Janeková, Gabriel Fedorko, Vieroslav Molnár, A Comprehensive Methodology for Investment Project Assessment Based on Monte Carlo Simulation, 2023, 13, 2076-3417, 6103, 10.3390/app13106103 | |
| 15. | Pietro Bonifaci, Sergio Copiello, Edda Donati, Budget constraints in critical scenarios: A position paper on the challenges to improving building performance, 2024, 12, 2333-8334, 751, 10.3934/energy.2024035 | |
| 16. | Douglas Eldo Pereira de Oliveira, Amanda Carvalho Miranda, Milton Vieira Junior, José Carlos Curvelo Santana, Elias Basile Tambourgi, Francesco Facchini, Raffaello Iavagnilio, Luiz Fernando Rodrigues Pinto, Economic and Environmental Feasibility of Cogeneration from Food Waste: A Case Study in São Paulo City, 2024, 16, 2071-1050, 2979, 10.3390/su16072979 | |
| 17. | Casper Boongaling Agaton, Real Options Analysis of Constructed Wetlands as Nature-Based Solutions to Wastewater Treatment Under Multiple Uncertainties: A Case Study in the Philippines, 2024, 16, 2071-1050, 9797, 10.3390/su16229797 | |
| 18. | Géremi Gilson Dranka, José Donizetti de Lima, Dalmarino Setti, Gilson Adamczuk Oliveira, Marcelo Gonçalves Trentin, Tânia Regina Sieminkoski Sirota, Paula Ferreira, Towards a rational framework for economic and risk assessment of energy efficiency projects, 2025, 73, 22131388, 104090, 10.1016/j.seta.2024.104090 | |
| 19. | José Donizetti de Lima, Rômel da Rosa da Silva, Géremi Gilson Dranka, Matheus Henrique Dal Molin Ribeiro, Luiz Fernando Puttow Southier, Introducing conditional expected loss: A novel metric for risk investment analysis, 2024, 0013-791X, 1, 10.1080/0013791X.2024.2431339 | |
| 20. | Reizaldi Gustino, Dzikri Firmansyah Hakam, Eko Agus Prasetio, Real options valuation for refinery and petrochemical investments: A feasibility study in Indonesia, 2025, 13, 23524847, 1321, 10.1016/j.egyr.2025.01.007 |
Figures(6) / Tables(10)

Géremi Gilson Dranka, Jorge Cunha, José Donizetti de Lima, Paula Ferreira. Economic evaluation methodologies for renewable energy projects[J]. AIMS Energy, 2020, 8(2): 339-364. doi: 10.3934/energy.2020.2.339

| Dimension | Indicator | Definition |
| Return [28,30] | PV=N∑t=1CFt(1+MRA)t | Present Value (PV) is the current value of a future amount of cash flows given a specified rate of return. |
| Return [28,30] | NPV=−|CF0|+PV | Net Present Value (NPV) is the present value of an investment's expected cash inflows minus the costs of acquiring the investment. |
| Return [28,30] | NPVA=NPV⋅[MRA⋅(1+MRA)N](1+MRA)N−1 | The Annualized Net Present Value (ANPV) is the monetary value resulting from the distribution of the NPV per period, for the lifetime of the investment. |
| Return [28,30] | BCR=PV|CF0| | The Benefit-Cost Ratio (BCR) represents the expected benefits per unit of capital invested in addition to the gain if the same capital had been applied at the rate of MRA. |
| Return [28,30] | ROIA=N√BCR−1 | Additional Return on Investment (ROIA) is a measure of the extra profit obtained from the investment. This indicator is analogous to the concept of EVA (Economic Value Added) measured in percentage. |
| Return [28,30] | IndexROIA/MRA=ROIAMRA | The ROIA/MRA index is the ratio of ROIA to MRA. This index measures the magnitude of the extra return on investment. It is the additional return provided by the decision to invest in the project. |
| Return [28,30] | ROI=(1+MRA)⋅(1+ROIA)−1 | Return On Investment (ROI) or Modified Internal Rate of Return (MIRR) represents the relation between the present value of cash flows and the necessary investments to implement the project. |
| Risk [28,30] | −|CF0|+N∑t=1CFt(1+IRR)t=0 | Internal Rate of Return (IRR) represents the discount rate at which the NPV of all the cash flows from an investment equal zero. |
| Risk [28,30] | Payback Minimum{j}such that: N∑t=1CFt(1+MRA)t≥|CF0| |
Period of time required to recover the investment (Payback). |
| Risk [28,30] | IndexMRA/IRR=MRAIRR | The MRA/IRR index is the ratio of MRA to IRR and represents a financial risk. |
| Risk [28,30] | IndexPayback/N=PaybackN | The Payback/N index is the ratio between payback and the planning horizon (N) and it can be interpreted as the risk of non-recovery the invested capital. This indicator improves the risk perception regarding the recovery of the invested capital. |
| Sensitivity Analysis [29,30] |
Δ%MRAmax↑=γ=IRRMRA−1 | Maximum variation1 of MRA: If positive, it indicates the maximum variation that the MRA supports before the investment becomes economically unfeasible. If negative, it indicates the variation that the MRA must undergo to make the investment economically viable. |
| Sensitivity Analysis [29,30] |
Δ%CF0_max↑=φ=BCR−1 | Maximum variation1 of Initial Investment (CF0) |
| Sensitivity Analysis [29,30] |
Δ%CFj_max↓=λ=1−1BCR | Maximum variation1 of Cash Flow (CFj) |
| Sensitivity Analysis [29,30] |
Δ%(MRAmax↑∩CF0_max↑)=ϕ=γ⋅φγ+φ | Maximum variation1 of MRA and CF0 |
| Sensitivity Analysis [29,30] |
Δ%(MRAmax↑∩CFj_max↓)=θ=γ⋅ϕγ+ϕ | Maximum variation1 of MRA and CFj |
| Sensitivity Analysis [29,30] |
Δ%(CF0_max↑∩CFj_max↓)=α=λ⋅φλ+φ | Maximum variation1 of CF0 and CFj |
| Sensitivity Analysis [29,30] |
Δ%(MRAmax↑∩CF0_max↑∩CFj_max↓)=ββ=λ⋅φ⋅γλ⋅φ+λ⋅γ+φ⋅γ | Maximum variation1 of MRA, CF0 and CFj |
| Real Options Analysis [32] | ROvalue=NPVexpanded−NPVtraditional | The Real Option Value (ROvalue) corresponds to the difference between the expanded NPV, which includes the value of management flexibility, and the traditional NPV, which does not value managerial flexibility. |
DownLoad:
CSV
|
|
DownLoad:
CSV
| Data | Values | Unit |
| Installed capacity | 7 | MW |
| Expected annual energy production | 36,792 | MWh |
| Investment costs | 31.5 | millions of R$ |
| Operating & maintenance costs—annual | 35,000 | R$ |
| Variable costs | 6 | R$/MWh |
| Feed-in tariff | 178.42 | R$/MWh |
| Annual discount rate | 8 | % |
| Remuneration period | 30 | years |
| Residual value | 8 | millions of R$ |
| Period of construction | 2 | years |
| PIS3 | 1.65 | (% over the annual gross revenue) |
| COFINS4 | 7.60 | (% over the annual gross revenue) |
| Service System Charge | 6 | (% over the annual gross revenue) |
| Administrative expenses | 0.5 | (% over the annual gross revenue) |
DownLoad:
CSV
| Variable | Values (thousands of R$) |
| Gross revenue | 6,564 |
| (-) PIS | 108 |
| (-) COFINS | 499 |
| Net revenue | 5,957 |
| (-) O & M | 221 |
| (-) Service System Charge | 394 |
| (-) Administrative expenses | 33 |
| (-) Depreciation | 1,050 |
| Cash flow before income tax and CSLL5 | 4,260 |
| (-) Income tax (IR) and CSLL | 1,448 |
| (+) Depreciation | 1,050 |
| Free cash flow | 3,861 |
DownLoad:
CSV
| Category | Indicator | Low | Low-Medium | Medium | Medium-High | High |
| Return | ROIA/MRA | 15.43 | ||||
| Risk | Payback/N | 46.67 | ||||
| Risk | MRA/TIR | 66.00 | ||||
| Scale | 0–20% | 20%–40% | 40%–60% | 60%–80% | 80%–100% | |
| Category | Indicator | High | Medium-High | Medium | Low-Medium | Low |
| Sensitivity Indicator | Δ%MRA | 51.50 | ||||
| Sensitivity Indicator | Δ%CF0 | 44.50 | ||||
| Sensitivity Indicator | Δ%CFj | 30.79 | ||||
| Scale | 0–20% | 20%–40% | 40%–60% | 60%–80% | 80%–100% |
DownLoad:
CSV
| 2009 | 2010 | 2013 | 2014 | 2015 | 2016 | 2009–2016 | |
| Minimum | 144.00 | 129.93 | 120.00 | 160.90 | 195.00 | 147.85 | 120.00 |
| Maximum | 144.00 | 154.49 | 139.20 | 162.50 | 207.64 | 235.00 | 235.00 |
| Mean | 144.00 | 146.54 | 134.52 | 161.97 | 204.63 | 204.69 | 178.42 |
| Standard deviation | - | 8.32 | 5.00 | 0.92 | 3.06 | 25.30 | 36.40 |
| Quantity | 1 | 11 | 23 | 3 | 15 | 40 | 93 |
DownLoad:
CSV
| 0 | 1 | 2 | 3 |
| R$ 53.58 | R$ 74.94 | R$ 104.83 | R$ 146.64 |
| R$ 38.30 | R$ 53.58 | R$ 74.97 | |
| R$ 27.38 | R$ 38.30 | ||
| R$ 19.57 |
DownLoad:
CSV
| 0 | 1 | 2 | 3 |
| Delay | Delay | Delay | Invest |
| Invest | Delay | Invest | |
| Do not invest | Do not invest | ||
| Do not invest |
DownLoad:
CSV
| Dimension | Indicator | Definition |
| Return [28,30] | PV=N∑t=1CFt(1+MRA)t | Present Value (PV) is the current value of a future amount of cash flows given a specified rate of return. |
| Return [28,30] | NPV=−|CF0|+PV | Net Present Value (NPV) is the present value of an investment's expected cash inflows minus the costs of acquiring the investment. |
| Return [28,30] | NPVA=NPV⋅[MRA⋅(1+MRA)N](1+MRA)N−1 | The Annualized Net Present Value (ANPV) is the monetary value resulting from the distribution of the NPV per period, for the lifetime of the investment. |
| Return [28,30] | BCR=PV|CF0| | The Benefit-Cost Ratio (BCR) represents the expected benefits per unit of capital invested in addition to the gain if the same capital had been applied at the rate of MRA. |
| Return [28,30] | ROIA=N√BCR−1 | Additional Return on Investment (ROIA) is a measure of the extra profit obtained from the investment. This indicator is analogous to the concept of EVA (Economic Value Added) measured in percentage. |
| Return [28,30] | IndexROIA/MRA=ROIAMRA | The ROIA/MRA index is the ratio of ROIA to MRA. This index measures the magnitude of the extra return on investment. It is the additional return provided by the decision to invest in the project. |
| Return [28,30] | ROI=(1+MRA)⋅(1+ROIA)−1 | Return On Investment (ROI) or Modified Internal Rate of Return (MIRR) represents the relation between the present value of cash flows and the necessary investments to implement the project. |
| Risk [28,30] | −|CF0|+N∑t=1CFt(1+IRR)t=0 | Internal Rate of Return (IRR) represents the discount rate at which the NPV of all the cash flows from an investment equal zero. |
| Risk [28,30] | Payback Minimum{j}such that: N∑t=1CFt(1+MRA)t≥|CF0| |
Period of time required to recover the investment (Payback). |
| Risk [28,30] | IndexMRA/IRR=MRAIRR | The MRA/IRR index is the ratio of MRA to IRR and represents a financial risk. |
| Risk [28,30] | IndexPayback/N=PaybackN | The Payback/N index is the ratio between payback and the planning horizon (N) and it can be interpreted as the risk of non-recovery the invested capital. This indicator improves the risk perception regarding the recovery of the invested capital. |
| Sensitivity Analysis [29,30] |
Δ%MRAmax↑=γ=IRRMRA−1 | Maximum variation1 of MRA: If positive, it indicates the maximum variation that the MRA supports before the investment becomes economically unfeasible. If negative, it indicates the variation that the MRA must undergo to make the investment economically viable. |
| Sensitivity Analysis [29,30] |
Δ%CF0_max↑=φ=BCR−1 | Maximum variation1 of Initial Investment (CF0) |
| Sensitivity Analysis [29,30] |
Δ%CFj_max↓=λ=1−1BCR | Maximum variation1 of Cash Flow (CFj) |
| Sensitivity Analysis [29,30] |
Δ%(MRAmax↑∩CF0_max↑)=ϕ=γ⋅φγ+φ | Maximum variation1 of MRA and CF0 |
| Sensitivity Analysis [29,30] |
Δ%(MRAmax↑∩CFj_max↓)=θ=γ⋅ϕγ+ϕ | Maximum variation1 of MRA and CFj |
| Sensitivity Analysis [29,30] |
Δ%(CF0_max↑∩CFj_max↓)=α=λ⋅φλ+φ | Maximum variation1 of CF0 and CFj |
| Sensitivity Analysis [29,30] |
Δ%(MRAmax↑∩CF0_max↑∩CFj_max↓)=ββ=λ⋅φ⋅γλ⋅φ+λ⋅γ+φ⋅γ | Maximum variation1 of MRA, CF0 and CFj |
| Real Options Analysis [32] | ROvalue=NPVexpanded−NPVtraditional | The Real Option Value (ROvalue) corresponds to the difference between the expanded NPV, which includes the value of management flexibility, and the traditional NPV, which does not value managerial flexibility. |
|
|
| Data | Values | Unit |
| Installed capacity | 7 | MW |
| Expected annual energy production | 36,792 | MWh |
| Investment costs | 31.5 | millions of R$ |
| Operating & maintenance costs—annual | 35,000 | R$ |
| Variable costs | 6 | R$/MWh |
| Feed-in tariff | 178.42 | R$/MWh |
| Annual discount rate | 8 | % |
| Remuneration period | 30 | years |
| Residual value | 8 | millions of R$ |
| Period of construction | 2 | years |
| PIS3 | 1.65 | (% over the annual gross revenue) |
| COFINS4 | 7.60 | (% over the annual gross revenue) |
| Service System Charge | 6 | (% over the annual gross revenue) |
| Administrative expenses | 0.5 | (% over the annual gross revenue) |
| Variable | Values (thousands of R$) |
| Gross revenue | 6,564 |
| (-) PIS | 108 |
| (-) COFINS | 499 |
| Net revenue | 5,957 |
| (-) O & M | 221 |
| (-) Service System Charge | 394 |
| (-) Administrative expenses | 33 |
| (-) Depreciation | 1,050 |
| Cash flow before income tax and CSLL5 | 4,260 |
| (-) Income tax (IR) and CSLL | 1,448 |
| (+) Depreciation | 1,050 |
| Free cash flow | 3,861 |
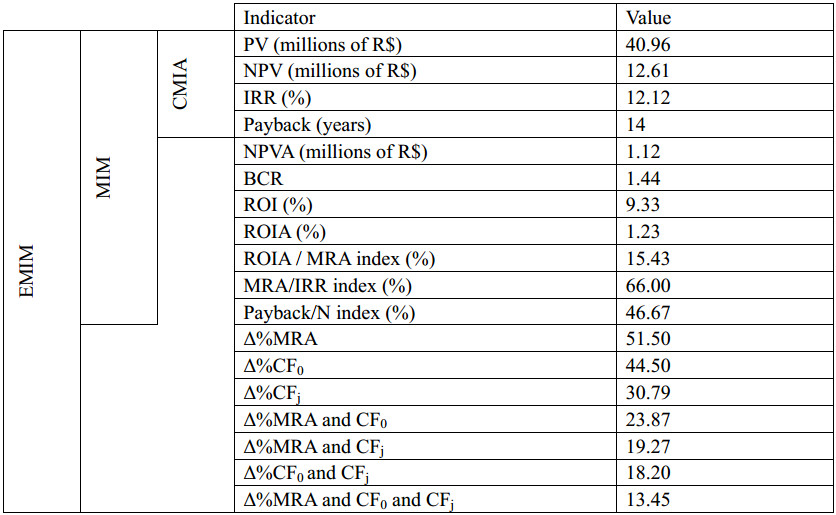
|
| Category | Indicator | Low | Low-Medium | Medium | Medium-High | High |
| Return | ROIA/MRA | 15.43 | ||||
| Risk | Payback/N | 46.67 | ||||
| Risk | MRA/TIR | 66.00 | ||||
| Scale | 0–20% | 20%–40% | 40%–60% | 60%–80% | 80%–100% | |
| Category | Indicator | High | Medium-High | Medium | Low-Medium | Low |
| Sensitivity Indicator | Δ%MRA | 51.50 | ||||
| Sensitivity Indicator | Δ%CF0 | 44.50 | ||||
| Sensitivity Indicator | Δ%CFj | 30.79 | ||||
| Scale | 0–20% | 20%–40% | 40%–60% | 60%–80% | 80%–100% |
| 2009 | 2010 | 2013 | 2014 | 2015 | 2016 | 2009–2016 | |
| Minimum | 144.00 | 129.93 | 120.00 | 160.90 | 195.00 | 147.85 | 120.00 |
| Maximum | 144.00 | 154.49 | 139.20 | 162.50 | 207.64 | 235.00 | 235.00 |
| Mean | 144.00 | 146.54 | 134.52 | 161.97 | 204.63 | 204.69 | 178.42 |
| Standard deviation | - | 8.32 | 5.00 | 0.92 | 3.06 | 25.30 | 36.40 |
| Quantity | 1 | 11 | 23 | 3 | 15 | 40 | 93 |
| 0 | 1 | 2 | 3 |
| R$ 53.58 | R$ 74.94 | R$ 104.83 | R$ 146.64 |
| R$ 38.30 | R$ 53.58 | R$ 74.97 | |
| R$ 27.38 | R$ 38.30 | ||
| R$ 19.57 |
| 0 | 1 | 2 | 3 |
| R$ 21.25 | R$ 38.15 | R$ 65.67 | R$ 105.67 |
| R$ 7.28 | R$ 15.72 | R$ 33.98 | |
| R$ 0.00 | R$ 0.00 | ||
| R$ 0.00 |
| 0 | 1 | 2 | 3 |
| Delay | Delay | Delay | Invest |
| Invest | Delay | Invest | |
| Do not invest | Do not invest | ||
| Do not invest |
