Citation: Mesude Bayrakci Boz, Kirby Calvert, Jeffrey R. S. Brownson. An automated model for rooftop PV systems assessment in ArcGIS using LIDAR[J]. AIMS Energy, 2015, 3(3): 401-420. doi: 10.3934/energy.2015.3.401
[1] | Jin H. Jo, Zachary Rose, Jamie Cross, Evan Daebel, Andrew Verderber, John C. Kostelnick . Application of Airborne LiDAR Data and Geographic Information Systems (GIS) to Develop a Distributed Generation System for the Town of Normal, IL. AIMS Energy, 2015, 3(2): 173-183. doi: 10.3934/energy.2015.2.173 |
[2] | Michael O. Dioha, Atul Kumar . Rooftop solar PV for urban residential buildings of Nigeria: A preliminary attempt towards potential estimation. AIMS Energy, 2018, 6(5): 710-734. doi: 10.3934/energy.2018.5.710 |
[3] | Jin H. Jo, Kadi Ilves, Tyler Barth, Ellen Leszczynski . Implementation of a large-scale solar photovoltaic system at a higher education institution in Illinois, USA. AIMS Energy, 2017, 5(1): 54-62. doi: 10.3934/energy.2017.1.54 |
[4] | Chris Thankan, August Winters, Jin Ho Jo, Matt Aldeman . Feasibility of applying Illinois Solar for All (ILSFA) to the Bloomington Normal Water Reclamation District. AIMS Energy, 2021, 9(1): 117-137. doi: 10.3934/energy.2021007 |
[5] | Nadwan Majeed Ali, Handri Ammari . Design of a hybrid wind-solar street lighting system to power LED lights on highway poles. AIMS Energy, 2022, 10(2): 177-190. doi: 10.3934/energy.2022010 |
[6] | Guy M. Toche Tchio, Joseph Kenfack, Joseph Voufo, Yves Abessolo Mindzie, Blaise Fouedjou Njoya, Sanoussi S. Ouro-Djobo . Diagnosing faults in a photovoltaic system using the Extra Trees ensemble algorithm. AIMS Energy, 2024, 12(4): 727-750. doi: 10.3934/energy.2024034 |
[7] | Amer Braik, Asaad Makhalfih, Ag Sufiyan Abd Hamid, Kamaruzzaman Sopian, Adnan Ibrahim . Impact of photovoltaic grid-tied systems on national grid power factor in Palestine. AIMS Energy, 2022, 10(2): 236-253. doi: 10.3934/energy.2022013 |
[8] | Kaovinath Appalasamy, R Mamat, Sudhakar Kumarasamy . Smart thermal management of photovoltaic systems: Innovative strategies. AIMS Energy, 2025, 13(2): 309-353. doi: 10.3934/energy.2025013 |
[9] | Md. Mehadi Hasan Shamim, Sidratul Montaha Silmee, Md. Mamun Sikder . Optimization and cost-benefit analysis of a grid-connected solar photovoltaic system. AIMS Energy, 2022, 10(3): 434-457. doi: 10.3934/energy.2022022 |
[10] | Austin Bushur, Kevin Ward, Tommy Flahaven, Tom Kelly, Jin H. Jo, Matt Aldeman . Techno-economic evaluation of installing EV and PV combined infrastructure on Academic Institution’s Parking Garages in Illinois, USA. AIMS Energy, 2019, 7(1): 31-45. doi: 10.3934/energy.2019.1.31 |
More than 60% of people live in urban environments resulting in higher energy density of consumption in these areas, especially during the day [1]. In many localities, city governments and community leaders are developing and implementing strategic guidelines and policies in order to coordinate energy efficiency improvements with higher rates of renewable energy use for buildings. Renewable energy has received much attention since these forms of energy do not generate greenhouses gases, act as distributed generation (DG) system, assist in national energy security, and improve long-term economic growth [2]. Among possible options to generate renewable energy, photovoltaic (PV) systems have proven to be safe and sustainable [3]. PV systems have the potential to meet urban energy demands while alleviating congestion on urban grid infrastructures [4]. In order to facilitate informed planning and investment decisions, it is important to develop efficient and accurate geospatial frameworks from which to assess and classify rooftops for PV systems across large urban areas. While rooftop assessment tools for PV are currently expanding, these tools need to be replicable and scalable to entire cities.
Although annual or monthly budgets for global horizontal solar irradiation are valuable in general estimates of solar potential across urban areas, the amount of the solar resource is not the critical parameter for determining project success. Indeed, the availability and feasibility of renewable energy across space are subject to various limitations on technology implementation. As such, potential areas for renewable energy production are typically classified according to these limitations. While Voivontas et al. [5], for example, have classified renewable energy potential into the four categories of theoretical, available, technical, and economic potential, Izquierdo et al. [6] have added social potential to this existing hierarchy. These classification systems have since been implemented into a geographic information system (GIS) using Multi-Criteria Analysis (MCA), and have accordingly prompted further discussions about solar potential estimations using GIS [7,8]. Several scholars have built upon this early work, taking into consideration factors such as population, shading, and climate[9,10]. In order to estimate and locate available roof area for PV systems, different models have been developed which use aerial imagery and GIS tools [11,3,12,13,14,15]. Denholm and Margolis [16] have designed a procedure using data on oor space and concluded that the average roof availability in residential buildings of 27% and 22% for warmer regions and cooler regions, respectively. The availability for commercial buildings is 60% for warmer regions and 65% for cooler regions.The solar potential models have been evaluated by Freitas et al. [17], Angelis Dimakis et al. [18] and Melius et al. [19].
As an alternative to sampling imagery or cadastral data, recent research has taken advantage of more widely available Light Detection and Ranging (LIDAR) technology in order to assess solar potential. Lukac et al. [20] have created a rating of roof surfaces within Maribor, Slovenia, based on the surfaces solar potential and suitability for installation. To do so, they used LIDAR to extract the urban topography by calculating normal vectors of the surfaces for each point within each cell; they also took pyranometer measurements of global and diffuse solar irradiances. Finally they used spatial multi-resolution shadowing by nearbybuilding or surrounding terrain that is performed on the constructed regular grid using Suns position in Cartesian coordinates. Lukac et al. [21] have likewise demonstrated how to use graphics processing units based on compute unified device architecture (CUDA) technology using LIDAR in order to calculate solar potential within a reasonable time. Also, Huang et al. [22] have shown how suitable positions for solar installation can be located by creating triangular irregular networks and digital surface models with LIDAR. Recognizing that conditions may not always be ideal, Jacques et al. [23] and Gooding et al. [24] have developed a methodology for assessing PV capacity using low-resolution LIDAR data. Other researchers have considered the varying surfaces available for solar installation. While Voegtle at al. [25] have used triangular irregular networks to represent surfaces, Jochem et al. [26] have used LIDAR to calculate solar potential while taking into account the shadowing effects of nearby objects and the effects of clouds. Santos et al. [27] have used LIDAR, GIS, and PVGIS to create elevation and digital surface models, which help to determine power production. Shading has also been an area of consideration for researchers. Levinson et al. [28], for example, have used LIDAR and high-resolution orthophotos to characterize residential rooftop shading, with GIS used for elevation and shadow rasters. Kassner et al.[29] have used LIDAR data, CAD models, and GIS to calculate solar potential. Nguyen et al. [30] have developed a methodology for assessing PV potential using LIDAR data, MATLAB, and GIS. Li et al. [31] have used LIDAR, r.sun which is solar irradiation and irradiance model, and a 3D city building model to calculate solar potential, finding that roof complexity is the dominant determinant of PV potential. Also, ESRI's Solar Analyst Toolbox has been commonly used to estimate solar potential [32,33,34]. Finally, Melius et al. [19] suggest a new method that uses LIDAR and building data in order to estimate ideal rooftop space. They created roof planes based on aspect, and calculated zonal average slope for these planes in ArcGIS. For the shading, hill shade tool in ArcGIS was applied for March 21, June 21, September 21 and December 21. Also, System Advisor Model (SAM) is used to estimate the total number of daylight hours a rooftop in a specific region would need to be in sunlight to produce 80% generation. The results of this method include unshaded roof spaces and roof orientation information. The researchers have planned to apply this method to 120 U.S. cities by the end of 2014 and documentation of it will be made available by the fall of 2015.
Although considerable progress has been made to provide spatial decision support for PV development in urban areas, the methodologies described in above are limited in terms of their capacity to accurately represent urban surfaces. In many cases, assumptions about rooftop orientation and slope are required. Where LiDAR data have been used to fill these gaps, the other important challenge is automation. That is, research to date has been very site-specific and not focused on establishing automated models that might be shared and used in other locations, by other researchers.
The purpose of this paper is to fill these gaps, while at the same time providing critical information for the city of Philadelphia, PA, USA. An automated model using ArcGIS and the Python programming language is developed to locate and classify rooftop segments across a large urban area for the purpose of large-area solar energy estimation and planning. LIDAR data are combined with building footprint data in order to obtain topographic data, characterize rooftops in terms of slope and aspect (or azimuth in the solar community) and estimate direct beam shading caused by nearby objects and surrounding terrain for each month. The model is used to identify suitable roofs based on a multi-criteria spatial analysis. Data processing and multi-criteria spatial analysis has been integrated into a single model. The python script was built using ArcGIS ModelBuilder. The script was then applied using data from Philadelphia, PA. This model permits the methodology to be replicated in any city where appropriate data are available, and where ArcGIS is available. In this study radiation data are not included and energy production is not calculated, however we have selected initial example criteria for binning important solar PV parameters such as aspect (azimuth) and slope (tilt) based upon irradiance sensitivity noted in the solar literature. These criteria are easily modified and adapted to fit the evaluation context of appropriate planning body, and as such future teams will be able to use this model in customized research using different radiation models and PV technologies.
The city of Philadelphia in PA, U.S.A (39°57′12″N 75°10′12″W) was selected as a case study. Philadelphia has been chosen for this study for several reasons. First, there are many policies and programs in place in Philadelphia such as Greenworks and SolarCityPartnership that encourage renewable energy development in the city [35,36]. Secondly, Philadelphia is a large urban area, all of whose necessary data is available online, and yet a comprehensive assessment of solar potential has not yet been undertaken.
All data used in this study are summarized in Table 1. The city limits of Philadelphia were used to clip all data. A LAS file is an industry format for the interchange of LIDAR data. In total, 1, 041 LAS files were downloaded, and the files were combined into one LAS dataset using ArcGIS tools. Figure 1 shows all the LAS files and building footprint for Philadelphia, PA.
Dataset | Data Source | Data of Release | Format | Fields/Information |
City Limits Data | PASDA1 | 2000 | Polygon | Area and perimeter |
1.Data collection performed over the City of Philadelphia, PA in April of 2010 | ||||
LIDAR Data | PASDA | 2010 | LAS files | 2.Point density 6 points/m2 |
3.Point classi cation values; scan angle; additional RGB values;scan direction; edge of ight line; user data; point source ID; and waveform information | ||||
Building Footprint Data | PASDA | 2007 | Polygon | ID number, elevation, area perimeter, source, length |
Parcels Data | PASDA | 2013 | Polygon | ID, house number, area street direction, street name |
Land Use Data | PASDA | 2010 | Polygon | 9 class: residential, commercial, industrial, cultural/recreation, civic/institutions, transportation, vacant/other,water, park/open space |
Aerial Photography | PASDA | 2010 | Raster | Consist of tiled orthogonal images |
1 Pennsylvania Spatial Data Access[37] |
This study develops a model in ArcGIS which can automate the process of identifying rooftop segments that are suitable for PV installation. Three key parameters are considered: slope (tilt), aspect (azimuth), and shading. The workflow of the model is shown in Figure 2. All geo-processing steps were conducted within the ArcGIS environment unless otherwise specified.
The analysis is based on a digital surface model (DSM) with a 1 meter cell size which was generated using maximum value within the cell (see Figure 3). The maximum value is used since it is best for biasing the result to higher elevations when making a DSM [38]. The DSM was then processed in order to focus only on rooftops. First, a 1-meter buffer was applied to the building footprint data. This helped to remove noise in data, since LIDAR data may not be accurate near the roof edges, and also delineated a more appropriate surface since roof edges do not support PV panels. Indeed, there are standards for different type of roofs that say it should be at least 3 foot wide clear access pathway from the ridge for firefighters to get the ridge of the roof for ventilation [39]. Next, the buffered building footprint data and parcels data were intersected. As shown in Figure 3c,one parcel can contain many buildings. On the othe hand, one big building footprint can contain may building parcels too; the intersection process helped to define each building separately. Finally, the output file from the intersection process was used to clip DSM.
The criteria for classifying the and slope (tilt) and aspect (azimuth) in the rooftop orientations may be selected and modified according to the criteria of concern by the decision-making body. In our case study, we have deferred to the criteria affecting decadal decreases in irradiance (-10 % class) from the annual peak optimum, noted within the core research observations of Christensen and Barker from 2001 [40].
Slope refers to the steepness of a surface. A value of 0 degrees is equivalent to no slope ( at), while a value of 90 degrees indicates a surface that is completely vertical. The slope of a surface is calculated using the maximum change in elevation from a given cell to its eight neighboring cells [41]. After calculating slope in the Spatial Analyst toolbox, a classification system was devised to organize these results according to their suitability for PV system implementation (Table 2). Although many previous studies usually identify two classes- flat (< 10 or 20) and sloped roof (> 10 or 20 -60)- more accurate results can be obtained by using a more disaggregated classification rather than just two classes [42,33]. These classifications are important when identifying suitable areas since the optimal slope of a surface for PV systems changes with latitude. It is important to note that the calculation of slope might vary across a roof with the same actual slope due to some error in input (LiDAR) data and algorithm function. This is because sometimes a pulse can hit an object in the sky or on the roof while LIDAR data are being collected. In order to minimize the possibility of this occurring, the Majority Filter was used to replace cell values based on the majority of the cells contiguous eight neighboring cells. Next, since the file is raster format, the Raster to Polygon Tool in the Conversion Toolbox was used to convert the file to polygon format with slope values. If the area of the polygon was smaller than 10 square meters, the polygon was combined with the polygon next to it. The reason for combining the polygons is that there is a minimum area requirement for PV installations. It can depend on total roof area and state rules, but it is usually around 10 square meters [43]. The results of the overall slope analysis can be seen in Figure 3d.
Slope Value (Degree) | Class |
0-10 | Class 1 |
10-20 | Class 2 |
20-30 | Class 3 |
30-40 | Class 4 |
40-50 | Class 5 |
50-60 | Class 6 |
60-90 | Class 7 |
Aspect refers to the direction in which the slope faces. It is measured in degrees, moving clockwise from 0 to 360. A value of 0 is north, 90 is east, 180 is south and 270 is west. If a given rooftop is at, the aspect is given a value of -1.The aspect tool of the Spatial Analyst Toolbox was used to obtain aspect values from DSM. The resulting aspect file was reclassified into 5 classes. These classes are shown in Figure 4.
After classification, the majority filter was applied to remove data noise, so a single value for a given roof segment was provided. Then a polygon layer was created based on the classifications. If the area was smaller than 10 square meters, it was combined with the polygon next to it as described in previous section. The results of the overall slope analysis can be seen in Figure 3e.
The slope polygon layer was divided into seven classes, the first class representing a at roof. If the slope was greater than 60 degrees, the polygon was eliminated since it is not ideal for PV rooftop panels. Next, the slope polygon layer and aspect polygon layer were intersected using the intersect tool in the Analysis Toolbox. Land use and parcel shapefiles were intersected with the aspect-slope output polygon layer. This resulted in the creation of a new polygon layer that represents rooftop segments and includes polygon ID, parcel ID, aspect, slope, land use, and area information (Figure 3f).
Shading analysis is an important step for calculating PV potential, since shading can signi ficantly reduce a “systems” power generation. This type of analysis is used to determine the optimal location for PV panels and to ensure sufficient energy production. Shadows cast by structures vary in length and direction throughout the day and from season to season, making it extremely difficult to perform shading analyses for each day of the year. However, it is possible to estimate the average irradiation loss for each month of the year by using one day if the irradiation on that day is closest to the average for the month. In this study, the Area Solar Radiation (ASR) tool in ArcGIS was used to perform shading analysis. In the ASR model, the Digital Surface Model (DSM) serves as the input data; a specific period of time, time interval for calculations, and latitude and longitude function as parameters; and the levels of irradiation, direct irradiation, and diffuse irradiation, as well as the number of sun hours, are outputs [44,45]. ASR is run for each hour during a day that is representative of each month. For this study, the 21st day of each month. This manner of calculation allows for the inclusion of solstices and equinoxes.
The DSM was created from all of the LIDAR data, without any clipping, in order to account for shading on roof surfaces was used as an input. The latitude and longitude values for Philadelphia have been used as a input, therefore the shading times relate only to Philadelphia and these values must be changed in order to apply the model to other cities. The ASR tool was used each hour on the 21st day of each month. One of the outputs was the duration (hours) of direct solar irradiation on each grid cell in the DSM. This output file was subsequently reclassified to create a file containing all cells with a duration between 0 and 0.5 hours or between 0.5 and 1 hours. These hours were reclassified: if the duration was between 0 and 0.5 hours, it was assigned a value of 0 (shading, or no sun). If the duration was between 0.5 to 1 hours, it is assigned a value of 1 (no shading, or solar access) (Figure 3g). Next, the clip tool was used to focus these outputs with the rooftop polygons that had been created before and that intersected with the rooftop polygon layer. Sub-segments based on shading were created in the rooftop segments layer, and the shading field was added to the attribute table. Finally, a polygon layer that represents rooftops segments was created for each hour of 21st day of each month. Each rooftop segment includes the slope and aspect values and shows shading areas with sub-segments of roofs. Also, the area, the land use, and parcel ID numbers were available. Only, one layer has been shown (Figure 3h) for rooftop segments and all these layers will be used in the future.
The running process of all 1041 LAS files could take an inordinate amount of time to complete, so the City of Philadelphia was separated into 45 parts using a census tract. Each part corresponds to around 20 LAS files. Therefore, these parts can run in different computers at the same time. After all parts are modeled, they are stitched together in order to obtain final maps.
Several filters can be applied for deciding suitable areas. The area, slope, aspect and solar irradiation and shading should be evaluated for selecting locations for solar PV panels. Different filters can be applied in order to decide these areas using the attributes that were created in the previous sections. In this study, the desired requirements are as follows and summarized in Table 3:
Parameter | Value |
Area | 20m2 ≤ Area ≤ 100m2 for residential PV system size |
100m2 < Area ≤ 10000m2 for commercial PV system size | |
Aspect | 135° ≤ Aspect ≤ 225° or Flat |
Shading | No shading between 9.00 am to 3.00 pm at the summer solstice |
No shading between 10.00 am to 2.00 pm at the winter solstice | |
Slope | 20 < Slope ≤ 60 : Rate1 |
0 ≤ Slope ≤ 20 : Rate2 |
· Area: The residential PV system size in the U.S.A is between 2-10 kWP DC while the commercial PV systems size may be between 10 kWP DC and 1000 kWP DC [46,47]. The average area for 1 kWP DC is around 10 square meter [48]. Therefore, between 20 and 100 square meter areas are chosen for residential size PV systems and between 100 and 10000 square meter areas are chosen for commercial size PV systems.
· Aspect: Between 135 and 225 degree were selected roof segment polygon facing south, southeast, and southwest can collect higher energy and at roof segments since most of PV panels are installed in at roofs due to the southward direction.
· Shading: Avoiding shade 100% of the time is not always possible given space constraints on buildings and land. However, the solar irradiance on a day is highest between 9 am and 3 pm during the summer solstice and between 10 am and 2 pm during the winter solstice. Therefore, the roof segments that are not shaded during these times were selected.
· Slope: Philadelphia receives the most perpendicular sunlight when a PV is facing south and the slope is 5 degrees less than the latitude, 39 degrees [49]. However, this precise condition is not always the best option, and different slope values can be used. Research by Christensen and Barker [40] has determined that only -10% of irradiation (annual) is lost between 20 and 60 slope at a latitude of 42N. Therefore, a rating assessment was made based on slope. The polygons are categorized within a rating list of two categories;
-20 < Slope ≤ 60 : Rate1
-0 ≤ Slope ≤ 20 : Rate2
The Raster Calculator and Boolean Operator AND were used to decide suitable locations based on these criteria. First, suitable polygons based on area and aspect were found and saved as a new file. Then the Raster calculator and Boolean Operator AND were used to decide the polygons that fulfill shading requirements for winter and summer. Finally, each polygon categorized based on its slope.
The first results obtained were those pertaining to the rooftop segments. The success of the roof segmentation process was verified by comparison to aerial imagery. 150 rooftop were analyzed and the results show that simple roof structures lead to the most precise results (Figure 5a). For more complicated roofs, however, more polygons than necessary may be created (Figure 5b). The areas along roof ridges can cause problems in this regard. For example, slope calculations may cause undesirable at areas around roof ridges. This is because the points are positioned on the opposite sides of roof and have absolute heights, which lead to the false identification of slopes and create at areas (Figure 5c). Likewise, some very small chimneys and other features of the roofs may not be able to be represented as polygons (Figure 5d). All these limitations can be reduced with higher point densities.
After the method was applied to Philadelphia, 1, 059, 801 rooftop segments were identified. The distribution of slope among rooftop segments is reported in Figure 6 for residential buildings, commercial buildings, industrial buildings civic/intuitions, cultural/recreation and other buildings. Residential, commercial and industrial buildings mostly have at or Class 2 rooftop. These low slopes enable PV system owners to adjust their panels with slope they want. Next, Slope Class 2 (10-20 degrees) is common in Philadelphia. Civic and cultural buildings, however, have many rooftop segments with steeper slopes, likely because these buildings were designed for aesthetic purposes, with very complex structures.
The distribution of rooftop segments into each aspect class is shown in Figure 7. These results show that there is clear preference for the orientation of residential and commercial buildings. Flat roof or around 10 degree slope is common, making them particularly well-suited for PV installation. Also, industrial buildings mostly have class 1, but it has still wider distribution than commercial and residential buildings. Clearly, civic/institutions and cultural/recreation buildings are much more complex. In general, they have more rooftop segments with greater variability in terms of aspect. This complexity is a challenge for modeling as well as for PV system implementation.
Figure 8 shows the histogram of the areas of rooftop segments for residential, commercial, industrial, civic/intuitions, cultural/recreation and other buildings. As the histogram suggests, most of the areas are around 50 and 100 m2 for residential buildings and around 50 and 250 m2 for commercial and industrial buildings. Even there were no very large are rooftop segments, these numbers are good for average PV system size. On the other hand, civic/intuitions, cultural/recreation and other buildings have very large rooftop segments even though their number is little.
The distribution of rooftop segments across four distinct PV system size categories is shown in Figure 9. The number of rooftop segments suitable for residential-size PV systems is 350, 109 with a total area of 13.886 km2 while there are 20, 796 segments suitable for commercial-size systems with a total area of 7.170 km2. Residential-size PV systems are common across the city since there are many residential buildings and some commercial, industrial, and civic or institutional buildings in the city have smaller areas than usual. Commercial-size PV systems are not as common as residential-size PV systems, yet the area suitable for these systems represents one-third of the total suitable area. This is because commercial systems are installed mostly in commercial, industrial, and civic or institutional buildings, and these buildings tend to have larger space on their roofs. Moreover, the slope and aspect of the systems can be changed since the roof structures are simple and regular. Some rooftop segments of cultural and recreational buildings seem suitable for the installation of PV systems, but gaining permission can be difficult due to the building type. Finally, complex rooftop structures are not appropriate for the installation of PV systems. Table 4 summarizes the number and area of buildings within each category and Table 5 summarizes the findings of suitable areas for PV systems in the literature.
Building Footprint Area [km2] |
Rooftop Segments Area[km2] |
Suitable Area for Residential Size PV Systems[km2] |
Suitable Area for Commercial Size PV Systems[km2] |
Percent of Total Building Footprint Suitable Area for PV Systems[%] |
Percent of Total Rooftop Suitable Area for PV Systems[%] |
|
Residential | 38.505 | 25.827 | 11.414 | 0.790 | 31.7 | 47.3 |
Commercial | 6.943 | 5.115 | 1.014 | 1.523 | 36.5 | 49.6 |
Industrial | 10.566 | 8.152 | 0.928 | 3.651 | 43.3 | 56.2 |
Civic/Institutions | 4.617 | 3.159 | 0.403 | 0.960 | 29.5 | 43.1 |
CulturealRecreation | 0.834 | 0.532 | 0.058 | 0.129 | 22.5 | 35.2 |
Other/Vacant | 1.040 | 0.527 | 0.069 | 0.117 | 17.9 | 35.3 |
Total | 62.506 | 43.312 | 13.886 | 7.170 | 33.7 | 48.6 |
This Study |
Denholm and Margolis [16] |
Anders and Bialek [14] |
Compagnon [13] |
Hofierka and Kanuk [50] |
Suziki [11] |
Nguyen and Pearce [15] |
||
Building Footprint |
Rooftop | |||||||
Residential | 31.7 | 47.3 | 22%-27% | 35% | ||||
Commercial | 36.5 | 49.6 | 60%-65% | |||||
Industrial | 43.3 | 56.2 | ||||||
Civic/Institutions | 29.5 | 43.1 | ||||||
CulturealRecreation | 22.5 | 35.2 | ||||||
Other/Vacant | 17.9 | 35.3 | ||||||
Total | 33.7 | 48.6 | 12.6% | 6.5%-21% | 59% | 50%-100% | 33% |
There is a comprehensive sustainability plan in place for the city of Philadelphia. It is called Greenworks and is based on the work of the 2007 Local Action Plan for Climate Change. The plan's five goals fall into the categories of Energy, Environment, Equity, Economy, and Engagement, and include fifteen measurable targets within these categories as well as 164 initiatives. All targets are designed to be achieved by 2015. Target 4 reads: Purchase and Generate 20 Percent of Electricity Used in Philadelphia from Alternative Energy Sources. Renewable energy production doubled in 2013, reaching 11, 402 MWh [35]. Also, there is a partnership between United States Department of Energy and the City of Philadelphia called the Solar City Partnership. The aim of this partnership is to have 2.3 MW of solar electricity generated by 2011 and 57.8 megawatts by 2021 [36]. Figure 10 provides an overview of the spatial distribution of suitable rooftops across the city of Philadelphia based on the criteria listed in the methods section. As can be seen, suitable areas are evenly distributed across the city. There is some empty places result of park spaces or rivers. According to this analysis and typical area-based production figures, there is 21.056 km2 suitable area and approximately 800 MW potential across the city of Philadelphia. Only 2% percent of the suitable area is required in order for Greenworks to meet its target. Residential- and commercial-size PV systems can help the Solar City Partnership to meet its aim by providing its entire target.
The assessment took a total of 20 minutes for one LAS file (which covers approximately 0.6 km2)using PC with 2.9 Ghz Intel Core i7 and 8GB 1600 MHz DDR3. Creating the final polygon layer through intersections required approximately three minutes of processing time; 14 minutes for the shading analysis; and 3 minutes for the finding of suitable areas. Shading analyses take substantial time since Area Solar Radiation takes times to run. If the DSM is large, it can take days to run. Also, if there are many buildings footprint data, clipping DSM with this data may take time. Computational time is a limitation of this study, which is compounded with higher volumes of input data. The cell size is 1 meter in this study. Using lower resolution may reduce the processing time, however the accuracy of the results would likely be reduced.
Also, census tract is used in order to create groups of LAS files. The census block datas borders are middle of the streets.Therefore, any building or vegetation is not split off and most of shading is considered. However, the shading effects of very tall buildings to nearby buildings can not be captured in a method of nature and it is unavoidable. Additionally, the horizon to the south of city has not been modeled since Philadelphia, PA does not have any significant topographic features to the south that would limit solar irradiation. If a city has significant topographic features to the south, the DSM should be created for the surrounding area in order to account for this macro-scale shading.
These results can be used with a techno-economic model such as SAM in order to calculate power production and evaluate financial options. Additionally, all results can be summarized at different scales (e.g. by focusing on a specific neighborhood, the area surrounding a specific hub in the electricity distribution system, or a specific rooftop). For this reason, the data generated offers a critical starting point for PV policy, planning and implementation decisions.
This study provides a method for extracting rooftop segments based on slope and aspect using LIDAR data, ArcGIS tools, and building footprint data. The python programming language is used to automate the model using ArcGIS. Additionally, it evaluates the extracted rooftop segments considering shading from nearby objects and the general topography. Here, we applied the methodology to city of Philadelphia, with validation of 150 rooftop by comparison to aerial photographs. This study identifies suitable roofs using a multi-criteria spatial analysis for PV systems for Philadelphia. In order to identify suitable areas, area, slope, aspect, and shading requirements were defined and applied. It was found that 33.7% of building footprint data and 48.6 % rooftop areas are suitable for PV systems.
Assessment of rooftop PV potential is a crucial step for electricity system operators, policymakers, and homeowners who want to install PV systems on their roofs. By assessing rooftop PV potential and suitable areas for development across wide geographic areas as in this study, electricity operators and system planners have tools that can help them to predict future electricity generation. By identifying clusters of suitable areas, or perhaps overlaying data generated in this study with socioeconomic data, policymakers can create more logical and incentivizing policies and deploy financing schemes based on building type, usage, and PV potential. Finally, building owners can avoid high electricity costs by installing PV systems on the correct sides of their roofs. This study has developed a method to inform each of these stakeholder groups.
The presented method characterizes rooftop segments over a wide area and identify rooftops that are suitable for PV systems. Other researchers who wish to investigate different cities or regions and to create their own parameters for what constitutes a suitable area can use the methodology. Classification binning criteria for aspect and slope could further be adjusted to re ect refinements in the decision making process, such as additionally separating along the solar noon demarcation or separating along financial criteria from PV power income on-site. This is outside of the realm of this paper, but demonstrates the potential for this new tool. The methodology can also be customized using different radiation models or power production methods, since neither of these are calculated in this study. Additionally, the methodology can be used for other areas that require rooftop information. The method relies extensively on ArcGIS which is the most commonly used commercial software especially among many of the stakeholders that might find this tool useful (e.g., city planners, utility managers, consultants), although the lack of 'open source' software is a limitation of this study. Another key limitation is the computation time to model shading.
We would like to thank you Frank Hardisty, Joseph Ranalli and Carolyn Fish. Also, we sincerely thank two anonymous reviewers for their comments and suggestions.
All authors declare no conflicts of interest in this paper.
[1] | World Data Bank, Urban population, 2015. Available from: http://data.worldbank.org/indicator/SP.URB.TOTL.IN.ZS. |
[2] |
Nguyen HT, Pearce JM (2012) Incorporating shading losses in solar photovoltaic potential assessment at the municipal scale. Solar Energy 86: 1245-1260. doi: 10.1016/j.solener.2012.01.017
![]() |
[3] |
Wiginton L, Nguyen H, Pearce JM (2010) Quantifying rooftop solar photovoltaic potential for regional renewable energy policy. Computers, Environment and Urban Systems 34: 345-357. doi: 10.1016/j.compenvurbsys.2010.01.001
![]() |
[4] | Suna D, Polo AL, Haas R. Demand side Value of PV. Vienna University of Technology: Institute of Power Systems and Energy Economics Group, Report of IEE project; 2006. 55p. |
[5] |
Voivontas D, Assimacopoulos D, Mourelatos A. et al. (1998) Evaluation of renewable energy potential using a GIS decision support system. Renewable energy 13: 333-344. doi: 10.1016/S0960-1481(98)00006-8
![]() |
[6] |
Izquierdo S, Rodrigues M, Fueyo N. (2008) A method for estimating the geographical distribution of the available roof surface area for large-scale photovoltaic energy-potential evaluations. Solar Energy 82: 929-939. doi: 10.1016/j.solener.2008.03.007
![]() |
[7] |
Kabir MH, Endlicher W, Jägermeyr J. (2010) Calculation of bright roof-tops for solar pv applications in dhaka megacity, bangladesh. Renewable Energy 35: 1760-1764. doi: 10.1016/j.renene.2009.11.016
![]() |
[8] |
Charabi Y, Gastli A. (2011) PV site suitability analysis using gis-based spatial fuzzy multicriteria evaluation. Renewable Energy 36: 2554-2561. doi: 10.1016/j.renene.2010.10.037
![]() |
[9] | Chaudhari M, Frantzis L, Hoff TE. PV grid connected market potential under a cost breakthrough scenario. Navigant Consulting, Inc. Retrieved on September; 2004. p 93. Report No.: 2004-117373. |
[10] | Paidipati J, Frantzis L, Sawyer H, at al. Rooftop photovoltaics market penetration scenarios. Golden (CO): National Renewable Energy Laboratory; 2008 November. p 92. Report No.: NREL/SR-581-42306. |
[11] | Suzuki S, Ito M, Kurokawa K. An analysis of pv resource in residential areas by means of aerial photo images. in Proceedings of the 22nd European Photovoltaic Solar Energy Conference, 2007 September 3-7; Milan, Italy. (2007), p.3571-3575. |
[12] |
Gennusa ML, Lascari G, Rizzo G, et al. (2011) A model for predicting the potential diffusion of solar energy systems in complex urban environments. Energy Policy, 39: 5335-5343. doi: 10.1016/j.enpol.2011.05.031
![]() |
[13] |
Compagnon R. (2004) Solar and daylight availability in the urban fabric. Energy and Buildings 36: 321-328. doi: 10.1016/j.enbuild.2004.01.009
![]() |
[14] | Anders S, Bialek T. Technical potential for rooftop photovoltaics in the San Diego region. in Solar 2006: Renewable Energy - Key to Climate Recovery, 2006 July 9-13; Denver (CO). American Solar Energy Society (ASES) Curran Associates, Inc. (Mar 2007). p.8-13. |
[15] |
Nguyen HT, Pearce JM. (2013) Automated quantification of solar photovoltaic potential in cities. International Review for Spatial Planning and Sustainable Development 1: 49-60. doi: 10.14246/irspsd.1.1_49
![]() |
[16] | Denholm P, Margolis R. Supply curves for rooftop solar PV-generated electricity for the United States. Golden(CO): National Renewable Energy Laboratory; 2008 November. p 19. Report No.: NREL/TP-6A0-44073 . |
[17] |
Freitas S, Catita C, Redweik P, et al. (2015) Modelling solar potential in the urban environment: State-of-the-art review. Renewable and Sustainable Energy Reviews 41: 915-931. doi: 10.1016/j.rser.2014.08.060
![]() |
[18] |
Angelis-Dimakis A, Biberacher M, Dominguez J, et al. (2011) Methods and tools to evaluate the availability of renewable energy sources. Renewable and Sustainable Energy Reviews 15: 1182-1200. doi: 10.1016/j.rser.2010.09.049
![]() |
[19] | Melius J, Margolis R. and Ong S. Estimating Rooftop Suitability for PV: A Review of Methods, Patents, and Validation Techniques. Golden(CO): National Renewable Energy Laboratory; 2013 December. p 30. Report No.: NREL/TP-6A20-60593. |
[20] |
Lukac N, Žlaus D, Seme S, et al. (2013) Rating of roofs surfaces regarding their solar potential and suitability for pv systems, based on lidar data. Applied Energy 102: 803-812. doi: 10.1016/j.apenergy.2012.08.042
![]() |
[21] | Lukac N. and Zalik B. (2013) Gpu-based roofs' solar potential estimation using lidar data. Computers & Geosciences, 52: 34-41. |
[22] | Huang Y, Yu B, Hu Z, et al. Locating suitable roofs for utilization of solar energy in downtown area using airborne lidar data and object-based method: A case study of the lujiazui region, Shanghai. in 2012 Second International Workshop on Earth Observation and Remote Sensing Applications, 2012 June 8-11; Shanghai, China. IEEE, (2012). p. 322-326. |
[23] |
Jacques DA, Gooding J, Giesekam JJ, et al. (2014) Methodology for the assessment of (PV) capacity over a city region using low-resolution lidar data and application to the city of leeds (UK). Applied Energy 124: 28-34. doi: 10.1016/j.apenergy.2014.02.076
![]() |
[24] |
Gooding J, Crook R, Tomlin AS. (2015) Modelling of roof geometries from low-resolution lidar data for city-scale solar energy applications using a neighbouring buildings method. Applied Energy 148: 93-104. doi: 10.1016/j.apenergy.2015.03.013
![]() |
[25] | Voegtle T, Steinle E, Tovari D.(2005) Airborne laserscanning data for determination of suitable areas for photovoltaics. International Archives of the Photogrammetry, Remote Sensing and Spatial Information Sciences, 36: 215-220. |
[26] |
Jochem A, Höfle B, Rutzinger M, et al. (2009) Automatic roof plane detection and analysis in airborne lidar point clouds for solar potential assessment. Sensors 9: 5241-5262. doi: 10.3390/s90705241
![]() |
[27] | Santos T, Gomes N, Brito M, et al. Solar potential analysis in Lisbon using lidar data. in Proc. in 31st EARSeL symposium and 35th general assembly Prague, 2011 May 30 -June 2; Prague, Czech Republic. European Association of Remote Sensing Laboratories (EARSeL), (2013). p.13-20. |
[28] |
Levinson R, Akbari H, Pomerantz M, et al. (2009) Solar access of residential rooftops in four California cities. Solar Energy 83: 2120-2135. doi: 10.1016/j.solener.2009.07.016
![]() |
[29] | Kassner R, Koppe W, Schüttenberg T, et al. Analysis of the solar potential of roofs by using offcial lidar data. in Proceedings of the International Society for Photogrammetry, Remote Sensing and Spatial Information Sciences, (ISPRS Congress), 2008 July 3-11; Beijing, China. XXIst ISPRS Congress Technical Commission IV, (2008). p. 399-404. |
[30] |
Nguyen HT, Pearce JM, Harrap R, et al. (2012) The application of lidar to assessment of rooftop solar photovoltaic deployment potential in a municipal district unit. Sensors 12: 4534-4558. doi: 10.3390/s120404534
![]() |
[31] | Li Z, Zhang Z, Davey K. (2015) Estimating geographical pv potential using lidar data for buildings in downtown san francisco, Transactions in GIS Forthcoming 2015. |
[32] |
Gooding J, Edwards H, Giesekam J, et al. (2013) Solar city indicator: A methodology to predict city level pv installed capacity by combining physical capacity and socio-economic factors. Solar Energy 95: 325-335. doi: 10.1016/j.solener.2013.06.027
![]() |
[33] |
Jo JH, Rose Z, Cross J, et al. (2015) Application of airborne lidar data and geographic information systems (GIS) to develop a distributed generation system for the town of normal, IL. AIMS Energy 3: 173-183. doi: 10.3934/energy.2015.2.173
![]() |
[34] |
Kodysh JB, Omitaomu OA, Bhaduri BL, et al. (2013) Methodology for estimating solar potential on multiple building rooftops for photovoltaic systems. Sustainable Cities and Society 8: 31-41. doi: 10.1016/j.scs.2013.01.002
![]() |
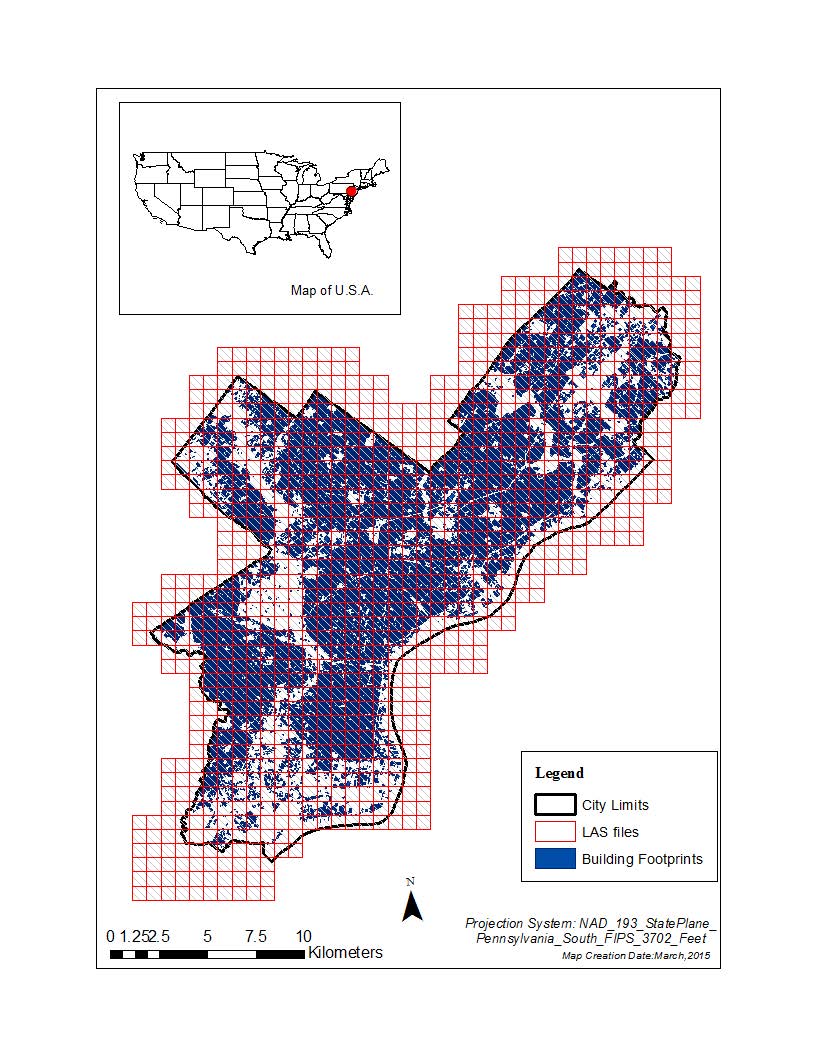
[35] | Freeh R, Wu S, Mayor's Offce of Sustainability, Greenworks Philadelphia Progress Report. Mayor's Offce of Sustainability, City of Philadelphia; 2015. p 58. |
[36] | Solar energy, solar city partnership, 2015. Available from: http://www.phila.gov/green/solar.html. |
[37] | Pennsylvania spatial data access, Data Access Wizard, 2015. Available from: http://www.pasda.psu.edu/uci/SearchPage.aspx. |
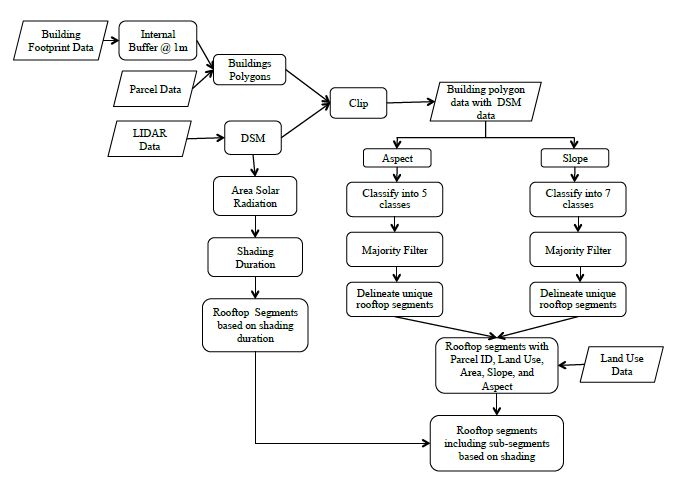
[38] | ArcGIS Resources, Creating raster dems and dsms from large lidar point collections, 2014. Available from: http://resources.arcgis.com/en/help/main/10.2/index.html#//015w0000004q000000. |
[39] | Brooks B, Understanding the Cal Fire Solar Photovoltaic Installation Guideline. Brooks Engineering; 2011 March. p 27. |
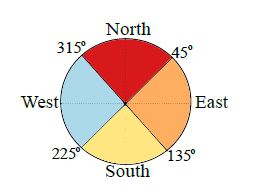
[40] | Chistensen CB, Barker GM. Effects of tilt and azimuth on annual incident solar radiation for united states locations. in Proceedings of Solar Forum 2001: Solar Energy: The Power to Choose, 2001 April 21-25; Washington D.C, USA. |
[41] | ArcGIS Resources, How slope works, 2014. Available from: http://resources.arcgis.com/en/help/main/10.2/index.html#/How_Slope_works/009z000000vz000000/. |
[42] |
Alexander C, Smith-Voysey S, Jarvis C, et al. (2009) Integrating building footprints and lidar elevation data to classify roof structures and visualise buildings. Computers, Environment and Urban Systems 33: 285-292. doi: 10.1016/j.compenvurbsys.2009.01.009
![]() |
[43] | California Energy Commission, Solar Ready. 2013 Residential Compliance Manual; 2014. p 14. |
[44] |
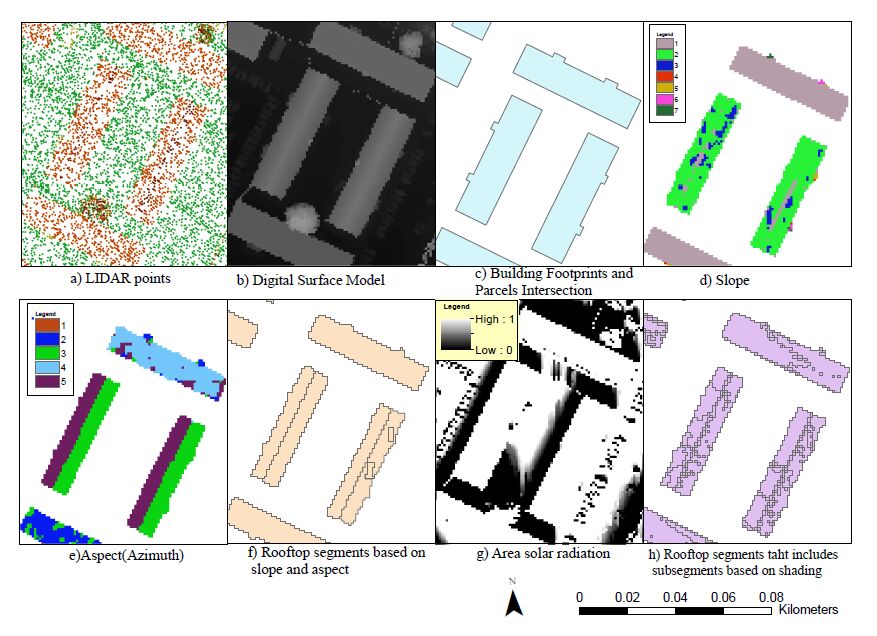
Fu P, Rich PM. (2002) A geometric solar radiation model with applications in agriculture and forestry. Computers and Electronics in Agriculture 37: 25-35. doi: 10.1016/S0168-1699(02)00115-1
![]() |
[45] | Fu P, Rich P. The solar analyst 1.0 manual. Helios Environmental Modeling Institute, LLC; 2000. p 49. |
[46] | Feldman D, Barbose G, Margolis R. Photovoltaic (PV) pricing trends: historical, recent, and near-term projections. Sun Shot Department of Energy; 2012 November. p 23. Report No: DOE/GO-102012-3839. |
[47] | Goodrich A, James T, Woodhouse M. Residential, commercial, and utilityscale photovoltaic (PV) system prices in the United States: current drivers and cost-reduction opportunities. Golden(CO): National Renewable Energy Laboratory; 2012 February. p 64. Report No: NREL/TP-6A20-53347. |
[48] | Brooks W, Dunlop J. Photovoltaic (PV) installer resource guide. NABCEP, 2012 March. p 162. |
[49] | Guide book for solar photovoltaic projects in Philadelphia. Mayor's Offce of Sustainability City of Philadelphia, Resources, 2011 March. p 87. |
[50] |
Hofierka J, Kanuk J. (2009) Assessment of photovoltaic potential in urban areas using open-source solar radiation tools. Renewable Energy 34: 2206-2214. doi: 10.1016/j.renene.2009.02.021
![]() |
1. | Arti Tiwari, Isaac A. Meir, Arnon Karnieli, Object-Based Image Procedures for Assessing the Solar Energy Photovoltaic Potential of Heterogeneous Rooftops Using Airborne LiDAR and Orthophoto, 2020, 12, 2072-4292, 223, 10.3390/rs12020223 | |
2. | Athenee Teofilo, Qian (Chayn) Sun, Nenad Radosevic, Yaguang Tao, Jerome Iringan, Chengyang Liu, Investigating potential rooftop solar energy generated by Leased Federal Airports in Australia: Framework and implications, 2021, 23527102, 102390, 10.1016/j.jobe.2021.102390 | |
3. | Fariborz Mansouri Kouhestani, James Byrne, Dan Johnson, Locke Spencer, Paul Hazendonk, Bryson Brown, Evaluating solar energy technical and economic potential on rooftops in an urban setting: the city of Lethbridge, Canada, 2019, 10, 2008-9163, 13, 10.1007/s40095-018-0289-1 | |
4. | Sumeyye Kaynak, Baran Kaynak, Ahmet Ozmen, GPU-Based Dynamic Solar Potential Estimation Tool Using 3D Plans, 2020, 8, 2169-3536, 45432, 10.1109/ACCESS.2020.2978590 | |
5. | Michael O. Dioha, Atul Kumar, Rooftop solar PV for urban residential buildings of Nigeria: A preliminary attempt towards potential estimation, 2018, 6, 2333-8334, 710, 10.3934/energy.2018.5.710 | |
6. | Perla Zambrano-Prado, Alejandro Josa, Joan Rieradevall, Fernando Pérez-Aragüés, Juan F. Marchan, Santiago Gassó-Domingo, Xavier Gabarrell, Laboratory-based spectral data acquisition of roof materials, 2020, 41, 0143-1161, 9180, 10.1080/01431161.2020.1798548 | |
7. | Dan Assouline, Nahid Mohajeri, Jean-Louis Scartezzini, 2018, Chapter 11, 978-3-319-74411-7, 173, 10.1007/978-3-319-74412-4_11 | |
8. | Michal Fogl, Vítězslav Moudrý, Influence of vegetation canopies on solar potential in urban environments, 2016, 66, 01436228, 73, 10.1016/j.apgeog.2015.11.011 | |
9. | Jangwon Suh, Jeffrey Brownson, Solar Farm Suitability Using Geographic Information System Fuzzy Sets and Analytic Hierarchy Processes: Case Study of Ulleung Island, Korea, 2016, 9, 1996-1073, 648, 10.3390/en9080648 | |
10. | J. Ranalli, K. Calvert, M. Bayrakci Boz, J.R.S. Brownson, Toward comprehensive solar energy mapping systems for urban electricity system planning and development, 2018, 31, 10406190, 8, 10.1016/j.tej.2018.01.002 | |
11. | Paulo Soares, Mesude Bayrakci-Boz, Jeffrey R. S. Brownson, 2020, GIS Information for Solar PV Energy Siting: A Case Study in the Borough of State College, PA, USA, 978-1-7281-6115-0, 1749, 10.1109/PVSC45281.2020.9300797 | |
12. | Tripti Mishra, Amit Rabha, Ujjwal Kumar, Kusum Arunachalam, Vijay Sridhar, Assessment of solar power potential in a hill state of India using remote sensing and Geographic Information System, 2020, 19, 23529385, 100370, 10.1016/j.rsase.2020.100370 | |
13. | Syaza Rozali, Zulkiflee Abd Latif, Nor Aizam Adnan, Yousif Hussin, Alan Blackburn, Biswajeet Pradhan, Estimating feature extraction changes of Berkelah Forest, Malaysia from multisensor remote sensing data using and object-based technique, 2020, 1010-6049, 1, 10.1080/10106049.2020.1852610 | |
14. | Marcela Bindzarova Gergelova, Zofia Kuzevicova, Slavomir Labant, Stefan Kuzevic, Diana Bobikova, Jozef Mizak, Roof’s Potential and Suitability for PV Systems Based on LiDAR: A Case Study of Komárno, Slovakia, 2020, 12, 2071-1050, 10018, 10.3390/su122310018 | |
15. | Diane Palmer, Elena Koumpli, Ian Cole, Ralph Gottschalg, Thomas Betts, A GIS-Based Method for Identification of Wide Area Rooftop Suitability for Minimum Size PV Systems Using LiDAR Data and Photogrammetry, 2018, 11, 1996-1073, 3506, 10.3390/en11123506 | |
16. | Dan Assouline, Nahid Mohajeri, Jean-Louis Scartezzini, Ulrich Michel, Karsten Schulz, 2017, Building rooftop classification using random forests for large-scale PV deployment, 9781510613201, 5, 10.1117/12.2277692 | |
17. | Pieter Gagnon, Robert Margolis, Jennifer Melius, Caleb Phillips, Ryan Elmore, Estimating rooftop solar technical potential across the US using a combination of GIS-based methods, lidar data, and statistical modeling, 2018, 13, 1748-9326, 024027, 10.1088/1748-9326/aaa554 | |
18. | Carlos Beltran-Velamazan, Marta Monzón-Chavarrías, Belinda López-Mesa, A Method for the Automated Construction of 3D Models of Cities and Neighborhoods from Official Cadaster Data for Solar Analysis, 2021, 13, 2071-1050, 6028, 10.3390/su13116028 | |
19. | Hannes Koch, Stefan Lechner, Sebastian Erdmann, Martin Hofmann, Assessing the Potential of Rooftop Photovoltaics by Processing High-Resolution Irradiation Data, as Applied to Giessen, Germany, 2022, 15, 1996-1073, 6991, 10.3390/en15196991 | |
20. | Hou Jiang, Ning Lu, Xuecheng Wang, Assessing Carbon Reduction Potential of Rooftop PV in China through Remote Sensing Data-Driven Simulations, 2023, 15, 2071-1050, 3380, 10.3390/su15043380 | |
21. | David Gawley, Paul McKenzie, Investigating the suitability of GIS and remotely-sensed datasets for photovoltaic modelling on building rooftops, 2022, 265, 03787788, 112083, 10.1016/j.enbuild.2022.112083 | |
22. | Chiranjit Singha, Shahid Gulzar, Swarnashri Bain, Anindita Bhattacharjee, Santana Debnath, Rajeev Kumar, Biswajit Roy Chowdhury, 2022, Role of Geospatial Technology for Hydroponics Horticulture Based Roof Top Farming as Emerging Future Prospective in A Kolkata City, India, 978-1-6654-6756-8, 318, 10.1109/ICIEM54221.2022.9853076 | |
23. | Xiu Lu, Guannan Li, Liangchen Zhou, Lisha Hao, Guonian Lv, Bingxian Lin, Photovoltaic potential estimation for various surface components of urban residential buildings based on Industry Foundation Classes data, 2022, 10, 2050-0505, 3741, 10.1002/ese3.1253 | |
24. | Shukhrat Shokirov, Michael Schaefer, Shaun R. Levick, Tommaso Jucker, Justin Borevitz, Ilhom Abdurahmanov, Kara Youngentob, Multi-platform LiDAR approach for detecting coarse woody debris in a landscape with varied ground cover, 2021, 42, 0143-1161, 9324, 10.1080/01431161.2021.1995072 | |
25. | A.L. Montealegre, S. García-Pérez, S. Guillén-Lambea, M. Monzón-Chavarrías, J. Sierra-Pérez, GIS-based assessment for the potential of implementation of food-energy-water systems on building rooftops at the urban level, 2022, 803, 00489697, 149963, 10.1016/j.scitotenv.2021.149963 | |
26. | Abdo Abdullah Ahmed Gassar, Seung Hyun Cha, Review of geographic information systems-based rooftop solar photovoltaic potential estimation approaches at urban scales, 2021, 291, 03062619, 116817, 10.1016/j.apenergy.2021.116817 | |
27. | Job Taminiau, John Byrne, Jongkyu Kim, Min‐Hwi Kim, Jeongseok Seo, Inferential‐ and measurement‐based methods to estimate rooftop “solar city” potential in megacity Seoul, South Korea, 2022, 11, 2041-8396, 10.1002/wene.438 | |
28. | Yunsheng Zhang, Zhisheng Dai, Weixi Wang, Xiaoming Li, Siyang Chen, Li Chen, Estimation of the Potential Achievable Solar Energy of the Buildings Using Photogrammetric Mesh Models, 2021, 13, 2072-4292, 2484, 10.3390/rs13132484 | |
29. | Sayon Palit, Aneesh Chopra, P. Balakrishnan, Bessie Amali. D. Geraldine, K. S. Umadevi, 2021, Chapter 3, 978-981-16-5047-5, 31, 10.1007/978-981-16-5048-2_3 | |
30. | Mike Slootweg, Mingming Hu, Solmaria Halleck Vega, Maarten van ‘t Zelfde, Eveline van Leeuwen, Arnold Tukker, Identifying the geographical potential of rooftop systems: Space competition and synergy, 2023, 79, 16188667, 127816, 10.1016/j.ufug.2022.127816 | |
31. | Perla Zambrano-Prado, Joan Muñoz-Liesa, Alejandro Josa, Joan Rieradevall, Ramon Alamús, Santiago Gasso-Domingo, Xavier Gabarrell, Assessment of the food-water-energy nexus suitability of rooftops. A methodological remote sensing approach in an urban Mediterranean area, 2021, 75, 22106707, 103287, 10.1016/j.scs.2021.103287 | |
32. | Ural Kafle, Timothy Anderson, Sunil Prasad Lohani, The Potential for Rooftop Photovoltaic Systems in Nepal, 2023, 16, 1996-1073, 747, 10.3390/en16020747 | |
33. | Kirby E. Calvert, Measuring and modelling the land‐use intensity and land requirements of utility‐scale photovoltaic systems in the Canadian province of Ontario, 2018, 62, 0008-3658, 188, 10.1111/cag.12444 | |
34. | Paul U. Ugbong, Muhammad Isma’il, A. K. Usman, GEOSPATIAL ESTIMATION OF ROOFTOP SOLAR PHOTOVOLTAIC POTENTIAL IN CALABAR MUNICIPAL, CROSS RIVER STATE, NIGERIA, 2023, 7, 2616-1370, 272, 10.33003/fjs-2023-0703-1840 | |
35. | Tianxi Wei, Yi Zhang, Yuhang Zhang, Rui Miao, Jian Kang, He Qi, City-scale roof-top photovoltaic deployment planning, 2024, 368, 03062619, 123461, 10.1016/j.apenergy.2024.123461 | |
36. | Haozhan Ni, Daoyang Wang, Wenzhuo Zhao, Wolin Jiang, E. Mingze, Chenyu Huang, Jiawei Yao, Enhancing rooftop solar energy potential evaluation in high-density cities: A Deep Learning and GIS based approach, 2024, 309, 03787788, 113743, 10.1016/j.enbuild.2023.113743 | |
37. | Nitin Liladhar Rane, Mehmet Akif Günen, Suraj Kumar Mallick, Jayesh Rane, Chaitanya B. Pande, Monica Giduturi, Javed Khan Bhutto, Krishna Kumar Yadav, Abebe Debele Tolche, Maha Awjan Alreshidi, GIS-based multi-influencing factor (MIF) application for optimal site selection of solar photovoltaic power plant in Nashik, India, 2024, 36, 2190-4715, 10.1186/s12302-023-00832-2 | |
38. | Qiaqia Chen, Application of Geographic Information System in Assessing Rooftop Photovoltaic Potential, 2023, 69, 2791-0210, 361, 10.54097/hset.v69i.12134 | |
39. | Mebarek LAHBIB, Mohammed BOUSSAID, Houcine MOUNGAR, Ahmed TAHRI, Analytical assessment of the filed results on the PV system connectors performance under operating temperature, 2023, 11, 2333-8334, 555, 10.3934/energy.2023029 | |
40. | Tianqi Ruan, Monika Topel, Wujun Wang, Bjorn Laumert, Potential of grid-connected decentralized rooftop PV systems in Sweden, 2023, 9, 24058440, e16871, 10.1016/j.heliyon.2023.e16871 | |
41. | Wei Liao, Chulho Kim, Yiqiang Xiao, Hanjoo Kim, Tageui Hong, Shi Yin, Yeonsook Heo, Quantifying Photovoltaic surplus at an urban scale: A case study in Seoul, 2023, 298, 03787788, 113523, 10.1016/j.enbuild.2023.113523 | |
42. | Paulina Jaczewska, Hubert Sybilski, Marlena Tywonek, Assessment of the Solar Potential of Buildings Based on Photogrammetric Data, 2025, 18, 1996-1073, 868, 10.3390/en18040868 | |
43. | Andrés Idrovo-Macancela, Marco Velecela-Zhindón, Antonio Barragán-Escandón, Esteban Zalamea-León, Danilo Mejía-Coronel, GIS-based assessment of photovoltaic solar potential on building rooftops in equatorial urban areas, 2025, 11, 24058440, e41425, 10.1016/j.heliyon.2024.e41425 | |
44. | Xinwei Zhuang, Guoquan Lv, Zilong Zhao, Luisa Caldas, Rapid assessment of solar potential for building surfaces in complex urban morphologies based on vector processing, 2025, 294, 0038092X, 113482, 10.1016/j.solener.2025.113482 | |
45. | Muhammad Kamran Lodhi, Yumin Tan, Xiaolu Wang, Agus Suprijanto, Muhammad Imran, Advancing urban solar assessment: A deep learning and atmospheric modelling framework for quantifying PV yield and carbon reduction, 2025, 338, 03787788, 115717, 10.1016/j.enbuild.2025.115717 |
Dataset | Data Source | Data of Release | Format | Fields/Information |
City Limits Data | PASDA1 | 2000 | Polygon | Area and perimeter |
1.Data collection performed over the City of Philadelphia, PA in April of 2010 | ||||
LIDAR Data | PASDA | 2010 | LAS files | 2.Point density 6 points/m2 |
3.Point classi cation values; scan angle; additional RGB values;scan direction; edge of ight line; user data; point source ID; and waveform information | ||||
Building Footprint Data | PASDA | 2007 | Polygon | ID number, elevation, area perimeter, source, length |
Parcels Data | PASDA | 2013 | Polygon | ID, house number, area street direction, street name |
Land Use Data | PASDA | 2010 | Polygon | 9 class: residential, commercial, industrial, cultural/recreation, civic/institutions, transportation, vacant/other,water, park/open space |
Aerial Photography | PASDA | 2010 | Raster | Consist of tiled orthogonal images |
1 Pennsylvania Spatial Data Access[37] |
Slope Value (Degree) | Class |
0-10 | Class 1 |
10-20 | Class 2 |
20-30 | Class 3 |
30-40 | Class 4 |
40-50 | Class 5 |
50-60 | Class 6 |
60-90 | Class 7 |
Parameter | Value |
Area | 20m2 ≤ Area ≤ 100m2 for residential PV system size |
100m2 < Area ≤ 10000m2 for commercial PV system size | |
Aspect | 135° ≤ Aspect ≤ 225° or Flat |
Shading | No shading between 9.00 am to 3.00 pm at the summer solstice |
No shading between 10.00 am to 2.00 pm at the winter solstice | |
Slope | 20 < Slope ≤ 60 : Rate1 |
0 ≤ Slope ≤ 20 : Rate2 |
Building Footprint Area [km2] |
Rooftop Segments Area[km2] |
Suitable Area for Residential Size PV Systems[km2] |
Suitable Area for Commercial Size PV Systems[km2] |
Percent of Total Building Footprint Suitable Area for PV Systems[%] |
Percent of Total Rooftop Suitable Area for PV Systems[%] |
|
Residential | 38.505 | 25.827 | 11.414 | 0.790 | 31.7 | 47.3 |
Commercial | 6.943 | 5.115 | 1.014 | 1.523 | 36.5 | 49.6 |
Industrial | 10.566 | 8.152 | 0.928 | 3.651 | 43.3 | 56.2 |
Civic/Institutions | 4.617 | 3.159 | 0.403 | 0.960 | 29.5 | 43.1 |
CulturealRecreation | 0.834 | 0.532 | 0.058 | 0.129 | 22.5 | 35.2 |
Other/Vacant | 1.040 | 0.527 | 0.069 | 0.117 | 17.9 | 35.3 |
Total | 62.506 | 43.312 | 13.886 | 7.170 | 33.7 | 48.6 |
This Study |
Denholm and Margolis [16] |
Anders and Bialek [14] |
Compagnon [13] |
Hofierka and Kanuk [50] |
Suziki [11] |
Nguyen and Pearce [15] |
||
Building Footprint |
Rooftop | |||||||
Residential | 31.7 | 47.3 | 22%-27% | 35% | ||||
Commercial | 36.5 | 49.6 | 60%-65% | |||||
Industrial | 43.3 | 56.2 | ||||||
Civic/Institutions | 29.5 | 43.1 | ||||||
CulturealRecreation | 22.5 | 35.2 | ||||||
Other/Vacant | 17.9 | 35.3 | ||||||
Total | 33.7 | 48.6 | 12.6% | 6.5%-21% | 59% | 50%-100% | 33% |