Citation: Ana Jalles, Patrícia Maciel. The disruption of proteostasis in neurodegenerative disorders[J]. AIMS Molecular Science, 2015, 2(3): 259-293. doi: 10.3934/molsci.2015.3.259

| [1] |
Powers ET, Balch WE (2013) Diversity in the origins of proteostasis networks--a driver for protein function in evolution. Nat Rev Mol Cell Biol 14: 237-248. doi: 10.1038/nrm3542

|
| [2] | Gidalevitz T, Prahlad V, Morimoto RI (2011) The stress of protein misfolding: from single cells to multicellular organisms. Cold Spring Harb Perspect Biol 3: a009704. |
| [3] |
Balch WE, Morimoto RI, Dillin A, et al. (2008) Adapting proteostasis for disease intervention. Science 319: 916-919. doi: 10.1126/science.1141448
|
| [4] |
Powers ET, Morimoto RI, Dillin A, et al. (2009) Biological and chemical approaches to diseases of proteostasis deficiency. Annu Rev Biochem 78: 959-991. doi: 10.1146/annurev.biochem.052308.114844
|
| [5] |
López-Otín C, Blasco MA, Partridge L, et al. (2013) The Hallmarks of Aging. Cell 153: 1194-1217. doi: 10.1016/j.cell.2013.05.039
|
| [6] |
Kim YE, Hipp MS, Bracher A, et al. (2013) Molecular chaperone functions in protein folding and proteostasis. Annu Rev Biochem 82: 323-355. doi: 10.1146/annurev-biochem-060208-092442
|
| [7] |
Haynes CM, Ron D (2010) The mitochondrial UPR - protecting organelle protein homeostasis. J Cell Sci 123: 3849-3855. doi: 10.1242/jcs.075119
|
| [8] |
Anckar J, Sistonen L (2011) Regulation of HSF1 function in the heat stress response: implications in aging and disease. Annu Rev Biochem 80: 1089-1115. doi: 10.1146/annurev-biochem-060809-095203
|
| [9] |
Walter P, Ron D (2011) The unfolded protein response: from stress pathway to homeostatic regulation. Science 334: 1081-1086. doi: 10.1126/science.1209038
|
| [10] |
Tartaglia GG, Pechmann S, Dobson CM, et al. (2007) Life on the edge: a link between gene expression levels and aggregation rates of human proteins. Trends Biochem Sci 32: 204-206. doi: 10.1016/j.tibs.2007.03.005
|
| [11] |
Tartaglia GG, Dobson CM, Hartl FU, et al. (2010) Physicochemical determinants of chaperone requirements. J Mol Biol 400: 579-588. doi: 10.1016/j.jmb.2010.03.066
|
| [12] |
Gsponer J, Babu MM (2012) Cellular strategies for regulating functional and nonfunctional protein aggregation. Cell Rep 2: 1425-1437. doi: 10.1016/j.celrep.2012.09.036
|
| [13] |
Ciryam P, Kundra R, Morimoto RI, et al. (2015) Supersaturation is a major driving force for protein aggregation in neurodegenerative diseases. Trends Pharmacol Sci 36: 72-77. doi: 10.1016/j.tips.2014.12.004
|
| [14] |
Ellis RJ, Hartl FU (1999) Principles of protein folding in the cellular environment. Curr Opin Struct Biol 9: 102-110. doi: 10.1016/S0959-440X(99)80013-X
|
| [15] |
Van den Berg B, Ellis RJ, Dobson CM (1999) Effects of macromolecular crowding on protein folding and aggregation. EMBO J 18: 6927-6933. doi: 10.1093/emboj/18.24.6927
|
| [16] | Ellis RJ, Minton AP (2006) Protein aggregation in crowded environments. Biol Chem 387: 485-497. |
| [17] |
Hartl FU, Hayer-Hartl M (2002) Molecular chaperones in the cytosol: from nascent chain to folded protein. Science 295: 1852-1858. doi: 10.1126/science.1068408
|
| [18] |
Onuchic JN, Wolynes PG (2004) Theory of protein folding. Curr Opin Struct Biol 14: 70-75. doi: 10.1016/j.sbi.2004.01.009
|
| [19] |
Oliveberg M, Wolynes PG (2005) The experimental survey of protein-folding energy landscapes. Q Rev Biophys 38: 245-288. doi: 10.1017/S0033583506004185
|
| [20] |
Brockwell DJ, Radford SE (2007) Intermediates: ubiquitous species on folding energy landscapes? Curr Opin Struct Biol 17: 30-37. doi: 10.1016/j.sbi.2007.01.003
|
| [21] |
Bartlett AI, Radford SE (2009) An expanding arsenal of experimental methods yields an explosion of insights into protein folding mechanisms. Nat Struct Mol Biol 16: 582-588. doi: 10.1038/nsmb.1592
|
| [22] |
Eichner T, Kalverda AP, Thompson GS, et al. (2011) Conformational conversion during amyloid formation at atomic resolution. Mol Cell 41: 161-172. doi: 10.1016/j.molcel.2010.11.028
|
| [23] |
Dobson CM (2003) Protein folding and misfolding. Nature 426: 884-890. doi: 10.1038/nature02261
|
| [24] | Haass C, Selkoe DJ (2007) Soluble protein oligomers in neurodegeneration: lessons from the Alzheimer's amyloid β-peptide. Nat Rev Mol Cell Biol 8: 101-112. |
| [25] |
Knowles TPJ, Vendruscolo M, Dobson CM (2014) The amyloid state and its association with protein misfolding diseases. Nat Rev Mol Cell Biol 15: 384-396. doi: 10.1038/nrm3810
|
| [26] |
Hartl FU, Bracher A, Hayer-Hartl M (2011) Molecular chaperones in protein folding and proteostasis. Nature 475: 324-332. doi: 10.1038/nature10317
|
| [27] |
Hartl FU (1996) Molecular chaperones in cellular protein folding. Nature 381: 571-579. doi: 10.1038/381571a0
|
| [28] |
Hartl FU, Hayer-Hartl M (2009) Converging concepts of protein folding in vitro and in vivo. Nat Struct Mol Biol 16: 574-581. doi: 10.1038/nsmb.1591
|
| [29] |
Moran L, Mirault ME, Arrigo AP, et al. (1978) Heat shock of Drosophila melanogaster induces the synthesis of new messenger RNAs and proteins. Philos Trans R Soc Lond B Biol Sci 283: 391-406. doi: 10.1098/rstb.1978.0044
|
| [30] |
Kayed R, Head E, Thompson JL, et al. (2003) Common structure of soluble amyloid oligomers implies common mechanism of pathogenesis. Science 300: 486-489. doi: 10.1126/science.1079469
|
| [31] |
Slepenkov SV, Witt SN (2002) The unfolding story of the Escherichia coli Hsp70 DnaK: is DnaK a holdase or an unfoldase? Mol Microbiol 45: 1197-1206. doi: 10.1046/j.1365-2958.2002.03093.x
|
| [32] |
Bösl B, Grimminger V, Walter S (2006) The molecular chaperone Hsp104--a molecular machine for protein disaggregation. J Struct Biol 156: 139-148. doi: 10.1016/j.jsb.2006.02.004
|
| [33] |
Auluck PK, Chan HYE, Trojanowski JQ, et al. (2002) Chaperone suppression of alpha-synuclein toxicity in a Drosophila model for Parkinson's disease. Science 295: 865-868. doi: 10.1126/science.1067389
|
| [34] | Gribaldo S, Lumia V, Creti R, et al. (1999) Discontinuous occurrence of the hsp70 (dnaK) gene among Archaea and sequence features of HSP70 suggest a novel outlook on phylogenies inferred from this protein. J Bacteriol 181: 434-443. |
| [35] | Chang H-C, Tang Y-C, Hayer-Hartl M, et al. (2007) SnapShot: Molecular Chaperones, Part I. Cell 128: 212.e1-e212.e2. |
| [36] | Macario AJL, Lange M, Ahring BK, et al. (1999) Stress Genes and Proteins in the Archaea. Microbiol Mol Biol Rev 63: 923-967. |
| [37] |
Bukau B, Deuerling E, Pfund C, et al. (2000) Getting newly synthesized proteins into shape. Cell 101: 119-122. doi: 10.1016/S0092-8674(00)80806-5
|
| [38] |
Young JC, Barral JM, Ulrich Hartl F (2003) More than folding: localized functions of cytosolic chaperones. Trends Biochem Sci 28: 541-547. doi: 10.1016/j.tibs.2003.08.009
|
| [39] | Pratt WB, Toft DO (2003) Regulation of signaling protein function and trafficking by the hsp90/hsp70-based chaperone machinery. Exp Biol Med Maywood NJ 228: 111-133. |
| [40] |
Mayer MP, Bukau B (2005) Hsp70 chaperones: Cellular functions and molecular mechanism. Cell Mol Life Sci 62: 670-684. doi: 10.1007/s00018-004-4464-6
|
| [41] |
Mayer MP (2010) Gymnastics of Molecular Chaperones. Mol Cell 39: 321-331. doi: 10.1016/j.molcel.2010.07.012
|
| [42] |
Kampinga HH, Craig EA (2010) The HSP70 chaperone machinery: J proteins as drivers of functional specificity. Nat Rev Mol Cell Biol 11: 579-592. doi: 10.1038/nrm2941
|
| [43] |
Arndt V, Dick N, Tawo R, et al. (2010) Chaperone-Assisted Selective Autophagy Is Essential for Muscle Maintenance. Curr Biol 20: 143-148. doi: 10.1016/j.cub.2009.11.022
|
| [44] |
Rüdiger S, Buchberger A, Bukau B (1997) Interaction of Hsp70 chaperones with substrates. Nat Struct Mol Biol 4: 342-349. doi: 10.1038/nsb0597-342
|
| [45] |
Rousseau F, Serrano L, Schymkowitz JWH (2006) How evolutionary pressure against protein aggregation shaped chaperone specificity. J Mol Biol 355: 1037-1047. doi: 10.1016/j.jmb.2005.11.035
|
| [46] |
Frydman J (2001) Folding of newly translated proteins in vivo: the role of molecular chaperones. Annu Rev Biochem 70: 603-647. doi: 10.1146/annurev.biochem.70.1.603
|
| [47] |
McClellan AJ, Xia Y, Deutschbauer AM, et al. (2007) Diverse Cellular Functions of the Hsp90 Molecular Chaperone Uncovered Using Systems Approaches. Cell 131: 121-135. doi: 10.1016/j.cell.2007.07.036
|
| [48] |
Taipale M, Jarosz DF, Lindquist S (2010) HSP90 at the hub of protein homeostasis: emerging mechanistic insights. Nat Rev Mol Cell Biol 11: 515-528. doi: 10.1038/nrm2918
|
| [49] |
Bukau B, Horwich AL (1998) The Hsp70 and Hsp60 chaperone machines. Cell 92: 351-366. doi: 10.1016/S0092-8674(00)80928-9
|
| [50] | Vabulas RM, Raychaudhuri S, Hayer-Hartl M, et al. (2010) Protein folding in the cytoplasm and the heat shock response. Cold Spring Harb Perspect Biol 2: a004390. |
| [51] |
Raineri E, Ribeca P, Serrano L, et al. (2010) A more precise characterization of chaperonin substrates. Bioinforma Oxf Engl 26: 1685-1689. doi: 10.1093/bioinformatics/btq287
|
| [52] |
Xu Z, Horwich AL, Sigler PB (1997) The crystal structure of the asymmetric GroEL-GroES-(ADP)7 chaperonin complex. Nature 388: 741-750. doi: 10.1038/41944
|
| [53] |
Horwich AL, Fenton WA (2009) Chaperonin-mediated protein folding: using a central cavity to kinetically assist polypeptide chain folding. Q Rev Biophys 42: 83-116. doi: 10.1017/S0033583509004764
|
| [54] |
Motojima F, Chaudhry C, Fenton WA, et al. (2004) Substrate polypeptide presents a load on the apical domains of the chaperonin GroEL. Proc Natl Acad Sci U S A 101: 15005-15012. doi: 10.1073/pnas.0406132101
|
| [55] |
Reissmann S, Parnot C, Booth CR, et al. (2007) Essential function of the built-in lid in the allosteric regulation of eukaryotic and archaeal chaperonins. Nat Struct Mol Biol 14: 432-440. doi: 10.1038/nsmb1236
|
| [56] |
Muñoz IG, Yébenes H, Zhou M, et al. (2011) Crystal structure of the open conformation of the mammalian chaperonin CCT in complex with tubulin. Nat Struct Mol Biol 18: 14-19. doi: 10.1038/nsmb.1971
|
| [57] |
Cuéllar J, Martín-Benito J, Scheres SHW, et al. (2008) The structure of CCT-Hsc70 NBD suggests a mechanism for Hsp70 delivery of substrates to the chaperonin. Nat Struct Mol Biol 15: 858-864. doi: 10.1038/nsmb.1464
|
| [58] | Lai BT, Chin NW, Stanek AE, et al. (1984) Quantitation and intracellular localization of the 85K heat shock protein by using monoclonal and polyclonal antibodies. Mol Cell Biol 4: 2802-2810. |
| [59] |
Ali MMU, Roe SM, Vaughan CK, et al. (2006) Crystal structure of an Hsp90-nucleotide-p23/Sba1 closed chaperone complex. Nature 440: 1013-1017. doi: 10.1038/nature04716
|
| [60] | Shiau AK, Harris SF, Southworth DR, et al. (2006) Structural Analysis of E. coli hsp90 reveals dramatic nucleotide-dependent conformational rearrangements. Cell 127: 329-340. |
| [61] |
Wandinger SK, Richter K, Buchner J (2008) The Hsp90 Chaperone Machinery. J Biol Chem 283: 18473-18477. doi: 10.1074/jbc.R800007200
|
| [62] |
Rutherford SL, Lindquist S (1998) Hsp90 as a capacitor for morphological evolution. Nature 396: 336-342. doi: 10.1038/24550
|
| [63] | Squires CL, Pedersen S, Ross BM, et al. (1991) ClpB is the Escherichia coli heat shock protein F84.1. J Bacteriol 173: 4254-4262. |
| [64] |
Parsell DA, Kowal AS, Singer MA, et al. (1994) Protein disaggregation mediated by heat-shock protein Hsp104. Nature 372: 475-478. doi: 10.1038/372475a0
|
| [65] |
Lee YR, Nagao RT, Key JL (1994) A soybean 101-kD heat shock protein complements a yeast HSP104 deletion mutant in acquiring thermotolerance. Plant Cell Online 6: 1889-1897. doi: 10.1105/tpc.6.12.1889
|
| [66] |
Chernoff YO, Lindquist SL, Ono B, et al. (1995) Role of the chaperone protein Hsp104 in propagation of the yeast prion-like factor [psi+]. Science 268: 880-884. doi: 10.1126/science.7754373
|
| [67] |
Schirmer EC, Glover JR, Singer MA, et al. (1996) HSP100/Clp proteins: a common mechanism explains diverse functions. Trends Biochem Sci 21: 289-296. doi: 10.1016/S0968-0004(96)10038-4
|
| [68] |
Zolkiewski M (2006) A camel passes through the eye of a needle: protein unfolding activity of Clp ATPases. Mol Microbiol 61: 1094-1100. doi: 10.1111/j.1365-2958.2006.05309.x
|
| [69] |
Erzberger JP, Berger JM (2006) Evolutionary relationships and structural mechanisms of AAA+ proteins. Annu Rev Biophys Biomol Struct 35: 93-114. doi: 10.1146/annurev.biophys.35.040405.101933
|
| [70] |
Zietkiewicz S, Lewandowska A, Stocki P, et al. (2006) Hsp70 chaperone machine remodels protein aggregates at the initial step of Hsp70-Hsp100-dependent disaggregation. J Biol Chem 281: 7022-7029. doi: 10.1074/jbc.M507893200
|
| [71] |
Miot M, Reidy M, Doyle SM, et al. (2011) Species-specific collaboration of heat shock proteins (Hsp) 70 and 100 in thermotolerance and protein disaggregation. Proc Natl Acad Sci U S A 108: 6915-6920. doi: 10.1073/pnas.1102828108
|
| [72] |
Reidy M, Miot M, Masison DC (2012) Prokaryotic chaperones support yeast prions and thermotolerance and define disaggregation machinery interactions. Genetics 192: 185-193. doi: 10.1534/genetics.112.142307
|
| [73] |
Seyffer F, Kummer E, Oguchi Y, et al. (2012) Hsp70 proteins bind Hsp100 regulatory M domains to activate AAA+ disaggregase at aggregate surfaces. Nat Struct Mol Biol 19: 1347-1355. doi: 10.1038/nsmb.2442
|
| [74] | Sanchez Y, Taulien J, Borkovich KA, et al. (1992) Hsp104 is required for tolerance to many forms of stress. EMBO J 11: 2357-2364. |
| [75] |
Parsell DA, Lindquist S (1993) The Function of Heat-Shock Proteins in Stress Tolerance: Degradation and Reactivation of Damaged Proteins. Annu Rev Genet 27: 437-496. doi: 10.1146/annurev.ge.27.120193.002253
|
| [76] |
Weibezahn J, Tessarz P, Schlieker C, et al. (2004) Thermotolerance requires refolding of aggregated proteins by substrate translocation through the central pore of ClpB. Cell 119: 653-665. doi: 10.1016/j.cell.2004.11.027
|
| [77] |
Rampelt H, Kirstein-Miles J, Nillegoda NB, et al. (2012) Metazoan Hsp70 machines use Hsp110 to power protein disaggregation. EMBO J 31: 4221-4235. doi: 10.1038/emboj.2012.264
|
| [78] |
Schuermann JP, Jiang J, Cuellar J, et al. (2008) Structure of the Hsp110:Hsc70 nucleotide exchange machine. Mol Cell 31: 232-243. doi: 10.1016/j.molcel.2008.05.006
|
| [79] |
Shorter J (2011) The mammalian disaggregase machinery: Hsp110 synergizes with Hsp70 and Hsp40 to catalyze protein disaggregation and reactivation in a cell-free system. PloS One 6: e26319. doi: 10.1371/journal.pone.0026319
|
| [80] | Morano KA, Thiele DJ (1999) Heat shock factor function and regulation in response to cellular stress, growth, and differentiation signals. Gene Expr 7: 271-282. |
| [81] |
Anckar J, Sistonen L (2007) Heat shock factor 1 as a coordinator of stress and developmental pathways. Adv Exp Med Biol 594: 78-88. doi: 10.1007/978-0-387-39975-1_8
|
| [82] |
Abravaya K, Phillips B, Morimoto RI (1991) Attenuation of the heat shock response in HeLa cells is mediated by the release of bound heat shock transcription factor and is modulated by changes in growth and in heat shock temperatures. Genes Dev 5: 2117-2127. doi: 10.1101/gad.5.11.2117
|
| [83] | Morley JF, Morimoto RI (2004) Regulation of Longevity in Caenorhabditis elegans by Heat Shock Factor and Molecular Chaperones. Mol Biol Cell 15: 657-664. |
| [84] | Lindquist SL, Kelly JW (2011) Chemical and biological approaches for adapting proteostasis to ameliorate protein misfolding and aggregation diseases: progress and prognosis. Cold Spring Harb Perspect Biol 3: a004507 |
| [85] |
Akerfelt M, Trouillet D, Mezger V, et al. (2007) Heat shock factors at a crossroad between stress and development. Ann N Y Acad Sci 1113: 15-27. doi: 10.1196/annals.1391.005
|
| [86] | Ostling P, Björk JK, Roos-Mattjus P, et al. (2007) Heat shock factor 2 (HSF2) contributes to inducible expression of hsp genes through interplay with HSF1. J Biol Chem 282: 7077-7086. |
| [87] |
Shinkawa T, Tan K, Fujimoto M, et al. (2011) Heat shock factor 2 is required for maintaining proteostasis against febrile-range thermal stress and polyglutamine aggregation. Mol Biol Cell 22: 3571-3583. doi: 10.1091/mbc.E11-04-0330
|
| [88] |
Xie J, Tang L, Lu L, et al. (2014) Differential expression of heat shock transcription factors and heat shock proteins after acute and chronic heat stress in laying chickens (Gallus gallus). PloS One 9: e102204. doi: 10.1371/journal.pone.0102204
|
| [89] |
Shi Y, Mosser DD, Morimoto RI (1998) Molecular chaperones as HSF1-specific transcriptional repressors. Genes Dev 12: 654-666. doi: 10.1101/gad.12.5.654
|
| [90] |
Zou J, Guo Y, Guettouche T, et al. (1998) Repression of heat shock transcription factor HSF1 activation by HSP90 (HSP90 complex) that forms a stress-sensitive complex with HSF1. Cell 94: 471-480. doi: 10.1016/S0092-8674(00)81588-3
|
| [91] |
Morimoto RI (1998) Regulation of the heat shock transcriptional response: cross talk between a family of heat shock factors, molecular chaperones, and negative regulators. Genes Dev 12: 3788-3796. doi: 10.1101/gad.12.24.3788
|
| [92] |
Vujanac M, Fenaroli A, Zimarino V (2005) Constitutive nuclear import and stress-regulated nucleocytoplasmic shuttling of mammalian heat-shock factor 1. Traffic Cph Den 6: 214-229. doi: 10.1111/j.1600-0854.2005.00266.x
|
| [93] |
Whitesell L, Lindquist S (2009) Inhibiting the transcription factor HSF1 as an anticancer strategy. Expert Opin Ther Targets 13: 469-478. doi: 10.1517/14728220902832697
|
| [94] |
Lis J, Wu C (1993) Protein traffic on the heat shock promoter: parking, stalling, and trucking along. Cell 74: 1-4. doi: 10.1016/0092-8674(93)90286-Y
|
| [95] |
Hong Y, Rogers R, Matunis MJ, et al. (2001) Regulation of Heat Shock Transcription Factor 1 by Stress-induced SUMO-1 Modification. J Biol Chem 276: 40263-40267. doi: 10.1074/jbc.M104714200
|
| [96] |
Guettouche T, Boellmann F, Lane WS, et al. (2005) Analysis of phosphorylation of human heat shock factor 1 in cells experiencing a stress. BMC Biochem 6: 4. doi: 10.1186/1471-2091-6-4
|
| [97] |
Shamovsky I, Nudler E (2008) New insights into the mechanism of heat shock response activation. Cell Mol Life Sci CMLS 65: 855-861. doi: 10.1007/s00018-008-7458-y
|
| [98] |
Westerheide SD, Anckar J, Stevens SM, et al. (2009) Stress-inducible regulation of heat shock factor 1 by the deacetylase SIRT1. Science 323: 1063-1066. doi: 10.1126/science.1165946
|
| [99] |
Gómez AV, Galleguillos D, Maass JC, et al. (2008) CoREST represses the heat shock response mediated by HSF1. Mol Cell 31: 222-231. doi: 10.1016/j.molcel.2008.06.015
|
| [100] |
Xu D, Zalmas LP, La Thangue NB (2008) A transcription cofactor required for the heat-shock response. EMBO Rep 9: 662-669. doi: 10.1038/embor.2008.70
|
| [101] |
Baler R, Welch WJ, Voellmy R (1992) Heat shock gene regulation by nascent polypeptides and denatured proteins: hsp70 as a potential autoregulatory factor. J Cell Biol 117: 1151-1159. doi: 10.1083/jcb.117.6.1151
|
| [102] |
Powers MV, Workman P (2007) Inhibitors of the heat shock response: Biology and pharmacology. FEBS Lett 581: 3758-3769. doi: 10.1016/j.febslet.2007.05.040
|
| [103] |
Van Oosten-Hawle P, Morimoto RI (2014) Transcellular chaperone signaling: an organismal strategy for integrated cell stress responses. J Exp Biol 217: 129-136. doi: 10.1242/jeb.091249
|
| [104] |
Feder JH, Rossi JM, Solomon J, et al. (1992) The consequences of expressing hsp70 in Drosophila cells at normal temperatures. Genes Dev 6: 1402-1413. doi: 10.1101/gad.6.8.1402
|
| [105] |
Braakman I, Bulleid NJ (2011) Protein folding and modification in the mammalian endoplasmic reticulum. Annu Rev Biochem 80: 71-99. doi: 10.1146/annurev-biochem-062209-093836
|
| [106] |
Wang S, Kaufman RJ (2012) The impact of the unfolded protein response on human disease. J Cell Biol 197: 857-867. doi: 10.1083/jcb.201110131
|
| [107] |
Cox JS, Shamu CE, Walter P (1993) Transcriptional induction of genes encoding endoplasmic reticulum resident proteins requires a transmembrane protein kinase. Cell 73: 1197-1206. doi: 10.1016/0092-8674(93)90648-A
|
| [108] |
Mori K, Ma W, Gething MJ, et al. (1993) A transmembrane protein with a cdc2+/CDC28-related kinase activity is required for signaling from the ER to the nucleus. Cell 74: 743-756. doi: 10.1016/0092-8674(93)90521-Q
|
| [109] | Shamu CE, Walter P (1996) Oligomerization and phosphorylation of the Ire1p kinase during intracellular signaling from the endoplasmic reticulum to the nucleus. EMBO J 15: 3028-3039. |
| [110] |
Yoshida H, Matsui T, Yamamoto A, et al. (2001) XBP1 mRNA is induced by ATF6 and spliced by IRE1 in response to ER stress to produce a highly active transcription factor. Cell 107: 881-891. doi: 10.1016/S0092-8674(01)00611-0
|
| [111] |
Calfon M, Zeng H, Urano F, et al. (2002) IRE1 couples endoplasmic reticulum load to secretory capacity by processing the XBP-1 mRNA. Nature 415: 92-96. doi: 10.1038/415092a
|
| [112] |
Hetz C, Martinon F, Rodriguez D, et al. (2011) The unfolded protein response: integrating stress signals through the stress sensor IRE1α. Physiol Rev 91: 1219-1243. doi: 10.1152/physrev.00001.2011
|
| [113] |
Urano F, Wang X, Bertolotti A, et al. (2000) Coupling of stress in the ER to activation of JNK protein kinases by transmembrane protein kinase IRE1. Science 287: 664-666. doi: 10.1126/science.287.5453.664
|
| [114] | Yoneda T, Imaizumi K, Oono K, et al. (2001) Activation of caspase-12, an endoplastic reticulum (ER) resident caspase, through tumor necrosis factor receptor-associated factor 2-dependent mechanism in response to the ER stress. J Biol Chem 276: 13935-13940. |
| [115] |
Nishitoh H, Matsuzawa A, Tobiume K, et al. (2002) ASK1 is essential for endoplasmic reticulum stress-induced neuronal cell death triggered by expanded polyglutamine repeats. Genes Dev 16: 1345-1355. doi: 10.1101/gad.992302
|
| [116] |
Hetz C, Bernasconi P, Fisher J, et al. (2006) Proapoptotic BAX and BAK Modulate the Unfolded Protein Response by a Direct Interaction with IRE1α. Science 312: 572-576. doi: 10.1126/science.1123480
|
| [117] | Shi Y, Vattem KM, Sood R, et al. (1998) Identification and characterization of pancreatic eukaryotic initiation factor 2 alpha-subunit kinase, PEK, involved in translational control. Mol Cell Biol 18: 7499-7509. |
| [118] |
Harding HP, Zhang Y, Bertolotti A, et al. (2000) Perk is essential for translational regulation and cell survival during the unfolded protein response. Mol Cell 5: 897-904. doi: 10.1016/S1097-2765(00)80330-5
|
| [119] |
Scheuner D, Song B, McEwen E, et al. (2001) Translational control is required for the unfolded protein response and in vivo glucose homeostasis. Mol Cell 7: 1165-1176. doi: 10.1016/S1097-2765(01)00265-9
|
| [120] |
Harding HP, Novoa I, Zhang Y, et al. (2000) Regulated translation initiation controls stress-induced gene expression in mammalian cells. Mol Cell 6: 1099-1108. doi: 10.1016/S1097-2765(00)00108-8
|
| [121] |
Harding HP, Zhang Y, Zeng H, et al. (2003) An Integrated Stress Response Regulates Amino Acid Metabolism and Resistance to Oxidative Stress. Mol Cell 11: 619-633. doi: 10.1016/S1097-2765(03)00105-9
|
| [122] |
Ameri K, Harris AL (2008) Activating transcription factor 4. Int J Biochem Cell Biol 40: 14-21. doi: 10.1016/j.biocel.2007.01.020
|
| [123] |
Connor JH, Weiser DC, Li S, et al. (2001) Growth Arrest and DNA Damage-Inducible Protein GADD34 Assembles a Novel Signaling Complex Containing Protein Phosphatase 1 and Inhibitor 1. Mol Cell Biol 21: 6841-6850. doi: 10.1128/MCB.21.20.6841-6850.2001
|
| [124] |
Novoa I, Zeng H, Harding HP, et al. (2001) Feedback Inhibition of the Unfolded Protein Response by GADD34-Mediated Dephosphorylation of eIF2α. J Cell Biol 153: 1011-1022. doi: 10.1083/jcb.153.5.1011
|
| [125] |
Ma Y, Hendershot LM (2003) Delineation of a negative feedback regulatory loop that controls protein translation during endoplasmic reticulum stress. J Biol Chem 278: 34864-34873. doi: 10.1074/jbc.M301107200
|
| [126] |
Cullinan SB, Zhang D, Hannink M, et al. (2003) Nrf2 Is a Direct PERK Substrate and Effector of PERK-Dependent Cell Survival. Mol Cell Biol 23: 7198-7209. doi: 10.1128/MCB.23.20.7198-7209.2003
|
| [127] |
Ye J, Rawson RB, Komuro R, et al. (2000) ER stress induces cleavage of membrane-bound ATF6 by the same proteases that process SREBPs. Mol Cell 6: 1355-1364. doi: 10.1016/S1097-2765(00)00133-7
|
| [128] |
Okada T, Yoshida H, Akazawa R, et al. (2002) Distinct roles of activating transcription factor 6 (ATF6) and double-stranded RNA-activated protein kinase-like endoplasmic reticulum kinase (PERK) in transcription during the mammalian unfolded protein response. Biochem J 366: 585-594. doi: 10.1042/BJ20020391
|
| [129] |
Adachi Y, Yamamoto K, Okada T, et al. (2008) ATF6 is a transcription factor specializing in the regulation of quality control proteins in the endoplasmic reticulum. Cell Struct Funct 33: 75-89. doi: 10.1247/csf.07044
|
| [130] | Tirosh B, Iwakoshi NN, Glimcher LH, et al. (2006) Rapid Turnover of Unspliced Xbp-1 as a Factor That Modulates the Unfolded Protein Response. J Biol Chem 281: 5852-5860. |
| [131] |
Yoshida H, Oku M, Suzuki M, et al. (2006) pXBP1(U) encoded in XBP1 pre-mRNA negatively regulates unfolded protein response activator pXBP1(S) in mammalian ER stress response. J Cell Biol 172: 565-575. doi: 10.1083/jcb.200508145
|
| [132] |
Yoshida H, Uemura A, Mori K (2009) pXBP1(U), a negative regulator of the unfolded protein response activator pXBP1(S), targets ATF6 but not ATF4 in proteasome-mediated degradation. Cell Struct Funct 34: 1-10. doi: 10.1247/csf.06028
|
| [133] |
Oyadomari S, Yun C, Fisher EA, et al. (2006) Cotranslocational degradation protects the stressed endoplasmic reticulum from protein overload. Cell 126: 727-739. doi: 10.1016/j.cell.2006.06.051
|
| [134] |
Yamamoto K, Sato T, Matsui T, et al. (2007) Transcriptional induction of mammalian ER quality control proteins is mediated by single or combined action of ATF6alpha and XBP1. Dev Cell 13: 365-376. doi: 10.1016/j.devcel.2007.07.018
|
| [135] |
Zhao Q, Wang J, Levichkin IV, et al. (2002) A mitochondrial specific stress response in mammalian cells. EMBO J 21: 4411-4419. doi: 10.1093/emboj/cdf445
|
| [136] |
Benedetti C, Haynes CM, Yang Y, et al. (2006) Ubiquitin-Like Protein 5 Positively Regulates Chaperone Gene Expression in the Mitochondrial Unfolded Protein Response. Genetics 174: 229-239. doi: 10.1534/genetics.106.061580
|
| [137] | Aldridge JE, Horibe T, Hoogenraad NJ (2007) Discovery of Genes Activated by the Mitochondrial Unfolded Protein Response (mtUPR) and Cognate Promoter Elements. PLoS ONE 2: e874 |
| [138] |
Haynes CM, Petrova K, Benedetti C, et al. (2007) ClpP mediates activation of a mitochondrial unfolded protein response in C. elegans. Dev Cell 13: 467-480. doi: 10.1016/j.devcel.2007.07.016
|
| [139] | Horibe T, Hoogenraad NJ (2007) The Chop Gene Contains an Element for the Positive Regulation of the Mitochondrial Unfolded Protein Response. PLoS ONE 2: e835 |
| [140] | Haynes CM, Yang Y, Blais SP, et al. (2010) The matrix peptide exporter HAF-1 signals a mitochondrial UPR by activating the transcription factor ZC376.7 in C. elegans. Mol Cell 37: 529-540. |
| [141] |
Nargund AM, Pellegrino MW, Fiorese CJ, et al. (2012) Mitochondrial Import Efficiency of ATFS-1 Regulates Mitochondrial UPR Activation. Science 337: 587-590. doi: 10.1126/science.1223560
|
| [142] |
Baker BM, Nargund AM, Sun T, et al. (2012) Protective coupling of mitochondrial function and protein synthesis via the eIF2α kinase GCN-2. PLoS Genet 8: e1002760. doi: 10.1371/journal.pgen.1002760
|
| [143] |
Runkel ED, Liu S, Baumeister R, et al. (2013) Surveillance-activated defenses block the ROS-induced mitochondrial unfolded protein response. PLoS Genet 9: e1003346. doi: 10.1371/journal.pgen.1003346
|
| [144] |
Jovaisaite V, Mouchiroud L, Auwerx J (2014) The mitochondrial unfolded protein response, a conserved stress response pathway with implications in health and disease. J Exp Biol 217: 137-143. doi: 10.1242/jeb.090738
|
| [145] |
Shibata Y, Morimoto RI (2014) How the nucleus copes with proteotoxic stress. Curr Biol 24: R463-R474. doi: 10.1016/j.cub.2014.03.033
|
| [146] |
Fried H, Kutay U (2003) Nucleocytoplasmic transport: taking an inventory. Cell Mol Life Sci 60: 1659-1688. doi: 10.1007/s00018-003-3070-3
|
| [147] |
Melchior F, Gerace L (1995) Mechanisms of nuclear protein import. Curr Opin Cell Biol 7: 310-318. doi: 10.1016/0955-0674(95)80084-0
|
| [148] |
Longshaw VM, Chapple JP, Balda MS, et al. (2004) Nuclear translocation of the Hsp70/Hsp90 organizing protein mSTI1 is regulated by cell cycle kinases. J Cell Sci 117: 701-710. doi: 10.1242/jcs.00905
|
| [149] |
Dezwaan DC, Freeman BC (2008) HSP90: the Rosetta stone for cellular protein dynamics? Cell Cycle Georget Tex 7: 1006-1012. doi: 10.4161/cc.7.8.5723
|
| [150] |
Furuta M, Kose S, Koike M, et al. (2004) Heat-shock induced nuclear retention and recycling inhibition of importin alpha. Genes Cells Devoted Mol Cell Mech 9: 429-441. doi: 10.1111/j.1356-9597.2004.00734.x
|
| [151] |
Miyamoto Y, Saiwaki T, Yamashita J, et al. (2004) Cellular stresses induce the nuclear accumulation of importin alpha and cause a conventional nuclear import block. J Cell Biol 165: 617-623. doi: 10.1083/jcb.200312008
|
| [152] |
Kose S, Furuta M, Imamoto N (2012) Hikeshi, a nuclear import carrier for Hsp70s, protects cells from heat shock-induced nuclear damage. Cell 149: 578-589. doi: 10.1016/j.cell.2012.02.058
|
| [153] |
DiFiglia M, Sapp E, Chase KO, et al. (1997) Aggregation of huntingtin in neuronal intranuclear inclusions and dystrophic neurites in brain. Science 277: 1990-1993. doi: 10.1126/science.277.5334.1990
|
| [154] |
Paulson HL, Perez MK, Trottier Y, et al. (1997) Intranuclear inclusions of expanded polyglutamine protein in spinocerebellar ataxia type 3. Neuron 19: 333-344. doi: 10.1016/S0896-6273(00)80943-5
|
| [155] |
Udan-Johns M, Bengoechea R, Bell S, et al. (2014) Prion-like nuclear aggregation of TDP-43 during heat shock is regulated by HSP40/70 chaperones. Hum Mol Genet 23: 157-170. doi: 10.1093/hmg/ddt408
|
| [156] |
Kim S, Nollen EAA, Kitagawa K, et al. (2002) Polyglutamine protein aggregates are dynamic. Nat Cell Biol 4: 826-831. doi: 10.1038/ncb863
|
| [157] |
Lee DH, Goldberg AL (1998) Proteasome inhibitors: valuable new tools for cell biologists. Trends Cell Biol 8: 397-403. doi: 10.1016/S0962-8924(98)01346-4
|
| [158] |
Deshaies RJ, Joazeiro CAP (2009) RING domain E3 ubiquitin ligases. Annu Rev Biochem 78: 399-434. doi: 10.1146/annurev.biochem.78.101807.093809
|
| [159] | Ristic G, Tsou W-L, Todi SV (2014) An optimal ubiquitin-proteasome pathway in the nervous system: the role of deubiquitinating enzymes. Front Mol Neurosci 7: 72. |
| [160] |
Bhattacharyya S, Yu H, Mim C, et al. (2014) Regulated protein turnover: snapshots of the proteasome in action. Nat Rev Mol Cell Biol 15: 122-133. doi: 10.1038/nrm3741
|
| [161] |
Bedford L, Paine S, Sheppard PW, et al. (2010) Assembly, structure, and function of the 26S proteasome. Trends Cell Biol 20: 391-401. doi: 10.1016/j.tcb.2010.03.007
|
| [162] |
Clark PL (2004) Protein folding in the cell: reshaping the folding funnel. Trends Biochem Sci 29: 527-534. doi: 10.1016/j.tibs.2004.08.008
|
| [163] |
Kloetzel PM, Ossendorp F (2004) Proteasome and peptidase function in MHC-class-I-mediated antigen presentation. Curr Opin Immunol 16: 76-81. doi: 10.1016/j.coi.2003.11.004
|
| [164] |
Kriegenburg F, Ellgaard L, Hartmann-Petersen R (2012) Molecular chaperones in targeting misfolded proteins for ubiquitin-dependent degradation. FEBS J 279: 532-542. doi: 10.1111/j.1742-4658.2011.08456.x
|
| [165] |
Von Mikecz A (2006) The nuclear ubiquitin-proteasome system. J Cell Sci 119: 1977-1984. doi: 10.1242/jcs.03008
|
| [166] |
Bader N, Jung T, Grune T (2007) The proteasome and its role in nuclear protein maintenance. Exp Gerontol 42: 864-870. doi: 10.1016/j.exger.2007.03.010
|
| [167] |
Ullrich O, Reinheckel T, Sitte N, et al. (1999) Poly-ADP ribose polymerase activates nuclear proteasome to degrade oxidatively damaged histones. Proc Natl Acad Sci U S A 96: 6223-6228. doi: 10.1073/pnas.96.11.6223
|
| [168] |
Andersen JS, Lam YW, Leung AKL, et al. (2005) Nucleolar proteome dynamics. Nature 433: 77-83. doi: 10.1038/nature03207
|
| [169] |
Janer A, Martin E, Muriel M-P, et al. (2006) PML clastosomes prevent nuclear accumulation of mutant ataxin-7 and other polyglutamine proteins. J Cell Biol 174: 65-76. doi: 10.1083/jcb.200511045
|
| [170] |
Lam YW, Lamond AI, Mann M, et al. (2007) Analysis of nucleolar protein dynamics reveals the nuclear degradation of ribosomal proteins. Curr Biol 17: 749-760. doi: 10.1016/j.cub.2007.03.064
|
| [171] |
Iwata A, Nagashima Y, Matsumoto L, et al. (2009) Intranuclear Degradation of Polyglutamine Aggregates by the Ubiquitin-Proteasome System. J Biol Chem 284: 9796-9803. doi: 10.1074/jbc.M809739200
|
| [172] |
Catic A, Suh CY, Hill CT, et al. (2013) Genome-wide map of nuclear protein degradation shows NCoR1 turnover as a key to mitochondrial gene regulation. Cell 155: 1380-1395. doi: 10.1016/j.cell.2013.11.016
|
| [173] |
Komander D, Rape M (2012) The Ubiquitin Code. Annu Rev Biochem 81: 203-229. doi: 10.1146/annurev-biochem-060310-170328
|
| [174] |
Kraft C, Peter M, Hofmann K (2010) Selective autophagy: ubiquitin-mediated recognition and beyond. Nat Cell Biol 12: 836-841. doi: 10.1038/ncb0910-836
|
| [175] |
Nathan JA, Kim HT, Ting L, et al. (2013) Why do cellular proteins linked to K63-polyubiquitin chains not associate with proteasomes? EMBO J 32: 552-565. doi: 10.1038/emboj.2012.354
|
| [176] |
Wang F, Durfee LA, Huibregtse JM (2013) A cotranslational ubiquitination pathway for quality control of misfolded proteins. Mol Cell 50: 368-378. doi: 10.1016/j.molcel.2013.03.009
|
| [177] |
Seet BT, Dikic I, Zhou M-M, et al. (2006) Reading protein modifications with interaction domains. Nat Rev Mol Cell Biol 7: 473-483. doi: 10.1038/nrm1960
|
| [178] |
Sekijima Y, Wiseman RL, Matteson J, et al. (2005) The biological and chemical basis for tissue-selective amyloid disease. Cell 121: 73-85. doi: 10.1016/j.cell.2005.01.018
|
| [179] |
Taxis C, Hitt R, Park S-H, et al. (2003) Use of modular substrates demonstrates mechanistic diversity and reveals differences in chaperone requirement of ERAD. J Biol Chem 278: 35903-35913. doi: 10.1074/jbc.M301080200
|
| [180] |
Vashist S, Ng DTW (2004) Misfolded proteins are sorted by a sequential checkpoint mechanism of ER quality control. J Cell Biol 165: 41-52. doi: 10.1083/jcb.200309132
|
| [181] |
Carvalho P, Goder V, Rapoport TA (2006) Distinct ubiquitin-ligase complexes define convergent pathways for the degradation of ER proteins. Cell 126: 361-373. doi: 10.1016/j.cell.2006.05.043
|
| [182] | Araki K, Nagata K (2011) Protein folding and quality control in the ER. Cold Spring Harb Perspect Biol 3: a007526. |
| [183] |
Chapman E, Fry AN, Kang M (2011) The complexities of p97 function in health and disease. Mol Biosyst 7: 700-710. doi: 10.1039/C0MB00176G
|
| [184] |
Medicherla B, Kostova Z, Schaefer A, et al. (2004) A genomic screen identifies Dsk2p and Rad23p as essential components of ER-associated degradation. EMBO Rep 5: 692-697. doi: 10.1038/sj.embor.7400164
|
| [185] |
Claessen JHL, Ploegh HL (2011) BAT3 guides misfolded glycoproteins out of the endoplasmic reticulum. PloS One 6: e28542. doi: 10.1371/journal.pone.0028542
|
| [186] |
Xu Y, Cai M, Yang Y, et al. (2012) SGTA recognizes a noncanonical ubiquitin-like domain in the Bag6-Ubl4A-Trc35 complex to promote endoplasmic reticulum-associated degradation. Cell Rep 2: 1633-1644. doi: 10.1016/j.celrep.2012.11.010
|
| [187] | Codogno P, Meijer AJ (2005) Autophagy and signaling: their role in cell survival and cell death. Cell Death Differ 12 Suppl 2: 1509-1518. |
| [188] | Cuervo AM, Wong ESP, Martinez-Vicente M (2010) Protein degradation, aggregation, and misfolding. Mov Disord Off J Mov Disord Soc 25 Suppl 1: S49-S54. |
| [189] |
Ciechanover A, Kwon YT (2015) Degradation of misfolded proteins in neurodegenerative diseases: therapeutic targets and strategies. Exp Mol Med 47: e147. doi: 10.1038/emm.2014.117
|
| [190] |
Nixon RA (2013) The role of autophagy in neurodegenerative disease. Nat Med 19: 983-997. doi: 10.1038/nm.3232
|
| [191] |
Kiffin R, Christian C, Knecht E, et al. (2004) Activation of chaperone-mediated autophagy during oxidative stress. Mol Biol Cell 15: 4829-4840. doi: 10.1091/mbc.E04-06-0477
|
| [192] |
Wang G, Mao Z (2014) Chaperone-mediated autophagy: roles in neurodegeneration. Transl Neurodegener 3: 20. doi: 10.1186/2047-9158-3-20
|
| [193] |
Eskelinen E-L, Illert AL, Tanaka Y, et al. (2002) Role of LAMP-2 in lysosome biogenesis and autophagy. Mol Biol Cell 13: 3355-3368. doi: 10.1091/mbc.E02-02-0114
|
| [194] | Saftig P, Klumperman J (2009) Lysosome biogenesis and lysosomal membrane proteins: trafficking meets function. Nat Rev Mol Cell Biol 10: 623-635. |
| [195] |
Hara T, Nakamura K, Matsui M, et al. (2006) Suppression of basal autophagy in neural cells causes neurodegenerative disease in mice. Nature 441: 885-889. doi: 10.1038/nature04724
|
| [196] |
Komatsu M, Waguri S, Chiba T, et al. (2006) Loss of autophagy in the central nervous system causes neurodegeneration in mice. Nature 441: 880-884. doi: 10.1038/nature04723
|
| [197] |
Oosten-Hawle P van, Morimoto RI (2014) Organismal proteostasis: role of cell-nonautonomous regulation and transcellular chaperone signaling. Genes Dev 28: 1533-1543. doi: 10.1101/gad.241125.114
|
| [198] |
Garcia SM, Casanueva MO, Silva MC, et al. (2007) Neuronal signaling modulates protein homeostasis in Caenorhabditis elegans post-synaptic muscle cells. Genes Dev 21: 3006-3016. doi: 10.1101/gad.1575307
|
| [199] |
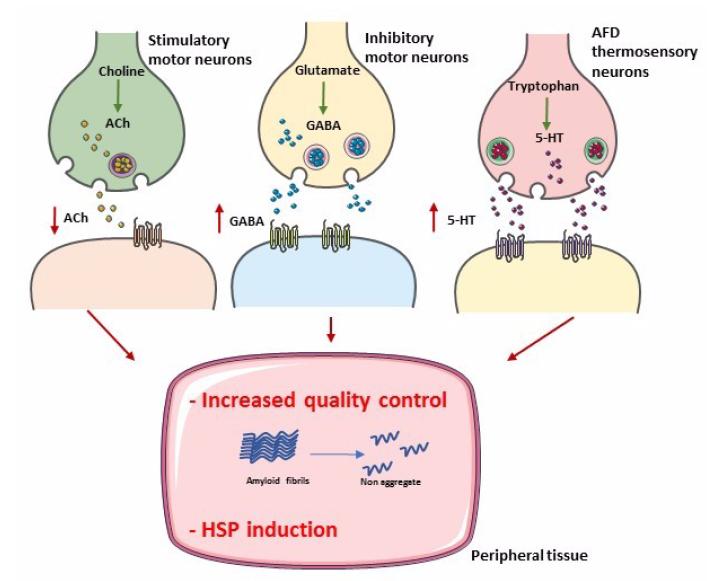
Prahlad V, Cornelius T, Morimoto RI (2008) Regulation of the cellular heat shock response in Caenorhabditis elegans by thermosensory neurons. Science 320: 811-814. doi: 10.1126/science.1156093
|
| [200] |
Mori I, Sasakura H, Kuhara A (2007) Worm thermotaxis: a model system for analyzing thermosensation and neural plasticity. Curr Opin Neurobiol 17: 712-719. doi: 10.1016/j.conb.2007.11.010
|
| [201] |
Prahlad V, Morimoto RI (2011) Neuronal circuitry regulates the response of Caenorhabditis elegans to misfolded proteins. Proc Natl Acad Sci U S A 108: 14204-14209. doi: 10.1073/pnas.1106557108
|
| [202] |
Sugi T, Nishida Y, Mori I (2011) Regulation of behavioral plasticity by systemic temperature signaling in Caenorhabditis elegans. Nat Neurosci 14: 984-992. doi: 10.1038/nn.2854
|
| [203] | Fawcett TW, Sylvester SL, Sarge KD, et al. (1994) Effects of neurohormonal stress and aging on the activation of mammalian heat shock factor 1. J Biol Chem 269: 32272-32278. |
| [204] |
Maman M, Carvalhal Marques F, Volovik Y, et al. (2013) A neuronal GPCR is critical for the induction of the heat shock response in the nematode C. elegans. J Neurosci Off J Soc Neurosci 33: 6102-6111. doi: 10.1523/JNEUROSCI.4023-12.2013
|
| [205] | Tatum MC, Ooi FK, Chikka MR, et al. (2015) Neuronal Serotonin Release Triggers the Heat Shock Response in C. elegans in the Absence of Temperature Increase. Curr Biol 25: 163-174. |
| [206] |
Styer KL, Singh V, Macosko E, et al. (2008) Innate immunity in Caenorhabditis elegans is regulated by neurons expressing NPR-1/GPCR. Science 322: 460-464. doi: 10.1126/science.1163673
|
| [207] |
Sun J, Singh V, Kajino-Sakamoto R, et al. (2011) Neuronal GPCR Controls Innate Immunity by Regulating Non-Canonical Unfolded Protein Response Genes. Science 332: 729-732. doi: 10.1126/science.1203411
|
| [208] |
Zhang Y, Lu H, Bargmann CI (2005) Pathogenic bacteria induce aversive olfactory learning in Caenorhabditis elegans. Nature 438: 179-184. doi: 10.1038/nature04216
|
| [209] |
Pradel E, Zhang Y, Pujol N, et al. (2007) Detection and avoidance of a natural product from the pathogenic bacterium Serratia marcescens by Caenorhabditis elegans. Proc Natl Acad Sci U S A 104: 2295-2300. doi: 10.1073/pnas.0610281104
|
| [210] | Anyanful A, Easley KA, Benian GM, et al. (2009) Conditioning protects C. elegans from lethal effects of enteropathogenic E. coli through activation of genes that regulate lifespan and innate immunity. Cell Host Microbe 5: 450-462. |
| [211] |
Sun J, Liu Y, Aballay A (2012) Organismal regulation of XBP-1-mediated unfolded protein response during development and immune activation. EMBO Rep 13: 855-860. doi: 10.1038/embor.2012.100
|
| [212] |
Taylor RC, Dillin A (2013) XBP-1 is a cell-nonautonomous regulator of stress resistance and longevity. Cell 153: 1435-1447. doi: 10.1016/j.cell.2013.05.042
|
| [213] |
Kozlowski L, Garvis S, Bedet C, et al. (2014) The Caenorhabditis elegans HP1 family protein HPL-2 maintains ER homeostasis through the UPR and hormesis. Proc Natl Acad Sci U S A 111: 5956-5961. doi: 10.1073/pnas.1321698111
|
| [214] |
Durieux J, Wolff S, Dillin A (2011) The cell-non-autonomous nature of electron transport chain-mediated longevity. Cell 144: 79-91. doi: 10.1016/j.cell.2010.12.016
|
| [215] | Mizzen LA, Chang C, Garrels JI, et al. (1989) Identification, characterization, and purification of two mammalian stress proteins present in mitochondria, grp 75, a member of the hsp 70 family and hsp 58, a homolog of the bacterial groEL protein. J Biol Chem 264: 20664-20675. |
| [216] |
Wanrooij S, Falkenberg M (2010) The human mitochondrial replication fork in health and disease. Biochim Biophys Acta 1797: 1378-1388. doi: 10.1016/j.bbabio.2010.04.015
|
| [217] |
Tan K, Fujimoto M, Takii R, et al. (2015) Mitochondrial SSBP1 protects cells from proteotoxic stresses by potentiating stress-induced HSF1 transcriptional activity. Nat Commun 6: 6580. doi: 10.1038/ncomms7580
|
| [218] |
Van Oosten-Hawle P, Porter RS, Morimoto RI (2013) Regulation of organismal proteostasis by trans-cellular chaperone signaling. Cell 153: 1366-1378. doi: 10.1016/j.cell.2013.05.015
|
| [219] |
Amaducci L, Tesco G (1994) Aging as a major risk for degenerative diseases of the central nervous system. Curr Opin Neurol 7: 283-286. doi: 10.1097/00019052-199408000-00001
|
| [220] |
David DC, Ollikainen N, Trinidad JC, et al. (2010) Widespread Protein Aggregation as an Inherent Part of Aging in C. elegans. PLoS Biol 8: e1000450. doi: 10.1371/journal.pbio.1000450
|
| [221] |
Cuervo AM, Dice JF (2000) Age-related decline in chaperone-mediated autophagy. J Biol Chem 275: 31505-31513. doi: 10.1074/jbc.M002102200
|
| [222] |
Tonoki A, Kuranaga E, Tomioka T, et al. (2009) Genetic Evidence Linking Age-Dependent Attenuation of the 26S Proteasome with the Aging Process. Mol Cell Biol 29: 1095-1106. doi: 10.1128/MCB.01227-08
|
| [223] |
Brehme M, Voisine C, Rolland T, et al. (2014) A Chaperome Subnetwork Safeguards Proteostasis in Aging and Neurodegenerative Disease. Cell Rep 9: 1135-1150. doi: 10.1016/j.celrep.2014.09.042
|
| [224] |
Ben-Zvi A, Miller EA, Morimoto RI (2009) Collapse of proteostasis represents an early molecular event in Caenorhabditis elegans aging. Proc Natl Acad Sci U S A 106: 14914-14919 doi: 10.1073/pnas.0902882106
|
| [225] | Kenyon C, Chang J, Gensch E, et al. (1993) A C. elegans mutant that lives twice as long as wild type. Nature 366: 461-464. |
| [226] |
Kenyon C (2001) A conserved regulatory system for aging. Cell 105: 165-168. doi: 10.1016/S0092-8674(01)00306-3
|
| [227] |
Giannakou ME, Partridge L (2007) Role of insulin-like signalling in Drosophila lifespan. Trends Biochem Sci 32: 180-188. doi: 10.1016/j.tibs.2007.02.007
|
| [228] |
Blüher M, Kahn BB, Kahn CR (2003) Extended Longevity in Mice Lacking the Insulin Receptor in Adipose Tissue. Science 299: 572-574. doi: 10.1126/science.1078223
|
| [229] |
Holzenberger M, Dupont J, Ducos B, et al. (2003) IGF-1 receptor regulates lifespan and resistance to oxidative stress in mice. Nature 421: 182-187. doi: 10.1038/nature01298
|
| [230] |
Taguchi A, Wartschow LM, White MF (2007) Brain IRS2 Signaling Coordinates Life Span and Nutrient Homeostasis. Science 317: 369-372. doi: 10.1126/science.1142179
|
| [231] |
Mair W, Dillin A (2008) Aging and Survival: The Genetics of Life Span Extension by Dietary Restriction. Annu Rev Biochem 77: 727-754. doi: 10.1146/annurev.biochem.77.061206.171059
|
| [232] |
Morris JZ, Tissenbaum HA, Ruvkun G (1996) A phosphatidylinositol-3-OH kinase family member regulating longevity and diapause in Caenorhabditis elegans. Nature 382: 536-539. doi: 10.1038/382536a0
|
| [233] |
Henderson ST, Johnson TE (2001) daf-16 integrates developmental and environmental inputs to mediate aging in the nematode Caenorhabditis elegans. Curr Biol 11: 1975-1980. doi: 10.1016/S0960-9822(01)00594-2
|
| [234] | Lee RY, Hench J, Ruvkun G (2001) Regulation of C. elegans DAF-16 and its human ortholog FKHRL1 by the daf-2 insulin-like signaling pathway. Curr Biol 11: 1950-1957. |
| [235] |
Lin K, Hsin H, Libina N, et al. (2001) Regulation of the Caenorhabditis elegans longevity protein DAF-16 by insulin/IGF-1 and germline signaling. Nat Genet 28: 139-145. doi: 10.1038/88850
|
| [236] | Lee SS, Kennedy S, Tolonen AC, et al. (2003) DAF-16 target genes that control C. elegans life-span and metabolism. Science 300: 644-647. |
| [237] |
McElwee J, Bubb K, Thomas JH (2003) Transcriptional outputs of the Caenorhabditis elegans forkhead protein DAF-16. Aging Cell 2: 111-121. doi: 10.1046/j.1474-9728.2003.00043.x
|
| [238] |
Murphy CT, McCarroll SA, Bargmann CI, et al. (2003) Genes that act downstream of DAF-16 to influence the lifespan of Caenorhabditis elegans. Nature 424: 277-283. doi: 10.1038/nature01789
|
| [239] |
Wook Oh S, Mukhopadhyay A, Dixit BL, et al. (2006) Identification of direct DAF-16 targets controlling longevity, metabolism and diapause by chromatin immunoprecipitation. Nat Genet 38: 251-257. doi: 10.1038/ng1723
|
| [240] | Samuelson AV, Carr CE, Ruvkun G (2007) Gene activities that mediate increased life span of C. elegans insulin-like signaling mutants. Genes Dev 21: 2976-2994. |
| [241] |
Tullet J (2008) Direct Inhibition of the Longevity-Promoting Factor SKN-1 by Insulin-like Signaling in C. elegans. Cell 132: 1025-1038. doi: 10.1016/j.cell.2008.01.030
|
| [242] |
Lithgow GJ, White TM, Melov S, et al. (1995) Thermotolerance and extended life-span conferred by single-gene mutations and induced by thermal stress. Proc Natl Acad Sci U S A 92: 7540-7544. doi: 10.1073/pnas.92.16.7540
|
| [243] | Garigan D, Hsu A-L, Fraser AG, et al. (2002) Genetic analysis of tissue aging in Caenorhabditis elegans: a role for heat-shock factor and bacterial proliferation. Genetics 161: 1101-1112. |
| [244] |
Herndon LA, Schmeissner PJ, Dudaronek JM, et al. (2002) Stochastic and genetic factors influence tissue-specific decline in ageing C. elegans. Nature 419: 808-814. doi: 10.1038/nature01135
|
| [245] |
Hsu A-L, Murphy CT, Kenyon C (2003) Regulation of Aging and Age-Related Disease by DAF-16 and Heat-Shock Factor. Science 300: 1142-1145. doi: 10.1126/science.1083701
|
| [246] |
Kenyon C (2005) The plasticity of aging: insights from long-lived mutants. Cell 120: 449-460. doi: 10.1016/j.cell.2005.02.002
|
| [247] | Tissenbaum HA, Ruvkun G (1998) An insulin-like signaling pathway affects both longevity and reproduction in Caenorhabditis elegans. Genetics 148: 703-717. |
| [248] | Honda Y, Honda S (1999) The daf-2 gene network for longevity regulates oxidative stress resistance and Mn-superoxide dismutase gene expression in Caenorhabditis elegans. FASEB J 13: 1385-1393. |
| [249] | Scott BA, Avidan MS, Crowder CM (2002) Regulation of Hypoxic Death in C. elegans by the Insulin/IGF Receptor Homolog DAF-2. Science 296: 2388-2391. |
| [250] |
Barsyte D, Lovejoy DA, Lithgow GJ (2001) Longevity and heavy metal resistance in daf-2 and age-1 long-lived mutants of Caenorhabditis elegans. FASEB J 15: 627-634. doi: 10.1096/fj.99-0966com
|
| [251] | Garsin DA, Villanueva JM, Begun J, et al. (2003) Long-lived C. elegans daf-2 mutants are resistant to bacterial pathogens. Science 300: 1921. |
| [252] |
Jellinger KA (2009) Recent advances in our understanding of neurodegeneration. J Neural Transm 116: 1111-1162. doi: 10.1007/s00702-009-0240-y
|
| [253] |
Ballard C, Gauthier S, Corbett A, et al. (2011) Alzheimer's disease. Lancet 377: 1019-1031. doi: 10.1016/S0140-6736(10)61349-9
|
| [254] |
Lees AJ, Hardy J, Revesz T (2009) Parkinson's disease. Lancet 373: 2055-2066. doi: 10.1016/S0140-6736(09)60492-X
|
| [255] |
Fan H-C, Ho L-I, Chi C-S, et al. (2014) Polyglutamine (PolyQ) diseases: genetics to treatments. Cell Transplant 23: 441-458. doi: 10.3727/096368914X678454
|
| [256] | Ballinger CA, Connell P, Wu Y, et al. (1999) Identification of CHIP, a Novel Tetratricopeptide Repeat-Containing Protein That Interacts with Heat Shock Proteins and Negatively Regulates Chaperone Functions. Mol Cell Biol 19: 4535-4545. |
| [257] |
Walker LC, LeVine H (2012) Corruption and spread of pathogenic proteins in neurodegenerative diseases. J Biol Chem 287: 33109-33115. doi: 10.1074/jbc.R112.399378
|
| [258] | Brignull HR, Moore FE, Tang SJ, et al. (2006) Polyglutamine Proteins at the Pathogenic Threshold Display Neuron-Specific Aggregation in a Pan-Neuronal Caenorhabditis elegans Model. J Neurosci 26: 7597-7606. |
| [259] |
Wyttenbach A (2004) Role of heat shock proteins during polyglutamine neurodegeneration: mechanisms and hypothesis. J Mol Neurosci 23: 69-96. doi: 10.1385/JMN:23:1-2:069
|
| [260] |
Yu A, Shibata Y, Shah B, et al. (2014) Protein aggregation can inhibit clathrin-mediated endocytosis by chaperone competition. Proc Natl Acad Sci U S A 111: E1481-E1490. doi: 10.1073/pnas.1321811111
|
| [261] |
Morley JF, Brignull HR, Weyers JJ, et al. (2002) The threshold for polyglutamine-expansion protein aggregation and cellular toxicity is dynamic and influenced by aging in Caenorhabditis elegans. Proc Natl Acad Sci U S A 99: 10417-10422. doi: 10.1073/pnas.152161099
|
| [262] | Teixeira-Castro A, Ailion M, Jalles A, et al. (2011) Neuron-specific proteotoxicity of mutant ataxin-3 in C. elegans: rescue by the DAF-16 and HSF-1 pathways. Hum Mol Genet 20: 2996-3009. |
| [263] |
Warrick JM, Paulson HL, Gray-Board GL, et al. (1998) Expanded Polyglutamine Protein Forms Nuclear Inclusions and Causes Neural Degeneration in Drosophila. Cell 93: 939-949. doi: 10.1016/S0092-8674(00)81200-3
|
| [264] |
Warrick JM, Chan HYE, Gray-Board GL, et al. (1999) Suppression of polyglutamine-mediated neurodegeneration in Drosophila by the molecular chaperone HSP70. Nat Genet 23: 425-428. doi: 10.1038/70532
|
| [265] |
Chan HYE, Warrick JM, Gray-Board GL, et al. (2000) Mechanisms of chaperone suppression of polyglutamine disease: selectivity, synergy and modulation of protein solubility in Drosophila. Hum Mol Genet 9: 2811-2820. doi: 10.1093/hmg/9.19.2811
|
| [266] | Bonini NM (2002) Chaperoning brain degeneration. Proc Natl Acad Sci U S A 99 Suppl 4: 16407-16411. |
| [267] |
Nollen EAA, Garcia SM, van Haaften G, et al. (2004) Genome-wide RNA interference screen identifies previously undescribed regulators of polyglutamine aggregation. Proc Natl Acad Sci U S A 101: 6403-6408. doi: 10.1073/pnas.0307697101
|
| [268] |
Labbadia J, Novoselov SS, Bett JS, et al. (2012) Suppression of protein aggregation by chaperone modification of high molecular weight complexes. Brain J Neurol 135: 1180-1196. doi: 10.1093/brain/aws022
|
| [269] |
Van Ham TJ, Holmberg MA, van der Goot AT, et al. (2010) Identification of MOAG-4/SERF as a regulator of age-related proteotoxicity. Cell 142: 601-612. doi: 10.1016/j.cell.2010.07.020
|
| [270] |
Falsone SF, Meyer NH, Schrank E, et al. (2012) SERF Protein Is a Direct Modifier of Amyloid Fiber Assembly. Cell Rep 2: 358-371. doi: 10.1016/j.celrep.2012.06.012
|
| [271] |
Labbadia J, Morimoto RI (2013) Huntington's disease: underlying molecular mechanisms and emerging concepts. Trends Biochem Sci 38: 378-385. doi: 10.1016/j.tibs.2013.05.003
|
| [272] |
Chafekar SM, Duennwald ML (2012) Impaired Heat Shock Response in Cells Expressing Full-Length Polyglutamine-Expanded Huntingtin. PLoS ONE 7: e37929. doi: 10.1371/journal.pone.0037929
|
| [273] |
Labbadia J, Cunliffe H, Weiss A, et al. (2011) Altered chromatin architecture underlies progressive impairment of the heat shock response in mouse models of Huntington disease. J Clin Invest 121: 3306-3319. doi: 10.1172/JCI57413
|
| [274] | Riva L, Koeva M, Yildirim F, et al. (2012) Poly-glutamine expanded huntingtin dramatically alters the genome wide binding of HSF1. J Huntingt Dis 1: 33-45. |
| [275] |
Cohen E, Bieschke J, Perciavalle RM, et al. (2006) Opposing activities protect against age-onset proteotoxicity. Science 313: 1604-1610. doi: 10.1126/science.1124646
|
| [276] |
Huang S, Ling JJ, Yang S, et al. (2011) Neuronal expression of TATA box-binding protein containing expanded polyglutamine in knock-in mice reduces chaperone protein response by impairing the function of nuclear factor-Y transcription factor. Brain J Neurol 134: 1943-1958. doi: 10.1093/brain/awr146
|
| [277] |
Olzscha H, Schermann SM, Woerner AC, et al. (2011) Amyloid-like aggregates sequester numerous metastable proteins with essential cellular functions. Cell 144: 67-78. doi: 10.1016/j.cell.2010.11.050
|
| [278] |
Cohen E, Paulsson JF, Blinder P, et al. (2009) Reduced IGF-1 signaling delays age-associated proteotoxicity in mice. Cell 139: 1157-1169. doi: 10.1016/j.cell.2009.11.014
|
| [279] | Jiang M, Wang J, Fu J, et al. (2012) Neuroprotective role of Sirt1 in mammalian models of Huntington's disease through activation of multiple Sirt1 targets. Nat Med 18: 153-158. |
| [280] | Raynes R, Pombier KM, Nguyen K, et al. (2013) The SIRT1 Modulators AROS and DBC1 Regulate HSF1 Activity and the Heat Shock Response. PLoS ONE 8: e54364 |
| [281] |
Pratt WB, Gestwicki JE, Osawa Y, et al. (2015) Targeting hsp90/hsp70-based protein quality control for treatment of adult onset neurodegenerative diseases. Annu Rev Pharmacol Toxicol 55: 353-371. doi: 10.1146/annurev-pharmtox-010814-124332
|
| [282] |
Auluck PK, Bonini NM (2002) Pharmacological prevention of Parkinson disease in Drosophila. Nat Med 8: 1185-1186. doi: 10.1038/nm1102-1185
|
| [283] |
Dou F, Netzer WJ, Tanemura K, et al. (2003) Chaperones increase association of tau protein with microtubules. Proc Natl Acad Sci U S A 100: 721-726. doi: 10.1073/pnas.242720499
|
| [284] |
Batulan Z, Taylor DM, Aarons RJ, et al. (2006) Induction of multiple heat shock proteins and neuroprotection in a primary culture model of familial amyotrophic lateral sclerosis. Neurobiol Dis 24: 213-225. doi: 10.1016/j.nbd.2006.06.017
|
| [285] |
Fujikake N, Nagai Y, Popiel HA, et al. (2008) Heat shock transcription factor 1-activating compounds suppress polyglutamine-induced neurodegeneration through induction of multiple molecular chaperones. J Biol Chem 283: 26188-26197. doi: 10.1074/jbc.M710521200
|
| [286] |
Egorin MJ, Lagattuta TF, Hamburger DR, et al. (2002) Pharmacokinetics, tissue distribution, and metabolism of 17-(dimethylaminoethylamino)-17-demethoxygeldanamycin (NSC 707545) in CD2F1 mice and Fischer 344 rats. Cancer Chemother Pharmacol 49: 7-19. doi: 10.1007/s00280-001-0380-8
|
| [287] |
Smith V, Sausville EA, Camalier RF, et al. (2005) Comparison of 17-dimethylaminoethylamino-17-demethoxy-geldanamycin (17DMAG) and 17-allylamino-17-demethoxygeldanamycin (17AAG) in vitro: effects on Hsp90 and client proteins in melanoma models. Cancer Chemother Pharmacol 56: 126-137. doi: 10.1007/s00280-004-0947-2
|
| [288] |
Herbst M, Wanker EE (2007) Small Molecule Inducers of Heat-Shock Response Reduce polyQ-Mediated Huntingtin Aggregation. Neurodegener Dis 4: 254-260. doi: 10.1159/000101849
|
| [289] | Tokui K, Adachi H, Waza M, et al. (2009) 17-DMAG ameliorates polyglutamine-mediated motor neuron degeneration through well-preserved proteasome function in an SBMA model mouse. Hum Mol Genet 18: 898-910. |
| [290] |
Silva-Fernandes A, Duarte-Silva S, Neves-Carvalho A, et al. (2014) Chronic treatment with 17-DMAG improves balance and coordination in a new mouse model of Machado-Joseph disease. Neurother J Am Soc Exp Neurother 11: 433-449. doi: 10.1007/s13311-013-0255-9
|
| [291] |
Waza M, Adachi H, Katsuno M, et al. (2005) 17-AAG, an Hsp90 inhibitor, ameliorates polyglutamine-mediated motor neuron degeneration. Nat Med 11: 1088-1095. doi: 10.1038/nm1298
|
| [292] |
Thomas M, Harrell JM, Morishima Y, et al. (2006) Pharmacologic and genetic inhibition of hsp90-dependent trafficking reduces aggregation and promotes degradation of the expanded glutamine androgen receptor without stress protein induction. Hum Mol Genet 15: 1876-1883. doi: 10.1093/hmg/ddl110
|
| [293] |
Wang L, Xie C, Greggio E, et al. (2008) The chaperone activity of heat shock protein 90 is critical for maintaining the stability of leucine-rich repeat kinase 2. J Neurosci 28: 3384-3391. doi: 10.1523/JNEUROSCI.0185-08.2008
|
| [294] |
Moriwaki Y, Kim Y-J, Ido Y, et al. (2008) L347P PINK1 mutant that fails to bind to Hsp90/Cdc37 chaperones is rapidly degraded in a proteasome-dependent manner. Neurosci Res 61: 43-48. doi: 10.1016/j.neures.2008.01.006
|
| [295] |
Luo W, Dou F, Rodina A, et al. (2007) Roles of heat-shock protein 90 in maintaining and facilitating the neurodegenerative phenotype in tauopathies. Proc Natl Acad Sci U S A 104: 9511-9516. doi: 10.1073/pnas.0701055104
|
| [296] |
Dickey CA, Kamal A, Lundgren K, et al. (2007) The high-affinity HSP90-CHIP complex recognizes and selectively degrades phosphorylated tau client proteins. J Clin Invest 117: 648-658. doi: 10.1172/JCI29715
|
| [297] |
Riedel M, Goldbaum O, Schwarz L, et al. (2010) 17-AAG Induces Cytoplasmic α-Synuclein Aggregate Clearance by Induction of Autophagy. PLoS ONE 5: e8753. doi: 10.1371/journal.pone.0008753
|
| [298] |
Chen Y, Wang B, Liu D, et al. (2014) Hsp90 chaperone inhibitor 17-AAG attenuates Aβ-induced synaptic toxicity and memory impairment. J Neurosci 34: 2464-2470. doi: 10.1523/JNEUROSCI.0151-13.2014
|
| [299] | Neef DW, Turski ML, Thiele DJ (2010) Modulation of Heat Shock Transcription Factor 1 as a Therapeutic Target for Small Molecule Intervention in Neurodegenerative Disease. PLoS Biol 8: e1000291 |
| [300] |
Neef DW, Jaeger AM, Gomez-Pastor R, et al. (2014) A direct regulatory interaction between chaperonin TRiC and stress-responsive transcription factor HSF1. Cell Rep 9: 955-966. doi: 10.1016/j.celrep.2014.09.056
|
| [301] | Calamini B, Silva MC, Madoux F, et al. (2012) Small-molecule proteostasis regulators for protein conformational diseases. Nat Chem Biol 8: 185-196. |
| [302] |
Shoulders MD, Ryno LM, Cooley CB, et al. (2013) Broadly Applicable Methodology for the Rapid and Dosable Small Molecule-Mediated Regulation of Transcription Factors in Human Cells. J Am Chem Soc 135: 8129-8132. doi: 10.1021/ja402756p
|
| [303] |
Ryno LM, Genereux JC, Naito T, et al. (2014) Characterizing the Altered Cellular Proteome Induced by the Stress-Independent Activation of Heat Shock Factor 1. ACS Chem Biol 9: 1273-1283. doi: 10.1021/cb500062n
|
| [304] | Calamini B, Morimoto RI (2012) Protein homeostasis as a therapeutic target for diseases of protein conformation. Curr Top Med Chem 12: 2623-2640 |
Figures(5)

Ana Jalles, Patrícia Maciel. The disruption of proteostasis in neurodegenerative disorders[J]. AIMS Molecular Science, 2015, 2(3): 259-293. doi: 10.3934/molsci.2015.3.259


 DownLoad: