Maternal malnutrition is a global concern whose consequences for newborns are intrauterine growth retardation, fetal hypotrophy and exposure to risks of pathologies in adulthood.
The aim of this study was to assess and compare the diet quality and nutritional status of pregnant women at the time of childbirth while assessing their newborn's weight at birth.
The study involved 400 parturient, divided into two groups of 200 each, the controls who have just given birth to newborns of normal weight and the cases who have just given birth to babies of low birth weight (LBW). Information on food intakes and dietary habits were collected using questionnaires and anthropometric parameters were measured.
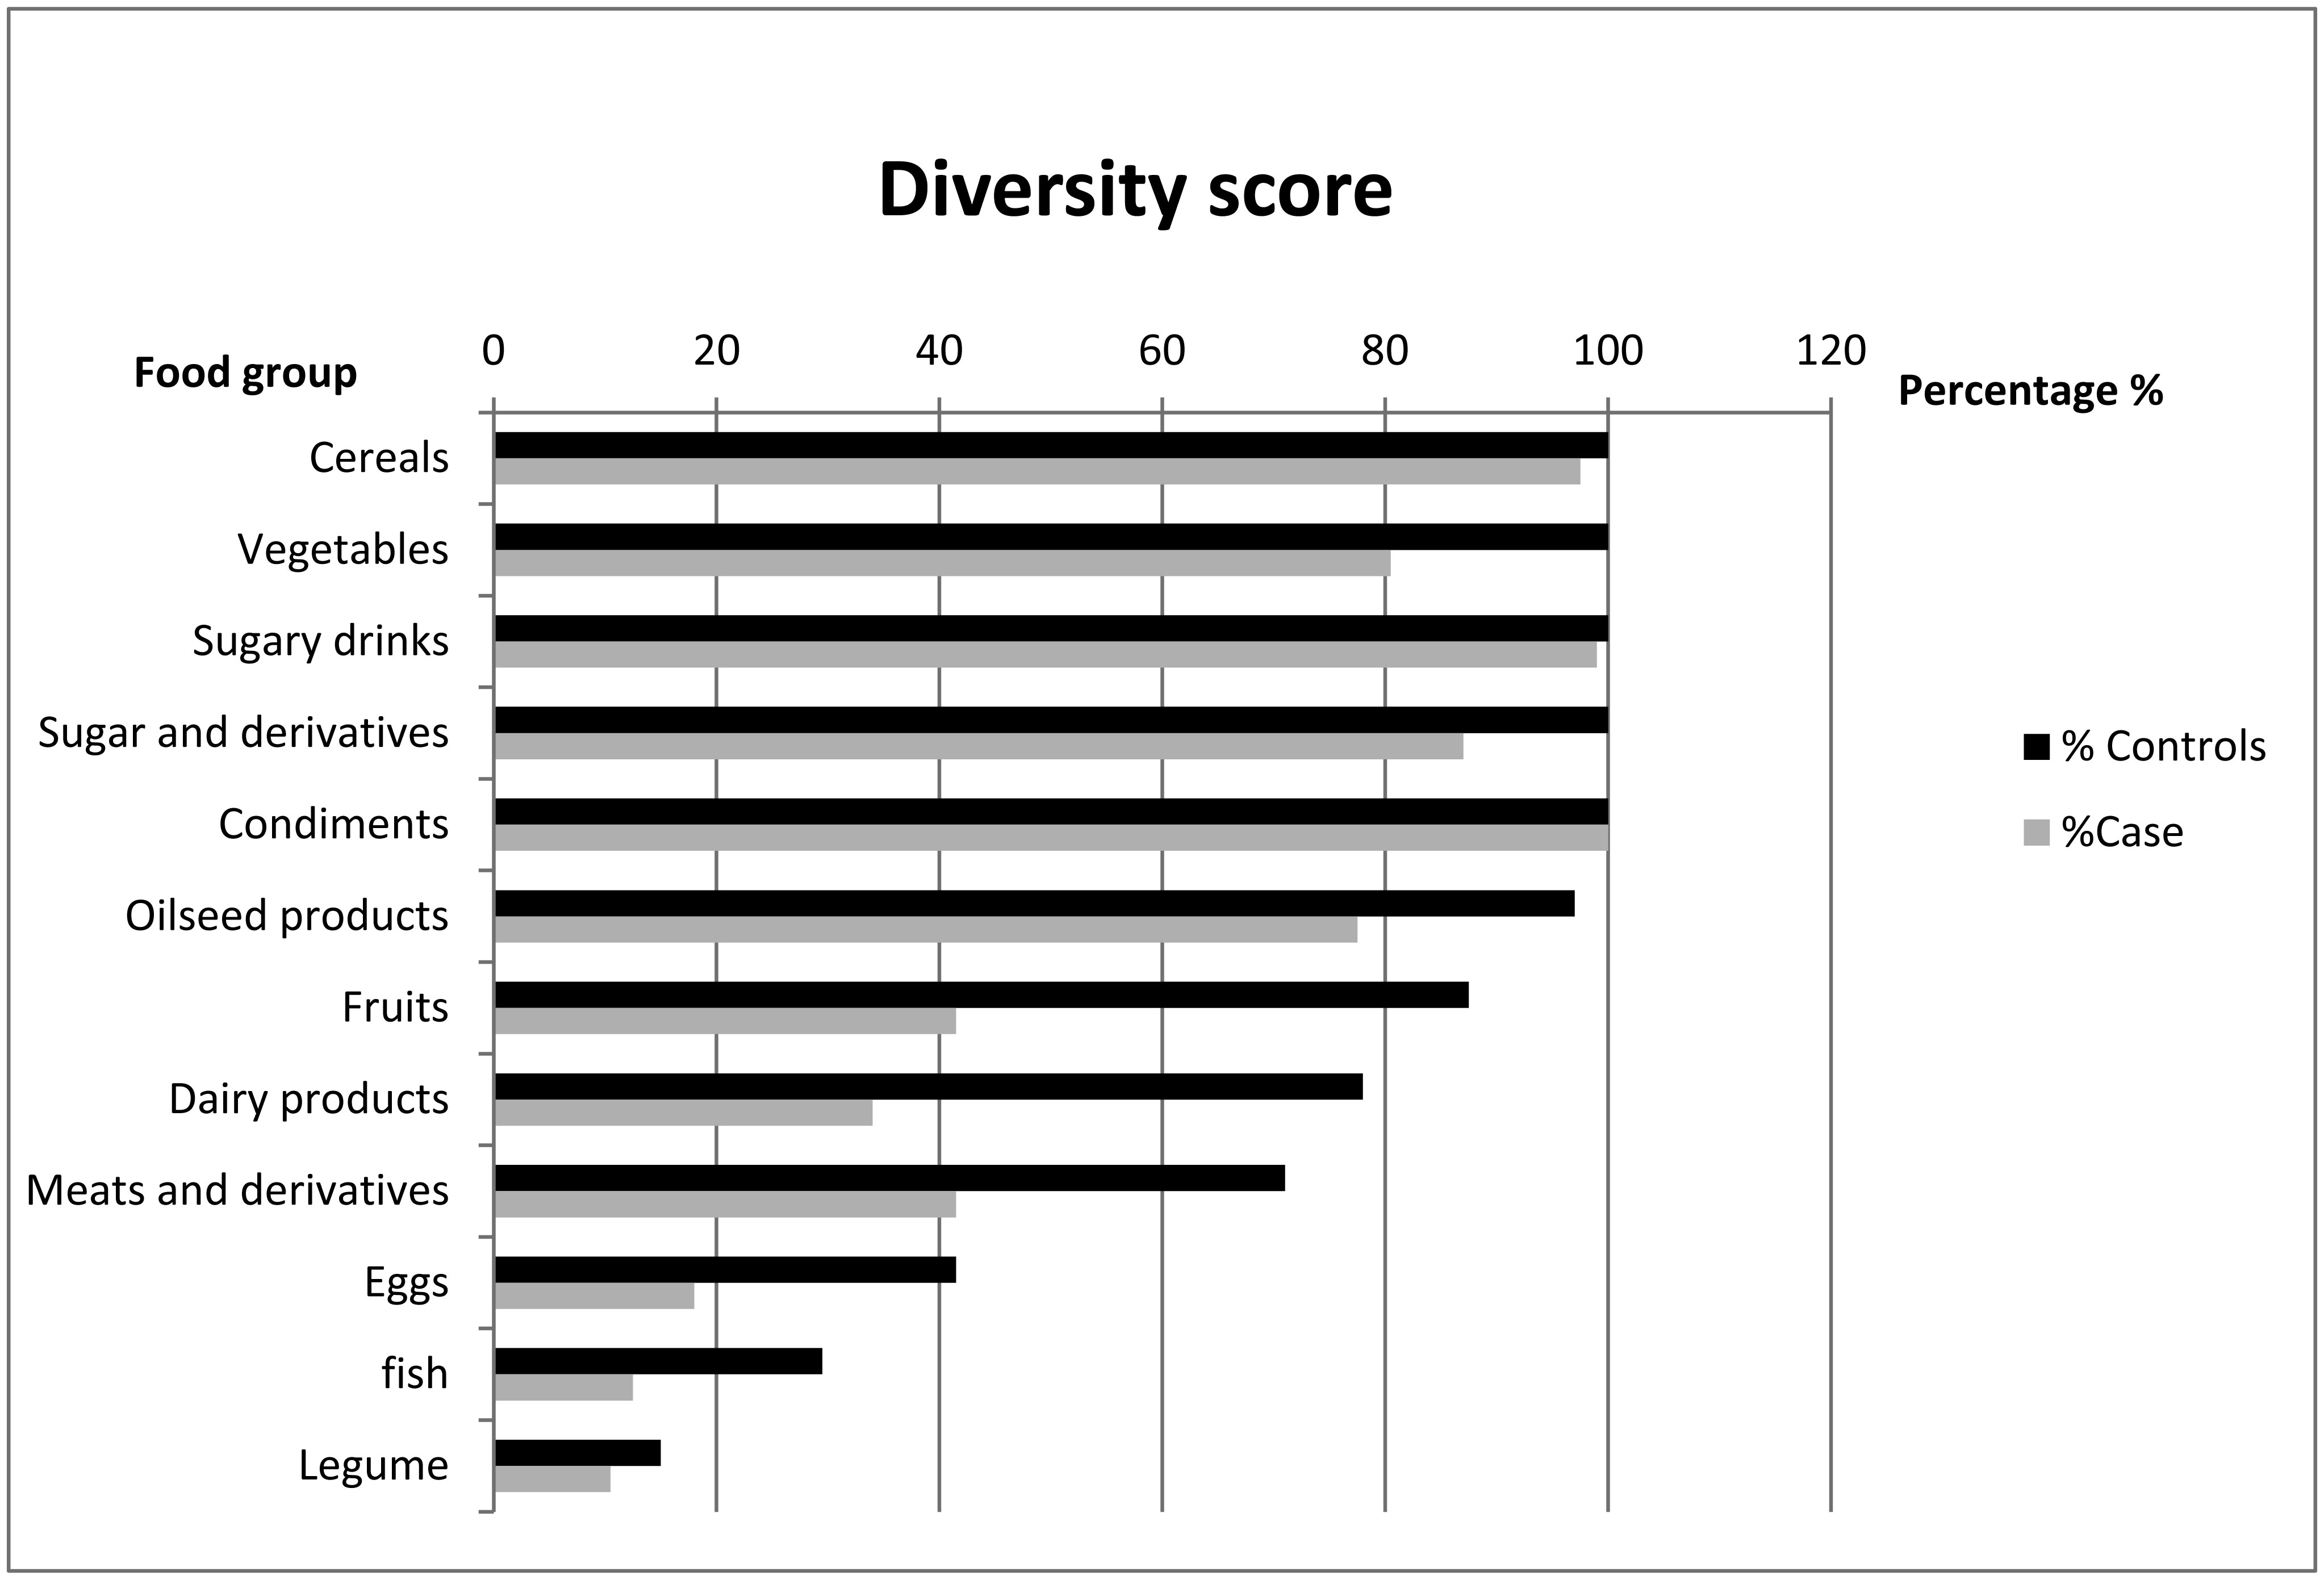
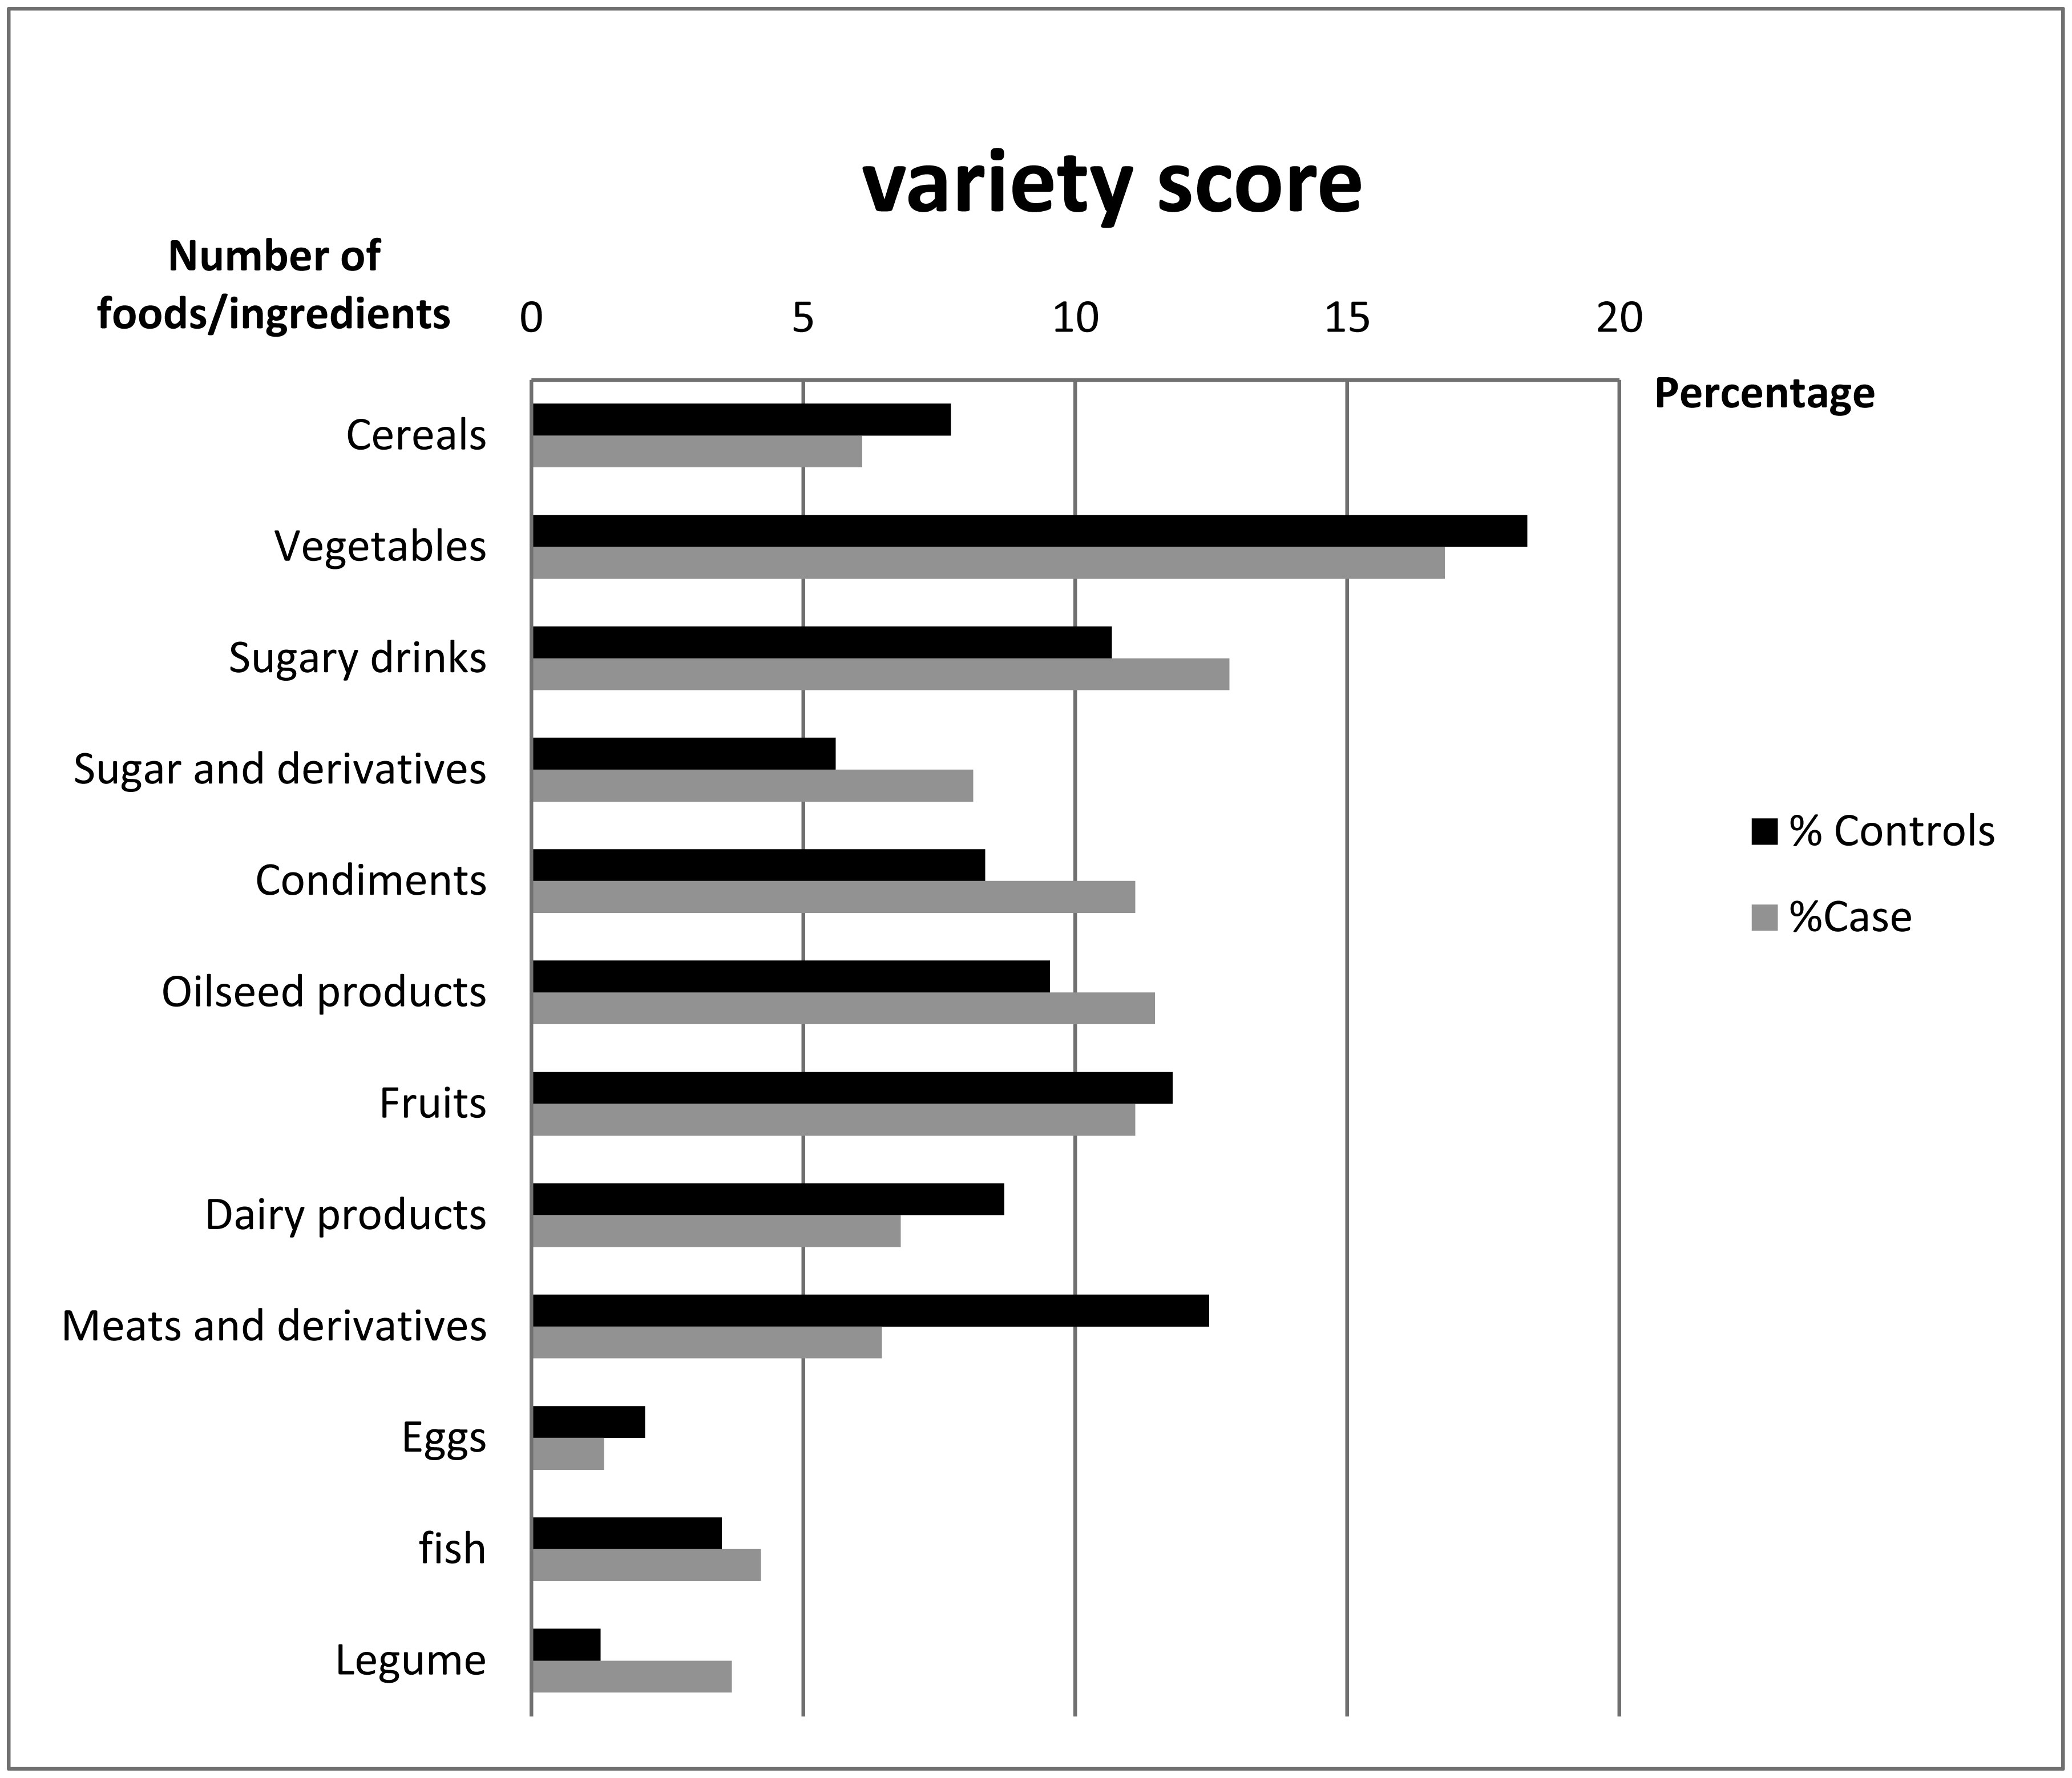
The mean body mass index (BMI) of the cases was 25.93 ± 2.64 kg/m2 vs. 28.25 ± 2.75 kg/m2 in the controls. The dietary diversity and variety scores were higher in the controls than in the cases. Indeed means were 6.87 ± 1.30 vs. 8.88 ± 1.35 food groups for the diversity scores and 11.77 ± 1.57 vs. 15.90 ± 2.09 food items for the variety scores in the cases and the controls respectively. The average daily intakes of folates, calcium, iron and zinc were lower than the Recommended Daily Allowances (RDA) for both groups. The daily calcium intake represents only 1/5th of the RDI for the cases and 1/3 for the controls. Average dietary iron intake was insufficient at only 49% of the daily requirement for cases vs. 66.88% for controls while folates accounts for 64.33% of the RDA for the cases.
Data from this study shows that the diets of women who have given birth to low birth weight infants are poorly diversified, poorly varied, and poor in certain nutrients essential for a successful pregnancy and childbirth.
Citation: Houda Elfane, Sanaa El-Jamal, Mohamed Mziwira, Imane Barakat, Mohammed Elayachi, Rekia Belahsen. Nutritional status of Moroccan pregnant women and the birth weight of their newborn: a case-control study in the province of El Jadida[J]. AIMS Medical Science, 2021, 8(3): 237-251. doi: 10.3934/medsci.2021020
Maternal malnutrition is a global concern whose consequences for newborns are intrauterine growth retardation, fetal hypotrophy and exposure to risks of pathologies in adulthood.
The aim of this study was to assess and compare the diet quality and nutritional status of pregnant women at the time of childbirth while assessing their newborn's weight at birth.
The study involved 400 parturient, divided into two groups of 200 each, the controls who have just given birth to newborns of normal weight and the cases who have just given birth to babies of low birth weight (LBW). Information on food intakes and dietary habits were collected using questionnaires and anthropometric parameters were measured.
The mean body mass index (BMI) of the cases was 25.93 ± 2.64 kg/m2 vs. 28.25 ± 2.75 kg/m2 in the controls. The dietary diversity and variety scores were higher in the controls than in the cases. Indeed means were 6.87 ± 1.30 vs. 8.88 ± 1.35 food groups for the diversity scores and 11.77 ± 1.57 vs. 15.90 ± 2.09 food items for the variety scores in the cases and the controls respectively. The average daily intakes of folates, calcium, iron and zinc were lower than the Recommended Daily Allowances (RDA) for both groups. The daily calcium intake represents only 1/5th of the RDI for the cases and 1/3 for the controls. Average dietary iron intake was insufficient at only 49% of the daily requirement for cases vs. 66.88% for controls while folates accounts for 64.33% of the RDA for the cases.
Data from this study shows that the diets of women who have given birth to low birth weight infants are poorly diversified, poorly varied, and poor in certain nutrients essential for a successful pregnancy and childbirth.

| [1] |
Barker DJP, Forsén T, Uutela A, et al. (2001) Size at birth and resilience to the effects of poor living conditions in adult life: longitudinal study. BMJ 323: 1273-1276. doi: 10.1136/bmj.323.7324.1273

|
| [2] | WHO Manual of the international statistical classification of diseases, injuries, and causes of death (1975) .Available from: https://apps.who.int/iris/handle/10665/40492. |
| [3] |
Rush D (2001) Maternal nutrition and perinatal survival. Nutr Rev 59: 315-326. doi: 10.1111/j.1753-4887.2001.tb06956.x
|
| [4] | Lapillonne A (2011) Intrauterine growth retardation and adult outcome. Bull Acad Natle Med 195: 477-484. |
| [5] | High Commission for Planning (2015) Morocco between Millennium Development Goals and Sustainable Development Goals. Achievements and challenges. National Report p. 57Available from: https://odd.hcp.ma/National-Report-2015-OMD-Morocco_a2071.html. |
| [6] | Habte TY, Krawinkel M (2016) Dietary diversity score: a measure of nutritional adequacy or an indicator of healthy diet? J Nutr Health Sci 3: 303. |
| [7] |
Torheim L, Ouattara F, Diarra MM, et al. (2004) Nutrient adequacy and dietary diversity in rural Mali: association and determinants. Eur J Clin Nutr 58: 594-604. doi: 10.1038/sj.ejcn.1601853
|
| [8] | WHOWHO: recommended definitions, terminology and format for statistical tables related to the perinatal period and use of a new certificate for cause of perinatal deaths. Modifications recommended by FIGO as amended October 14, 1976 (1977) . |
| [9] | Jean-Claude F, Ireland-Ripert J, Toque C, et al. (1995) General food directory: composition table. 2nd edition revised and augmented. INRA-AFSSA-CIQUAL-TEC & DOC 928 pAvailable from: Fdi:010009113. |
| [10] | FAO (2010) Guidelines for measuring household and individual dietary diversity Rome, Italy: Food and Agriculture Organization of the United Nations, Available from: http://www.fao.org/docrep/014/i1983e/i1983e00.pdf. |
| [11] |
Huybregts LF, Roberfroid DA, Kolsteren PW, et al. (2009) Dietary behaviour, food and nutrient intake of pregnant women in a rural community in Burkina Faso. Matern Child Nutr 5: 211-222. doi: 10.1111/j.1740-8709.2008.00180.x
|
| [12] |
Hatloy A, Torheim LE, Oshaug A (1998) Food variety-a good indicator of nutritional adequacy of the diet? A case study from an urban area in Mali, West Africa. Eur J Clin Nutr 52: 891-898. doi: 10.1038/sj.ejcn.1600662
|
| [13] | Ruel MTIs dietary diversity an indicator of food Security or dietary quality? A review of Measurement issues and research needs, FCND discussion paper No. 140. International Food Policy Research Institute (2002) .USA: P. 58. |
| [14] | Mirmiran P, Azadbaht L, Esmailzadeh A, et al. (2004) Dietary diversity score in adolescents-a good indicator of the nutritional adequacy of diets: Tehran lipid and glucose study. Asia Pac J Clin Nutr 13: 56-60. |
| [15] |
Savy M, Martin-Prevel Y, Sawadogo P, et al. (2005) Use of variety/diversity scores for diet quality measurements: relation with nutritional status of women in a rural area in Burkina Faso. Eur J Clin Nutr 59: 703-716. doi: 10.1038/sj.ejcn.1602135
|
| [16] | WHO Expert Committee on Physical Status: the Use and Interpretation of Anthropometry (1993: Geneva, Switzerland) & World Health Organization (1995) Physical status: the use of and interpretation of anthropometry, report of a WHO expert committee World Health Organization, Available from: https://apps.who.int/iris/handle/10665/37003. |
| [17] | Thompson FE, Byers T (1994) Dietary assessment resource manual. J Nutr 124: 2245S-2317S. |
| [18] |
Jones AD (2017) On-Farm crop species richness is associated with household diet diversity and quality in subsistence- and market-oriented farming households in Malawi. J Nutr 147: 86-96. doi: 10.3945/jn.116.235879
|
| [19] |
Jones AD, Shrinivas A, Bezner-Kerr R (2014) Farm production diversity is associated with greater household dietary diversity in Malawi: findings from nationally representative data. Food Policy 46: 1-12. doi: 10.1016/j.foodpol.2014.02.001
|
| [20] |
Bellows AL, Canavan CR, Blakstad MM, et al. (2020) The relationship between dietary diversity among women of reproductive age and agricultural diversity in rural Tanzania. Food Nutr Bull 41: 50-60. doi: 10.1177/0379572119892405
|
| [21] |
Jaime PC, Bandoni DH, Duran AC da FL, et al. (2010) Diet quality index adjusted for energy requirements in adults. Cad Saude Publica 26: 2121-2128. doi: 10.1590/S0102-311X2010001100013
|
| [22] | Heuer T, Krems C, Moon K, et al. (2015) Food consumption of adults in Germany: results of the German National Nutrition Survey II based on food history interviews. Br J Nutr 1-12. |
| [23] |
Mullie P, Clarys P, Hulens M, et al. (2010) Dietary patterns and socioeconomic position. Eur J Clin Nutr 64: 231-238. doi: 10.1038/ejcn.2009.145
|
| [24] |
Thodis A, Itsiopoulos C, Kouris-Blazos A, et al. (2018) Observational study of adherence to a traditional Mediterranean diet, sociocultural characteristics and cardiovascular disease risk factors of older Greek Australians from Mediterranean Islands (MEDIS Australia study: protocol and rationale. Nutr Diet 75: 44-51. doi: 10.1111/1747-0080.12360
|
| [25] |
Boustani NM, Guiné RPF (2020) Food choice motivations and perception of a healthy diet in a developing Mediterranean country. Open Agriculture 5: 485-495. doi: 10.1515/opag-2020-0048
|
| [26] |
Rahman MM, Abe SK, Rahman MS, et al. (2016) Maternal anemia and risk of adverse birth and health outcomes in low- and middle-income countries: systematic review and meta-analysis. Am J Clin Nutr 103: 495-504. doi: 10.3945/ajcn.115.107896
|
| [27] |
Benjelloun S (2002) Nutrition transition in Morocco. Public Health Nutr 5: 135-140. doi: 10.1079/PHN2001285
|
| [28] | Lauren W, Summerlee A, Dewey C, et al. (2014) Women's nutrient intakes and food-related knowledge in rural Kandal province, Cambodia. Asia Pac J Clin Nutr 23: 263-271. |
| [29] |
Belgnaoui S, Belahsen R (2006) Nutrient intake and food consumption among pregnant women from an agricultural region of Morocco. Int J Food Sci Nutr 57: 19-27. doi: 10.1080/09637480500465261
|
| [30] | FAO Food Balance Sheets: Definitions and Standards (2017) .Available from: http://www.fao.org/faostat/en/#data/FBS. |
| [31] |
Cetin I, Berti C, Calabrese S (2010) Role of micronutrients in the periconceptional period. Hum Reprod Update 16: 80-95. doi: 10.1093/humupd/dmp025
|
| [32] |
Metgud CS, Naik VA, Maheshwar DM (2012) Factors affecting birth weight of a newborn—a community based study in rural Karnataka, India. PLoS One 7: e40040. doi: 10.1371/journal.pone.0040040
|
| [33] | Hofmeyr GJ, Manyame S (2017) Calcium supplementation commencing before or early in pregnancy, or food fortification with calcium, for preventing hypertensive disorders of pregnancy. Cochrane Database Syst Rev 9. |
| [34] | EL Ayoubi L, Comte F (2018) The consequences of vegetarian and vegan diets during pregnancy and lactation, on pregnant women, fetuses, newborns and infants. Midwife Rev (In France). |
Figures(2) / Tables(3)

Houda Elfane, Sanaa El-Jamal, Mohamed Mziwira, Imane Barakat, Mohammed Elayachi, Rekia Belahsen. Nutritional status of Moroccan pregnant women and the birth weight of their newborn: a case-control study in the province of El Jadida[J]. AIMS Medical Science, 2021, 8(3): 237-251. doi: 10.3934/medsci.2021020


 DownLoad: