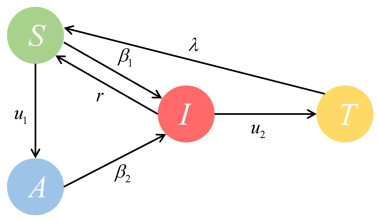
In this paper, an SAITS epidemic model based on a single layer static network is proposed and investigated. This model considers a combinational suppression control strategy to suppress the spread of epidemics, which includes transferring more individuals to compartments with low infection rate and with high recovery rate. The basic reproduction number of this model is calculated and the disease-free and endemic equilibrium points are discussed. An optimal control problem is formulated to minimize the number of infections with limited resources. The suppression control strategy is investigated and a general expression for the optimal solution is given based on the Pontryagin's principle of extreme value. The validity of the theoretical results is verified by numerical simulations and Monte Carlo simulations.
Citation: Wei Ding, Li Ding, Zhengmin Kong, Feng Liu. The SAITS epidemic spreading model and its combinational optimal suppression control[J]. Mathematical Biosciences and Engineering, 2023, 20(2): 3342-3354. doi: 10.3934/mbe.2023157
In this paper, an SAITS epidemic model based on a single layer static network is proposed and investigated. This model considers a combinational suppression control strategy to suppress the spread of epidemics, which includes transferring more individuals to compartments with low infection rate and with high recovery rate. The basic reproduction number of this model is calculated and the disease-free and endemic equilibrium points are discussed. An optimal control problem is formulated to minimize the number of infections with limited resources. The suppression control strategy is investigated and a general expression for the optimal solution is given based on the Pontryagin's principle of extreme value. The validity of the theoretical results is verified by numerical simulations and Monte Carlo simulations.

| [1] |
D. Chakrabarti, Y. Wang, C. Wang, J. Leskovec, C. Faloutsos, Epidemic thresholds in real networks, ACM Trans. Inf. Syst. Secur., 10 (2008), 1–26. https://doi.org/10.1145/1284680.1284681 doi: 10.1145/1284680.1284681

|
| [2] |
F. Di Lauro, J. C. Croix, M. Dashti, L. Berthouze, I. Z. Kiss, Network inference from population-level observation of epidemics, Sci. Rep., 10 (2020), 18779. https://doi.org/10.1038/s41598-020-75558-9 doi: 10.1038/s41598-020-75558-9
|
| [3] |
Y. Zhao, C. Huepe, P. Romanczuk, Contagion dynamics in self-organized systems of self-propelled agents, Sci. Rep., 12 (2022), 2588. https://doi.org/10.1038/s41598-022-06083-0 doi: 10.1038/s41598-022-06083-0
|
| [4] |
G. Albi, L. Pareschi, M. Zanella, Control with uncertain data of socially structured compartmental epidemic models, J. Math. Bio., 82 (2021), 63. https://doi.org/10.1007/s00285-021-01617-y doi: 10.1007/s00285-021-01617-y
|
| [5] |
J. M. Mendes, P. S. Coelho, Addressing hospitalisations with non-error-free data by generalised SEIR modelling of COVID-19 pandemic, Sci. Rep., 11 (2021), 19617. https://doi.org/10.1038/s41598-021-98975-w doi: 10.1038/s41598-021-98975-w
|
| [6] |
M. Shoaib, N. Anwar, I. Ahmad, S. Naz, A. K. Kiani, M. A. Z. Raja, Intelligent networks knacks for numerical treatment of nonlinear multi-delays SVEIR epidemic systems with vaccination, Int. J. Mod. Phys. B, 36 (2022). https://doi.org/10.1142/S0217979222501004 doi: 10.1142/S0217979222501004
|
| [7] |
G. Albi, L. Pareschi, M. Zanella, Modelling lockdown measures in epidemic outbreaks using selective socio-economic containment with uncertainty, Math. Biosci. Eng., 18 (2021), 7161–7190. https://doi.org/10.3934/mbe.2021355 doi: 10.3934/mbe.2021355
|
| [8] |
P. Di Giamberardino, D. Iacoviello, Evaluation of the effect of different policies in the containment of epidemic spreads for the COVID-19 case, Biomed. Signal Process. Control, 65 (2021), 102325. https://doi.org/10.1016/j.bspc.2020.102325 doi: 10.1016/j.bspc.2020.102325
|
| [9] |
K. M. A. Kabir, K. Kuga, J. Tanimoto, Effect of information spreading to suppress the disease contagion on the epidemic vaccination game, Chaos, Solitons Fractals, 119 (2019), 180–187. https://doi.org/10.1016/j.chaos.2018.12.023 doi: 10.1016/j.chaos.2018.12.023
|
| [10] |
X. Wang, D. Jia, S. Gao, C. Xia, X. Li, Z. Wang, Vaccination behavior by coupling the epidemic spreading with the human decision under the game theory, Appl. Math. Comput., 380 (2020), 125232. https://doi.org/10.1016/j.amc.2020.125232 doi: 10.1016/j.amc.2020.125232
|
| [11] |
M. Chinazzi, J. T. Davis, M. Ajelli, C. Gioannini, M. Litvinova, S. Merler, et al., The effect of travel restrictions on the spread of the 2019 novel coronavirus (COVID-19) outbreak, Science, 368 (2020), 395–400. https://doi.org/10.1126/science.aba9757 doi: 10.1126/science.aba9757
|
| [12] |
S. Kwon, A. D. Joshi, C. Lo, D. A. Drew, L. H. Nguyen, C. Guo, et al., Association of social distancing and face mask use with risk of COVID-19, Nat. Commun., 12 (2021), 3737. https://doi.org/10.1038/s41467-021-24115-7 doi: 10.1038/s41467-021-24115-7
|
| [13] |
H. Shi, Z. Duan, G. Chen, R. Li, Epidemic spreading on networks with vaccination, Chin. Phys. B, 18 (2009), 3309–3317. https://doi.org/10.1088/1674-1056/18/8/035 doi: 10.1088/1674-1056/18/8/035
|
| [14] |
A. S. Alsheri, A. A. Alraeza, M. R. Afia, Mathematical modeling of the effect of quarantine rate on controlling the infection of COVID19 in the population of Saudi Arabia, Alexandria Eng. J., 61 (2022), 6843–6850. https://doi.org/10.1016/j.aej.2021.12.033 doi: 10.1016/j.aej.2021.12.033
|
| [15] |
D. Xu, X. Xu, Y. Xie, C. Yang, Optimal control of an SIVRS epidemic spreading model with virus variation based on complex networks, Commun. Nonlinear Sci. Numer. Simul., 48 (2017), 200–210. https://doi.org/10.1016/j.cnsns.2016.12.025 doi: 10.1016/j.cnsns.2016.12.025
|
| [16] |
A. P. Lemos-Paião, C. J. Silva, D. F. M. Torres, An epidemic model for cholera with optimal control treatment, J. Comput. Appl. Math., 318 (2017), 168–180. https://doi.org/10.1016/j.cam.2016.11.002 doi: 10.1016/j.cam.2016.11.002
|
| [17] |
L. Miclo, D. Spiro, J. Weibull, Optimal epidemic suppression under an ICU constraint: An analytical solution, J. Math. Econ., 101 (2022), 102669. https://doi.org/10.1016/j.jmateco.2022.102669 doi: 10.1016/j.jmateco.2022.102669
|
| [18] |
Y. Wu, Y. Sun, M. Lin, SQEIR: An epidemic virus spread analysis and prediction model, Comput. Electr. Eng., 102 (2022), 108230. https://doi.org/10.1016/j.compeleceng.2022.108230 doi: 10.1016/j.compeleceng.2022.108230
|
| [19] |
A. Kumar, P. K. Srivastava, Y. Dong, Y. Takeuchi, Optimal control of infectious disease: Information-induced vaccination and limited treatment, Phys. A: Stat. Mech. Appl., 542 (2020), 123196. https://doi.org/10.1016/j.physa.2019.123196 doi: 10.1016/j.physa.2019.123196
|
| [20] |
G. Dimarco, G. Toscani, M. Zanella, Optimal control of epidemic spreading in the presence of social heterogeneity, Philos. Trans. R. Soc. A, 380 (2022), 2224. https://doi.org/10.1098/rsta.2021.0160 doi: 10.1098/rsta.2021.0160
|
| [21] |
G. Zaman, Y. Kang, G. Cho, I. H. Jung, Optimal strategy of vaccination & treatment in an SIR epidemic model, Math. Comput. Simul., 136 (2017), 63–77. https://doi.org/10.1016/j.matcom.2016.11.010 doi: 10.1016/j.matcom.2016.11.010
|
| [22] |
Y. Pan, Z. Yan, The impact of individual heterogeneity on the coupled awareness-epidemic dynamics in multiplex networks, Chaos, 28 (2018), 063123. https://doi.org/10.1063/1.5000280 doi: 10.1063/1.5000280
|
| [23] |
P. van den Driessche, J. Watmough, Reproduction numbers and sub-threshold endemic equilibria for compartmental models of disease transmission, Math. Biosci., 180 (2002), 29–48. https://doi.org/10.1016/S0025-5564(02)00108-6 doi: 10.1016/S0025-5564(02)00108-6
|
Figures(4)

Wei Ding, Li Ding, Zhengmin Kong, Feng Liu. The SAITS epidemic spreading model and its combinational optimal suppression control[J]. Mathematical Biosciences and Engineering, 2023, 20(2): 3342-3354. doi: 10.3934/mbe.2023157


 DownLoad: