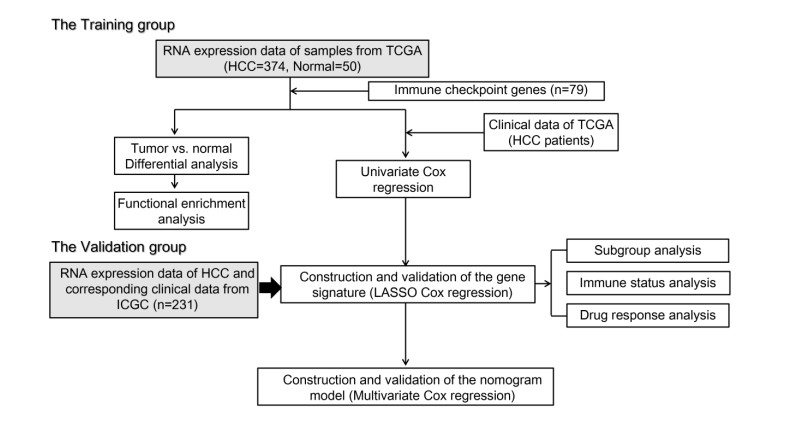
Immune checkpoint genes (ICGs) have recently been proven to perform instrumental functions in the maintenance of immune homeostasis and represent a promising therapeutic strategy; however, their expression patterns and prognostic values are not fully elucidated in hepatocellular carcinoma (HCC). In this investigation, we focused on establishing and validating a prognostic gene signature to facilitate decision-making in clinical practice. Clinical information, as well as transcriptome data, was obtained from the Cancer Genome Atlas (TCGA) and International Cancer Genome Consortium (ICGC) database. Univariate Cox regression and least absolute shrinkage and selection operator (LASSO) Cox method were employed to build a multi-gene signature in the TCGA database, while the ICGC database was used for validation. Subsequently, utilizing the six-gene signature, we were able to categorize patients into high- and low-risk groups. In two cohorts, survival analysis findings revealed a dismal outlook for the high-risk group. The receiver operating characteristic curves were utilized to estimate the gene signature's prediction ability. Moreover, correlation analysis showed high-risk group was linked to advanced pathological stage, infiltration of immune cells and therapeutic response. In summary, this unique gene profile might serve not only as a useful prognostic indicator but also as a marker of therapy responsiveness in HCC.
Citation: Siyuan Tian, Yinan Hu, Chunmei Yang, Jiahao Yu, Jingyi Liu, Guoyun Xuan, Yansheng Liu, Keshuai Sun, Miao Zhang, Shuoyi Ma, Yulong Shang, Xia Zhou, Ying Han. A novel immune checkpoint-related gene signature for hepatocellular carcinoma to predict clinical outcomes and therapeutic response[J]. Mathematical Biosciences and Engineering, 2022, 19(5): 4719-4736. doi: 10.3934/mbe.2022220
Immune checkpoint genes (ICGs) have recently been proven to perform instrumental functions in the maintenance of immune homeostasis and represent a promising therapeutic strategy; however, their expression patterns and prognostic values are not fully elucidated in hepatocellular carcinoma (HCC). In this investigation, we focused on establishing and validating a prognostic gene signature to facilitate decision-making in clinical practice. Clinical information, as well as transcriptome data, was obtained from the Cancer Genome Atlas (TCGA) and International Cancer Genome Consortium (ICGC) database. Univariate Cox regression and least absolute shrinkage and selection operator (LASSO) Cox method were employed to build a multi-gene signature in the TCGA database, while the ICGC database was used for validation. Subsequently, utilizing the six-gene signature, we were able to categorize patients into high- and low-risk groups. In two cohorts, survival analysis findings revealed a dismal outlook for the high-risk group. The receiver operating characteristic curves were utilized to estimate the gene signature's prediction ability. Moreover, correlation analysis showed high-risk group was linked to advanced pathological stage, infiltration of immune cells and therapeutic response. In summary, this unique gene profile might serve not only as a useful prognostic indicator but also as a marker of therapy responsiveness in HCC.

| [1] |
F. Bray, J. Ferlay, I. Soerjomataram, R. Siegel, L. Torre, A. Jemal, Global cancer statistics 2018: GLOBOCAN estimates of incidence and mortality worldwide for 36 cancers in 185 countries, CA Cancer J. Clin., 68 (2018), 394-424. https://doi.org/10.3322/caac.21492 doi: 10.3322/caac.21492

|
| [2] |
T. Greten, C. Lai, G. Li, K. Staveley-O' Carroll, targeted and immune-based therapies for hepatocellular carcinoma, Gastroenterology, 156 (2019), 510-524. https://doi.org/10.1053/j.gastro.2018.09.051 doi: 10.1053/j.gastro.2018.09.051
|
| [3] |
J. Llovet, R. Montal, D. Sia, R. Finn, Molecular therapies and precision medicine for hepatocellular carcinoma, Nat. Rev. Clin. Oncol., 15 (2018), 599-616. https://doi.org/10.1038/s41571-018-0073-4 doi: 10.1038/s41571-018-0073-4
|
| [4] |
Y. Jiang, A. Sun, Y. Zhao, W. Ying, H. Sun, X. Yang, et al., Proteomics identifies new therapeutic targets of early-stage hepatocellular carcinoma, Nature, 567 (2019), 257-261. https://doi.org/10.1038/s41586-019-0987-8 doi: 10.1038/s41586-019-0987-8
|
| [5] |
C. Qu, Y. Wang, P. Wang, K. Chen, M. Wang, H. Zeng, et al., Detection of early-stage hepatocellular carcinoma in asymptomatic HBsAg-seropositive individuals by liquid biopsy, Proc. Natl. Acad. Sci. U. S. A., 116 (2019), 6308-6312. https://doi.org/10.1073/pnas.1819799116 doi: 10.1073/pnas.1819799116
|
| [6] |
S. Torrecilla, D. Sia, A. Harrington, Z. Zhang, L. Cabellos, H. Cornella, et al., Trunk mutational events present minimal intra- and inter-tumoral heterogeneity in hepatocellular carcinoma, J. Hepatol., 67 (2017), 1222-1231. https://doi.org/10.1016/j.jhep.2017.08.013 doi: 10.1016/j.jhep.2017.08.013
|
| [7] |
C. Cainap, S. Qin, W. Huang, I. Chung, H. Pan, Y. Cheng, et al., Linifanib versus Sorafenib in patients with advanced hepatocellular carcinoma: results of a randomized phase III trial, J. Clin. Oncol.: Off. J. Am. Soc. Clin. Oncol., 33 (2015), 172-179. https://doi.org/10.1200/jco.2013.54.3298 doi: 10.1200/jco.2013.54.3298
|
| [8] |
Y. Sun, Y. Xu, X. Yang, W. Guo, X. Zhang, S. Qiu, et al., Circulating stem cell-like epithelial cell adhesion molecule-positive tumor cells indicate poor prognosis of hepatocellular carcinoma after curative resection, Hepatology, 57 (2013), 1458-1468. https://doi.org/10.1002/hep.26151 doi: 10.1002/hep.26151
|
| [9] |
J. Nault, A. Villanueva, Intratumor molecular and phenotypic diversity in hepatocellular carcinoma, Clin. Cancer Res.: Off. J. Am. Assoc. Cancer Res., 21 (2015), 1786-1788. https://doi.org/10.1158/1078-0432.ccr-14-2602 doi: 10.1158/1078-0432.ccr-14-2602
|
| [10] |
L. Dong, L. Peng, L. Ma, D. Liu, S. Zhang, S. Luo, et al., Heterogeneous immunogenomic features and distinct escape mechanisms in multifocal hepatocellular carcinoma, J. Hepatol., 72 (2020), 896-908. https://doi.org/10.1016/j.jhep.2019.12.014 doi: 10.1016/j.jhep.2019.12.014
|
| [11] |
S. Tella, A. Mahipal, A. Kommalapati, Z. Jin, Evaluating the safety and efficacy of nivolumab in patients with advanced hepatocellular carcinoma: evidence to Date, Oncol. Targets Ther., 12 (2019), 10335-10342. https://doi.org/10.2147/ott.s214870 doi: 10.2147/ott.s214870
|
| [12] |
P. Galle, R. Finn, S. Qin, M. Ikeda, A. Zhu, T. Kim, et al., Patient-reported outcomes with atezolizumab plus bevacizumab versus sorafenib in patients with unresectable hepatocellular carcinoma (IMbrave150): an open-label, randomised, phase 3 trial, Lancet Oncol., 22 (2021), 991-1001. https://doi.org/10.1016/s1470-2045(21)00151-0 doi: 10.1016/s1470-2045(21)00151-0
|
| [13] |
H. Tan, N. Wang, C. Zhang, Y. Chan, M. Yuen, Y. Feng, Lysyl oxidase-like 4 fosters an immunosuppressive microenvironment during hepatocarcinogenesis, Hepatology, 73 (2021), 2326-2341. https://doi.org/10.1002/hep.31600 doi: 10.1002/hep.31600
|
| [14] |
M. Wu, X. Xia, J. Hu, N. Fowlkes, S. Li, WSX1 act as a tumor suppressor in hepatocellular carcinoma by downregulating neoplastic PD-L1 expression, Nat. Commun., 12 (2021), 3500. https://doi.org/10.1038/s41467-021-23864-9 doi: 10.1038/s41467-021-23864-9
|
| [15] |
X. Liu, M. Li, X. Wang, Z. Dang, Y. Jiang, X. Wang, et al., PD-1 TIGIT CD8 T cells are associated with pathogenesis and progression of patients with hepatitis B virus-related hepatocellular carcinoma, Cancer Immunol. Immunother., 68 (2019), 2041-2054. https://doi.org/10.1007/s00262-019-02426-5 doi: 10.1007/s00262-019-02426-5
|
| [16] |
S. Itoh, T. Yoshizumi, K. Yugawa, D. Imai, S. Yoshiya, K. Takeishi, et al., Impact of immune response on outcomes in hepatocellular carcinoma: association with vascular formation, Hepatology, 72 (2020), 1987-1999. https://doi.org/10.1002/hep.31206 doi: 10.1002/hep.31206
|
| [17] |
F. Liu, Y. Liu, Z. Chen, Tim-3 expression and its role in hepatocellular carcinoma, J. Hematol. Oncol., 11 (2018), 126. https://doi.org/10.1186/s13045-018-0667-4 doi: 10.1186/s13045-018-0667-4
|
| [18] |
M. Guo, F. Yuan, F. Qi, J. Sun, Q. Rao, Z. Zhao, et al., Expression and clinical significance of LAG-3, FGL1, PD-L1 and CD8T cells in hepatocellular carcinoma using multiplex quantitative analysis, J. Transl. Med., 18 (2020), 306. https://doi.org/10.1186/s12967-020-02469-8 doi: 10.1186/s12967-020-02469-8
|
| [19] |
K. Sideras, K. Biermann, J. Verheij, B. Takkenberg, S. Mancham, B. Hansen, et al., PD-L1, Galectin-9 and CD8 tumor-infiltrating lymphocytes are associated with survival in hepatocellular carcinoma, Oncoimmunology, 6 (2017), e1273309. https://doi.org/10.1080/2162402x.2016.1273309 doi: 10.1080/2162402x.2016.1273309
|
| [20] |
X. Shen, B. Zhao, Efficacy of PD-1 or PD-L1 inhibitors and PD-L1 expression status in cancer: meta-analysis, BMJ, 362 (2018), k3529. https://doi.org/10.1136/bmj.k3529 doi: 10.1136/bmj.k3529
|
| [21] |
F. Hu, C. Liu, L. Liu, Q. Zhang, A. Guo, Expression profile of immune checkpoint genes and their roles in predicting immunotherapy response, Briefings Bioinf., 22 (2021), 176. https://doi.org/10.1093/bib/bbaa176 doi: 10.1093/bib/bbaa176
|
| [22] |
D. Pardoll, The blockade of immune checkpoints in cancer immunotherapy, Nat. Rev. Cancer, 12 (2012), 252-264. https://doi.org/10.1038/nrc3239 doi: 10.1038/nrc3239
|
| [23] |
K. Campbell, A. Purdy, Structure/function of human killer cell immunoglobulin-like receptors: lessons from polymorphisms, evolution, crystal structures and mutations, Immunology, 132 (2011), 315-325. https://doi.org/10.1111/j.1365-2567.2010.03398.x doi: 10.1111/j.1365-2567.2010.03398.x
|
| [24] |
H. Afrache, P. Gouret, S. Ainouche, P. Pontarotti, D. Olive, The butyrophilin (BTN) gene family: from milk fat to the regulation of the immune response, Immunogenetics, 64 (2012), 781-794. https://doi.org/10.1007/s00251-012-0619-z doi: 10.1007/s00251-012-0619-z
|
| [25] |
P. Charoentong, F. Finotello, M. Angelova, C. Mayer, M. Efremova, D. Rieder, et al., Pan-cancer immunogenomic analyses reveal genotype-immunophenotype relationships and predictors of response to checkpoint blockade, Cell Rep., 18 (2017), 248-262. https://doi.org/10.1016/j.celrep.2016.12.019 doi: 10.1016/j.celrep.2016.12.019
|
| [26] |
Y. Dai, W. Qiang, K. Lin, Y. Gui, X. Lan, D. Wang, An immune-related gene signature for predicting survival and immunotherapy efficacy in hepatocellular carcinoma, Cancer Immunol. Immunother., 70 (2021), 967-979. https://doi.org/10.1007/s00262-020-02743-0 doi: 10.1007/s00262-020-02743-0
|
| [27] |
X. Hua, S. Ge, J. Zhang, H. Xiao, S. Tai, C. Yang, et al., A costimulatory molecule-related signature in regard to evaluation of prognosis and immune features for clear cell renal cell carcinoma, Cell Death Discovery, 7 (2021), 252. https://doi.org/10.1038/s41420-021-00646-2 doi: 10.1038/s41420-021-00646-2
|
| [28] |
A. El-Khoueiry, B. Sangro, T. Yau, T. Crocenzi, M. Kudo, C. Hsu, et al., Nivolumab in patients with advanced hepatocellular carcinoma (CheckMate 040): an open-label, non-comparative, phase 1/2 dose escalation and expansion trial, Lancet, 389 (2017), 2492-2502. https://doi.org/10.1016/s0140-6736(17)31046-2 doi: 10.1016/s0140-6736(17)31046-2
|
| [29] |
A. Zhu, R. Finn, J. Edeline, S. Cattan, S. Ogasawara, D. Palmer, et al., Pembrolizumab in patients with advanced hepatocellular carcinoma previously treated with sorafenib (KEYNOTE-224): a non-randomised, open-label phase 2 trial, Lancet. Oncol., 19 (2018), 940-952. https://doi.org/10.1016/s1470-2045(18)30351-6 doi: 10.1016/s1470-2045(18)30351-6
|
| [30] |
Z. Liu, X. Liu, J. Liang, Y. Liu, X. Hou, M. Zhang, et al., Immunotherapy for hepatocellular carcinoma: current status and future prospects, Front. Immunol., 12 (2021), 765101. https://doi.org/10.3389/fimmu.2021.765101 doi: 10.3389/fimmu.2021.765101
|
| [31] |
E. Zhao, S. Chen, Y. Dang, Development and external validation of a novel immune checkpoint-related gene signature for prediction of overall survival in hepatocellular carcinoma, Front. Mol. Biosci., 7 (2020), 620765. https://doi.org/10.3389/fmolb.2020.620765 doi: 10.3389/fmolb.2020.620765
|
| [32] |
S. Kim, H. Lee, M. Jeon, T. Yi, S. Song, Galectin-9 is involved in immunosuppression mediated by human bone marrow-derived clonal mesenchymal stem cells, Immune Network, 15 (2015), 241-251. https://doi.org/10.4110/in.2015.15.5.241 doi: 10.4110/in.2015.15.5.241
|
| [33] |
T. Kageshita, Y. Kashio, A. Yamauchi, M. Seki, M. Abedin, N. Nishi, et al., Possible role of galectin-9 in cell aggregation and apoptosis of human melanoma cell lines and its clinical significance, Int. J. Cancer, 99 (2002), 809-816. https://doi.org/10.1002/ijc.10436 doi: 10.1002/ijc.10436
|
| [34] |
A. Irie, A. Yamauchi, K. Kontani, M. Kihara, D. Liu, Y. Shirato, et al., Galectin-9 as a prognostic factor with antimetastatic potential in breast cancer, Clin. Cancer Res.: Off. J. Am. Assoc. Cancer Res., 11 (2005), 2962-2968. https://doi.org/10.1158/1078-0432.ccr-04-0861 doi: 10.1158/1078-0432.ccr-04-0861
|
| [35] |
S. Chen, J. Pu, J. Bai, Y. Yin, K. Wu, J. Wang, et al., EZH2 promotes hepatocellular carcinoma progression through modulating miR-22/galectin-9 axis, J. Exper. Clin. Cancer Res., 37 (2018), 3. https://doi.org/10.1186/s13046-017-0670-6 doi: 10.1186/s13046-017-0670-6
|
| [36] |
S. Schoenberger, R. Toes, E. van der Voort, R. Offringa, C. Melief, T-cell help for cytotoxic T lymphocytes is mediated by CD40-CD40L interactions, Nature, 393 (1998), 480-483. https://doi.org/10.1038/31002 doi: 10.1038/31002
|
| [37] |
M. Gonzalez-Carmona, V. Lukacs-Kornek, A. Timmerman, S. Shabani, M. Kornek, A. Vogt, et al., CD40ligand-expressing dendritic cells induce regression of hepatocellular carcinoma by activating innate and acquired immunity in vivo, Hepatology, 48 (2008), 157-168. https://doi.org/10.1002/hep.22296 doi: 10.1002/hep.22296
|
| [38] |
Y. Pan, Y. Tan, M. Wang, J. Zhang, B. Zhang, C. Yang, et al., Signal regulatory protein α is associated with tumor-polarized macrophages phenotype switch and plays a pivotal role in tumor progression, Hepatology, 58 (2013), 680-691. https://doi.org/10.1002/hep.26391 doi: 10.1002/hep.26391
|
| [39] |
M. Yuan, X. Zhang, J. Zhang, K. Wang, Y. Zhang, W. Shang, et al., DC-SIGN-LEF1/TCF1-miR-185 feedback loop promotes colorectal cancer invasion and metastasis, Cell Death Differ., 27 (2020), 379-395. https://doi.org/10.1038/s41418-019-0361-2 doi: 10.1038/s41418-019-0361-2
|
| [40] |
W. Ma, J. Liang, J. Mo, S. Zhang, N. Hu, D. Tian, et al., Butyrophilin-like 9 expression is associated with outcome in lung adenocarcinoma, BMC Cancer, 21 (2021), 1096. https://doi.org/10.1186/s12885-021-08790-9 doi: 10.1186/s12885-021-08790-9
|
| [41] |
Y. Li, Y. Chen, L. Miao, Y. Wang, M. Yu, X. Yan, et al., Stress-induced upregulation of TNFSF4 in cancer-associated fibroblast facilitates chemoresistance of lung adenocarcinoma through inhibiting apoptosis of tumor cells, Cancer Lett., 497 (2021), 212-220. https://doi.org/10.1016/j.canlet.2020.10.032 doi: 10.1016/j.canlet.2020.10.032
|
| [42] |
W. Fridman, F. Pagès, C. Sautès-Fridman, J. Galon, The immune contexture in human tumours: impact on clinical outcome, Nat. Rev. Cancer, 12 (2012), 298-306. https://doi.org/10.1038/nrc3245 doi: 10.1038/nrc3245
|
| [43] |
K. Kesh, V. Garrido, A. Dosch, B. Durden, V. Gupta, N. Sharma, et al., Stroma secreted IL6 selects for "stem-like" population and alters pancreatic tumor microenvironment by reprogramming metabolic pathways, Cell Death Dis., 11 (2020), 967. https://doi.org/10.1038/s41419-020-03168-4 doi: 10.1038/s41419-020-03168-4
|
| [44] |
F. Kohlhapp, J. Broucek, T. Hughes, E. Huelsmann, J. Lusciks, J. Zayas, et al., NK cells and CD8+ T cells cooperate to improve therapeutic responses in melanoma treated with interleukin-2 (IL-2) and CTLA-4 blockade, J. Immunother. Cancer, 3 (2015), 18. https://doi.org/10.1186/s40425-015-0063-3 doi: 10.1186/s40425-015-0063-3
|
 mbe-19-05-220-supplementary.pdf mbe-19-05-220-supplementary.pdf |
 |
Figures(8) / Tables(2)

Siyuan Tian, Yinan Hu, Chunmei Yang, Jiahao Yu, Jingyi Liu, Guoyun Xuan, Yansheng Liu, Keshuai Sun, Miao Zhang, Shuoyi Ma, Yulong Shang, Xia Zhou, Ying Han. A novel immune checkpoint-related gene signature for hepatocellular carcinoma to predict clinical outcomes and therapeutic response[J]. Mathematical Biosciences and Engineering, 2022, 19(5): 4719-4736. doi: 10.3934/mbe.2022220


 DownLoad: