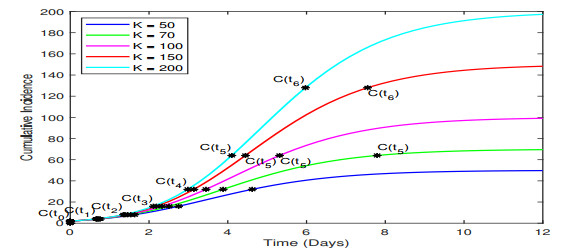
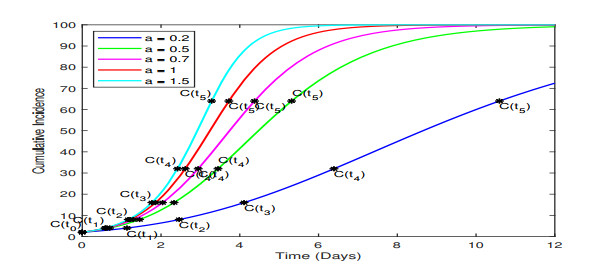
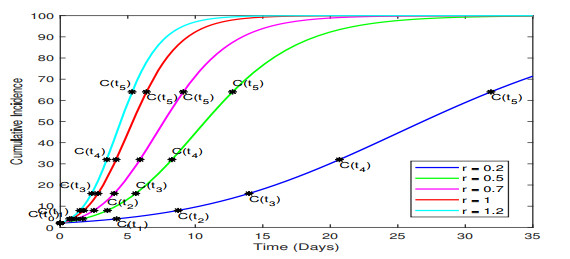
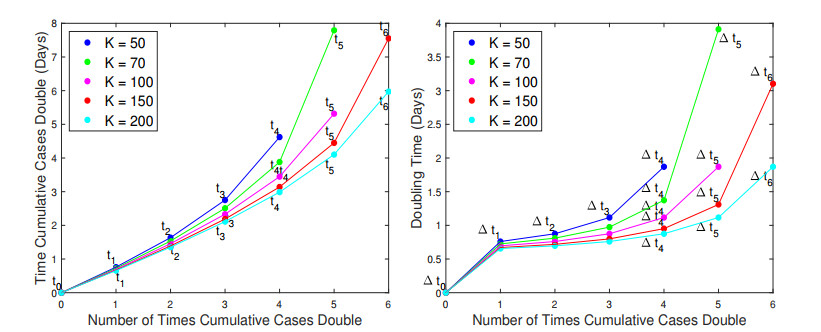
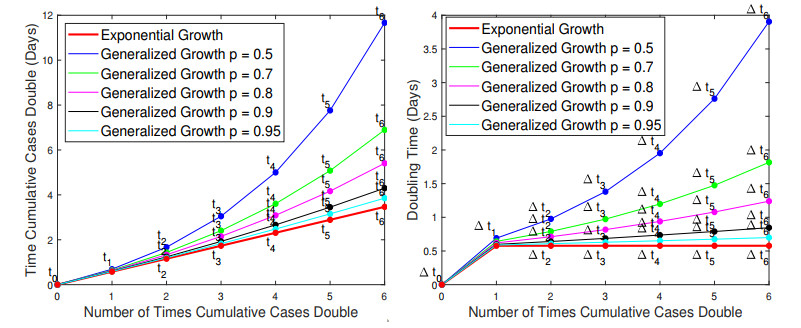
In the absence of reliable information about transmission mechanisms for emerging infectious diseases, simple phenomenological models could provide a starting point to assess the potential outcomes of unfolding public health emergencies, particularly when the epidemiological characteristics of the disease are poorly understood or subject to substantial uncertainty. In this study, we employ the modified Richards model to analyze the growth of an epidemic in terms of 1) the number of times cumulative cases double until the epidemic peaks and 2) the rate at which the intervals between consecutive doubling times increase during the early ascending stage of the outbreak. Our theoretical analysis of doubling times is combined with rigorous numerical simulations and uncertainty quantification using synthetic and real data for COVID-19 pandemic. The doubling-time approach allows to employ early epidemic data to differentiate between the most dangerous threats, which double in size many times over the intervals that are nearly invariant, and the least transmissible diseases, which double in size only a few times with doubling periods rapidly growing.
Citation: Alexandra Smirnova, Brian Pidgeon, Gerardo Chowell, Yichuan Zhao. The doubling time analysis for modified infectious disease Richards model with applications to COVID-19 pandemic[J]. Mathematical Biosciences and Engineering, 2022, 19(3): 3242-3268. doi: 10.3934/mbe.2022150
In the absence of reliable information about transmission mechanisms for emerging infectious diseases, simple phenomenological models could provide a starting point to assess the potential outcomes of unfolding public health emergencies, particularly when the epidemiological characteristics of the disease are poorly understood or subject to substantial uncertainty. In this study, we employ the modified Richards model to analyze the growth of an epidemic in terms of 1) the number of times cumulative cases double until the epidemic peaks and 2) the rate at which the intervals between consecutive doubling times increase during the early ascending stage of the outbreak. Our theoretical analysis of doubling times is combined with rigorous numerical simulations and uncertainty quantification using synthetic and real data for COVID-19 pandemic. The doubling-time approach allows to employ early epidemic data to differentiate between the most dangerous threats, which double in size many times over the intervals that are nearly invariant, and the least transmissible diseases, which double in size only a few times with doubling periods rapidly growing.

| [1] |
A. Smirnova, L. DeCamp, G. Chowell, Mathematical and statistical analysis of doubling times to investigate the early spread of epidemics: Application to the COVID-19 pandemic, Mathematics, 9 (2021), 625. https://doi.org/10.3390/math9060625 doi: 10.3390/math9060625

|
| [2] | G. Chowell, L. Simonsen, C. Viboud, Y. Kuang, Is west Africa approaching a catastrophic phase or is the 2014 Ebola epidemic slowing down? Different models yield different answers for Liberia, PLoS Curr., 6 (2014). https://doi.org/10.1371/currents.outbreaks.b4690859d91684da963dc40e00f3da81 |
| [3] | B. Hau, E. Kosman, Comparative analysis of flexible two-parameter models of plant disease epidemics, Phytopathology, 97(10), (2007), 1231–1244. https://doi.org/10.1094/PHYTO-97-10-1231 |
| [4] |
Y. H. Hsieh, Pandemic influenza A (H1N1) during winter influenza season in the southern hemisphere, Influenza Other Respi. Viruses, 4 (2010), 187–197. https://doi.org/10.1111/j.1750-2659.2010.00147.x doi: 10.1111/j.1750-2659.2010.00147.x
|
| [5] |
A. N. Tsoularis, J. Wallace, Analysis of Logistic Growth Models, Math. Biosci., 179 (2002), 21–55. https://doi.org/10.1016/S0025-5564(02)00096-2 doi: 10.1016/S0025-5564(02)00096-2
|
| [6] | M. E. J. Turner, E. L. J. Bradley, K. Kirk, K. M. Pruitt, A theory of growth Math. Biosci., 29 (1976), 367–373. https://doi.org/10.1016/0025-5564(76)90112-7 |
| [7] |
S. A. Colgate, E. A. Stanley, J. M. Hyman, S. P. Layne, C. Qualls, Risk behavior-based model of the cubic growth of acquired immunodeficiency syndrome in the United States, Proc. Natl Acad. Sci. U. S. A., 86 (1989), 4793–4797. https://doi.org/10.1073/pnas.86.12.4793 doi: 10.1073/pnas.86.12.4793
|
| [8] |
J. Ma, J. Dushoff, B. M. Bolker, D. J. Earn, Estimating initial epidemic growth rates, Bull. Math. Biol., 76 (2014), 245–60. https://doi.org/10.1007/s11538-013-9918-2 doi: 10.1007/s11538-013-9918-2
|
| [9] |
B. Szendroi, G. Csanyi, Polynomial epidemics and clustering in contact networks, Proc. Biol. Sci., 271 (2004), S364–S366. https://doi.org/10.1098/rsbl.2004.0188 doi: 10.1098/rsbl.2004.0188
|
| [10] |
C. Viboud, L. Simonsen, G. Chowell, A generalized-growth model to characterize the early ascending phase of infectious disease outbreaks epidemics, Epidemics, 15 (2016), 27–37. https://doi.org/10.1016/j.epidem.2016.01.002 doi: 10.1016/j.epidem.2016.01.002
|
| [11] | C. Jan, Gradually-varied Flow Profiles in Open Channels. Analytical Solutions by Using Gaussian Hypergeometric Function, Springer-Verlag, 2014. https://doi.org/10.1007/978-3-642-35242-3 |
| [12] | Trends in Number of COVID-19 Cases and Deaths in the US Reported to CDC, by State/Territory, 2022. Available from: https://stacks.cdc.gov/view/cdc/102187. |
| [13] |
G. Chowell, A. Tariq, J. M. Hyman, A novel sub-epidemic modeling framework for short-term forecasting epidemic waves, BMC Med., 17 (2019), 164. https://doi.org/10.1186/s12916-019-1406-6 doi: 10.1186/s12916-019-1406-6
|
| [14] |
K. Roosa, Y. Lee, R. Luo, A. Kirpich, R. Rothenberg, J. M. Hyman, et al., Short-term forecasts of the COVID-19 epidemic in Guangdong and Zhejiang, China, J. Clin. Med., 9 (2020), 596. https://doi.org/10.3390/jcm9020596 doi: 10.3390/jcm9020596
|
| [15] | N. Mukhopadhyay, Asymptotic normality of sequential stopping times with applications: Confidence intervals for an exponential mean, Calcutta Stat. Assoc. Bull., 72 (2020). https://doi.org/10.1177/0008068320923895 |
| [16] | W. Zhu, N. Zeng, N. Wang, Sensitivity, Specificity, Accuracy, Associated Confidence Interval and ROC Analysis with Practical SAS Implementations, 2010. Available from: http://www.cpdm.ufpr.br/documentos/ROC.pdf |
| [17] |
A. Owen, Empirical likelihood ratio confidence intervals for a single functional, Biometrika, 75 (1988), 237–249. https://doi.org/10.1093/biomet/75.2.237 doi: 10.1093/biomet/75.2.237
|
| [18] |
A. Owen, Empirical likelihood ratio confidence regions, Ann. Stat., 18 (1990), 90–120. https://doi.org/10.1214/aos/1176347494 doi: 10.1214/aos/1176347494
|
| [19] |
H. Huang, Y. Zhao, Empirical likelihood for the bivariate survival function under univariate censoring, J. Stat. Plann. Inference, 194 (2018), 32–46. https://doi.org/10.1016/j.jspi.2017.10.002 doi: 10.1016/j.jspi.2017.10.002
|
| [20] | G. Cheng, Y. Zhao, B. Li, Empirical likelihood inferences for the semiparametric additive, isotonic regression J. Multivar. Anal., 112 (2012), 172–182. https://doi.org/10.1016/j.jmva.2012.06.003 |
| [21] |
J. Zhang, J. Zhang, X. Zhu, T. Lu, Testing symmetry based on empirical likelihood, J. Appl. Stat., 45 (2018), 2429–2445. https://doi.org/10.1080/02664763.2017.1421917 doi: 10.1080/02664763.2017.1421917
|
| [22] |
B. Y. Jing, J. Yuan, W. Zhou, Jackknife empirical likelihood, J. Am. Stat. Assoc., 104 (2009), 1224–1232. https://doi.org/10.1198/jasa.2009.tm08260 doi: 10.1198/jasa.2009.tm08260
|
| [23] | Y. Zhao, X. Meng, H. Yang, Jackknife empirical likelihood inference for the mean absolute deviation, Comput. Stat. Data Anal., 91, (2015), 92–101. https://doi.org/10.1016/j.csda.2015.06.001 |
| [24] |
Y. Sang, X. Dang, Y. Zhao, Jackknife empirical likelihood methods for Gini correlations and their equality testing, J. Stat. Plann. Inference, 199 (2019), 45–59. https://doi.org/10.1016/j.jspi.2018.05.004 doi: 10.1016/j.jspi.2018.05.004
|
| [25] |
H. Lin, Z. Li, D. Wang, Y. Zhao, Jackknife empirical likelihood for the error variance in linear models, J. Nonparametr. Stat., 29 (2017), 151–166. https://doi.org/10.1080/10485252.2017.1285028 doi: 10.1080/10485252.2017.1285028
|
| [26] |
Y. Cheng, Y. Zhao, Bayesian jackknife empirical likelihood, Biometrika, 106 (2019), 981–988. https://doi.org/10.1093/biomet/asz031 doi: 10.1093/biomet/asz031
|
Figures(19) / Tables(11)

Alexandra Smirnova, Brian Pidgeon, Gerardo Chowell, Yichuan Zhao. The doubling time analysis for modified infectious disease Richards model with applications to COVID-19 pandemic[J]. Mathematical Biosciences and Engineering, 2022, 19(3): 3242-3268. doi: 10.3934/mbe.2022150


 DownLoad: