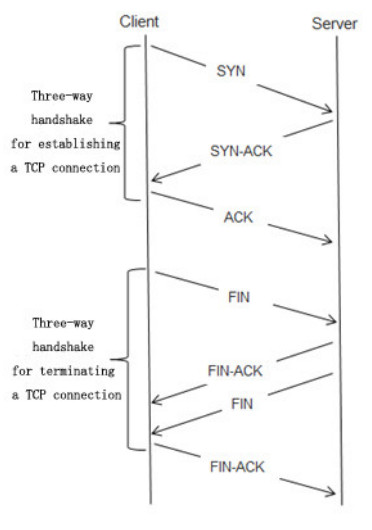
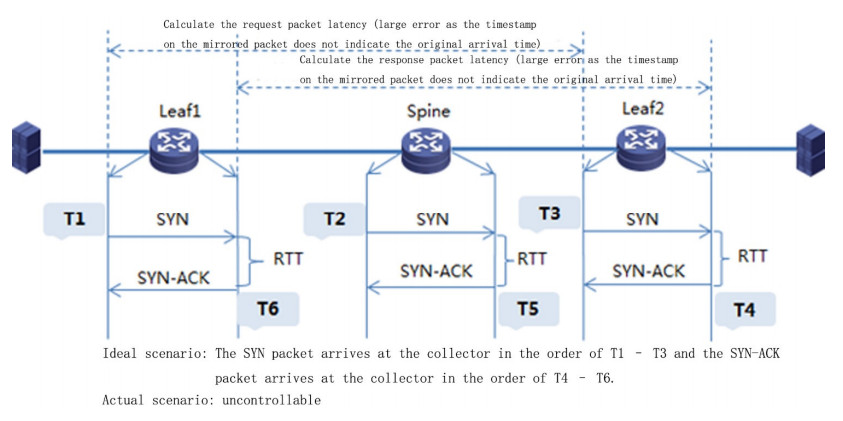
Network operation and maintenance (O & M) activities of data centers focus mainly on checking the operating states of devices. O & M engineers determine how services are running and the bearing capacity of a data center by checking the operating states of devices. However, this method cannot reflect the real transmission status of business data; therefore, engineers cannot fully comprehensively perceive the overall running conditions of businesses. In this paper, ERSPAN (Encapsulated Remote Switch Port Analyzer) technology is applied to deliver stream matching rules in the forwarding path of TCP packets and mirror the TCP packets into the network O & M AI collector, which is used to conduct an in-depth analysis on the TCP packets, collect traffic statistics, recapture the forwarding path, carry out delayed computing, and identify applications. This enables O & M engineers to comprehensively perceive the service bearing status in a data center, and form a tightly coupled correlation model between networks and services through end-to-end visualized modeling, providing comprehensive technical support for data center optimization and early warning of network risks.
Citation: Jiyuan Ren, Yunhou Zhang, Zhe Wang, Yang Song. Artificial intelligence-based network traffic analysis and automatic optimization technology[J]. Mathematical Biosciences and Engineering, 2022, 19(2): 1775-1785. doi: 10.3934/mbe.2022083
Network operation and maintenance (O & M) activities of data centers focus mainly on checking the operating states of devices. O & M engineers determine how services are running and the bearing capacity of a data center by checking the operating states of devices. However, this method cannot reflect the real transmission status of business data; therefore, engineers cannot fully comprehensively perceive the overall running conditions of businesses. In this paper, ERSPAN (Encapsulated Remote Switch Port Analyzer) technology is applied to deliver stream matching rules in the forwarding path of TCP packets and mirror the TCP packets into the network O & M AI collector, which is used to conduct an in-depth analysis on the TCP packets, collect traffic statistics, recapture the forwarding path, carry out delayed computing, and identify applications. This enables O & M engineers to comprehensively perceive the service bearing status in a data center, and form a tightly coupled correlation model between networks and services through end-to-end visualized modeling, providing comprehensive technical support for data center optimization and early warning of network risks.

| [1] | S. Smoot, Private cloud computing: Integration, virtualization and service-oriented infrastructure, Mechanical Industry Press, 2013. |
| [2] | Q. Wang, TCP/IP protocol analysis, J. North. Jiaotong Univ., 1 (1995), 112–117. doi: CNKI:SUN:BFJT.0.1995-01-025. |
| [3] | Z. Y. He, O. Li, B. W. Yang, Y. Liu, Formal description of TCP protocol based on timed Colored Petri Net, Comput. Eng., 37 (2011), 77–80. doi: CNKI:SUN:JSJC.0.2011-18-028. |
| [4] | C. Yang, Y. Q. Gui, Network traffic analysis and control strategies, Comput. Knowl. Technol., 10 (2011), 26–28+62. doi: CNKI:SUN:BGDH.0.2011-10-012. |
| [5] | H. L. Zhang, H. Wang, A sFlow-based network traffic analysis method, Comput. Eng. Sci., 8 (2007), 61–63+73. doi: CNKI:SUN:JSJK.0.2007-08-020. |
| [6] | R. Lv, W. Dai, G. Cao, Research on multiple combinations of network traffic analysis methods, Small Microcomput. Syst., 31 (2010), 631–634. |
| [7] | L. Chen, B. Dong, X. Wang, Design and implementation of a global network traffic analysis system based on SNMP protocol, J. Dalian Univ. Technol., 45 (2005), 69–72. |
| [8] | M. Xia, Research and application of root cause analysis of abnormal behavior of ethernet networks, Liaoning Univ. Eng. Technol., 2019. |
| [9] | G. Zhang, Design and Implementation of SNMP-based Performance Monitoring System, Ph.D thesis, Beijing Jiaotong University, 2008. |
| [10] | X. Li, Design and Implementation of SNMP-based Network Device Performance Monitoring System, Ph.D thesis, Beijing University, 2009. |
| [11] |
X. Zhang, J. You, A gated dilated causal convolution based encoder-decoder for network traffic forecasting, IEEE Access, 8 (2020), 6087–6097. doi: 10.1109/ACCESS.2019.2963449. doi: 10.1109/ACCESS.2019.2963449

|
| [12] | B. Pfülb, C. Hardegen, A. Gepperth, S. Rieger, A study of deep learning for network traffic data forecasting, in International Conference on Artificial Neural Networks, (2019), 497–512. doi: 10.1007/978-3-030-30490-4_40. |
| [13] |
S. H. Mousavi, M. Khansari, R. Rahmani, A fully scalable big data framework for botnet detection based on network traffic analysis, Inf. Sci., 512 (2020), 629–640. doi: 10.1016/j.ins.2019.10.018. doi: 10.1016/j.ins.2019.10.018
|
| [14] | M. Kim, H. Kong, S. Hong, S. Chung, J. W. Hong, A flow-based method for abnormal network traffic detection, in 2004 IEEE/IFIP network operations and management symposium (IEEE Cat. No. 04CH37507), 1 (2004), 599–612. |
| [15] |
E. Corchado, Á. Herrero, Neural visualization of network traffic data for intrusion detection, Appl. Soft Comput., 11 (2011), 2042–2056. doi: 10.1016/j.asoc.2010.07.002. doi: 10.1016/j.asoc.2010.07.002
|
| [16] |
T. J. M. Bench-Capon, P. E. Dunne, Argumentation in artificial intelligence, Artif. Intell., 171 (2007), 619–641. doi: 10.1016/j.artint.2007.05.001. doi: 10.1016/j.artint.2007.05.001
|


Figures(6) / Tables(2)

Jiyuan Ren, Yunhou Zhang, Zhe Wang, Yang Song. Artificial intelligence-based network traffic analysis and automatic optimization technology[J]. Mathematical Biosciences and Engineering, 2022, 19(2): 1775-1785. doi: 10.3934/mbe.2022083


 DownLoad: