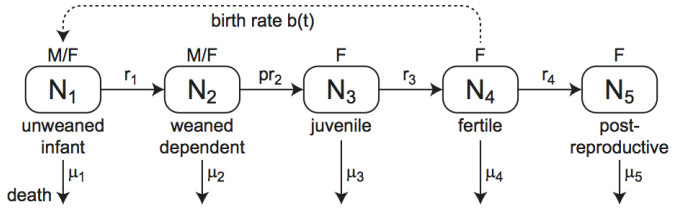
Although females in human and the great ape populations reach the end of fertility at similar ages (approximately 45 years), female humans often live well beyond their post-fertile years, while female primates typically die before or shortly after the end of fertility. The grandmother hypothesis proposes that the care-giving role provided by post-fertile females contributed to the evolution of longevity in human populations. When post-fertile females provide care for weaned infants, mothers are able to have their next baby sooner without compromising the chances of survival of their previous offspring. Thus, the post-menopausal longevity that is unique to human populations may be an evolutionary adaptation. In this work, we construct, simulate, and analyze an ordinary differential equations mathematical model to study the grandmother hypothesis. Our model describes the passage of the individuals of a population through five life stages in the cases with and without grandmothering. We demonstrate via numerical simulation of the mathematical model that grandmothering care is sufficient to significantly increase adult life expectancy. We also investigate the relationship between the number of weaned infants that a post-fertile female can care for at a given time and the steady-state age distributions of a population.
Citation: Dana Paquin, David Kato, Peter Kim. A mathematical model for the effects of grandmothering on human longevity[J]. Mathematical Biosciences and Engineering, 2020, 17(4): 3175-3189. doi: 10.3934/mbe.2020180
Although females in human and the great ape populations reach the end of fertility at similar ages (approximately 45 years), female humans often live well beyond their post-fertile years, while female primates typically die before or shortly after the end of fertility. The grandmother hypothesis proposes that the care-giving role provided by post-fertile females contributed to the evolution of longevity in human populations. When post-fertile females provide care for weaned infants, mothers are able to have their next baby sooner without compromising the chances of survival of their previous offspring. Thus, the post-menopausal longevity that is unique to human populations may be an evolutionary adaptation. In this work, we construct, simulate, and analyze an ordinary differential equations mathematical model to study the grandmother hypothesis. Our model describes the passage of the individuals of a population through five life stages in the cases with and without grandmothering. We demonstrate via numerical simulation of the mathematical model that grandmothering care is sufficient to significantly increase adult life expectancy. We also investigate the relationship between the number of weaned infants that a post-fertile female can care for at a given time and the steady-state age distributions of a population.

| [1] | S. L. Robson, C. P. van Schaik, K. Hawkes, The derived features of human life history, in The Evolution of Human Life History (eds. K. Hawkes and R. R. Paine), School of American Research Press, (2006), 17-44. |
| [2] |
G. C. Williams, Pleiotropy, natural selection, and the evolution of senescence, Evolution, 11 (1957), 398-411. doi: 10.1111/j.1558-5646.1957.tb02911.x

|
| [3] |
M. Pavelka, L. Fedigan, Reproductive termination in female Japanese monkeys: A comparative lifehistory perspective, Am. J. Phys. Anthropol., 109 (1999), 455-464. doi: 10.1002/(SICI)1096-8644(199908)109:4<455::AID-AJPA3>3.0.CO;2-Z
|
| [4] |
C. Packer, M. Tatar, A. Collins, Reproductive cessation in female mammals, Nature, 392 (1998), 807-811. doi: 10.1038/33910
|
| [5] | K. Hawkes, J. F. O'Connell, N. G. Blurton Jones, The evolution of human life histories: Primate tradeoffs, grandmothering socioecology, and the fossil record, in Primate Life Histories and Socioecology (eds. P. Kappeler and M. Pereira), University of Chicago Press, (2003), 204-227. |
| [6] | N. Howell, Demography of the Dobe!Kung, Academic Press, New York, 1979. |
| [7] |
K. Hill, C. Boesch, J. Goodall, A. Pusey, J. Williams, R. Wrangham, Mortality rates among wild chimpanzees, J. Human Evol., 40 (2001), 437-450. doi: 10.1006/jhev.2001.0469
|
| [8] | K. Hawkes, J. F. O'Connell, N. G. B. Jones, Hardworking Hadza grandmothers, in Comparative Socioecology: The Behavioral Ecology of Humans and Other Mammals (eds. K. hawkes, J. F. O'Connell and N. G. B. Jones), UK: Blackwell Scientific Publications, Oxford, (1989), 341-366. |
| [9] |
K. Hawkes, Grandmothers and the evolution of human longevity, Am. J. Hum. Biol., 15 (2003), 380-400. doi: 10.1002/ajhb.10156
|
| [10] |
R. Sear, D. Coall, How much does family matter? Cooperative breeding and the demongraphic transition, Popul. Dev. Rev., 37 (2011), 81-112. doi: 10.1111/j.1728-4457.2011.00379.x
|
| [11] |
A. F. Kachel, L. S. Premo, J. J. Hublin, Grandmothering and natural selection, Proc. R. Soc. B: Biol. Sci., 278 (2011), 384-391. doi: 10.1098/rspb.2010.1247
|
| [12] |
P. S. Kim, J. E. Coxworth, K. Hawkes, Increased longevity evolves from grandmothering, Proc. R. Soc. B: Biol. Sci., 279 (2012), 4880-4884. doi: 10.1098/rspb.2012.1751
|
| [13] |
P. S. Kim, J. S. McQueen, J. E. Coxworth, K. Hawkes, Grandmothering drives the evolution of longevity in a probabilistic model, J. Theor. Biol., 353 (2014), 84-94. doi: 10.1016/j.jtbi.2014.03.011
|
| [14] |
M. H. Chan, K. Hawkes, P. Kim, Evolution of longevity, age at last birth and sexual conflict with grandmothering, J. Theor. Biol., 393 (2016), 145-157. doi: 10.1016/j.jtbi.2015.12.014
|
| [15] | E. L. Charnov, Life History Invariants: Some Explorations of Symmetry in Evolutionary Ecology, Oxford University Press, Oxford, 1993. |
| [16] |
B. Dyke, T. B. Gage, P. L. Alford, B. Swenson, S. Williams-Blangero, Model life table for captive chimpanzees, Am. J. Primatol., 37 (1995), 25-37. doi: 10.1002/ajp.1350370104
|
| [17] |
C. Boesch, C. Bolé, N. Eckhardt, H. Boesch, Altruism in forest chimpanzees: The case of adoption, PLoS ONE, 5 (2010), e8901. doi: 10.1371/journal.pone.0008901
|
| [18] |
M. E. Thompson, M. N. Muller, R. W. Wrangham, The energetics of lactation and the return to fecundity in wild chimpanzees, Behav. Ecol., 23 (2012), 1234-1241. doi: 10.1093/beheco/ars107
|
| [19] | P. Grey, K. G. Anderson, Fatherhood: Evolution and Human Paternal Behavior, Harvard University Press, Cambridge, 2010. |
| [20] |
K. Kramer, The evolution of human parental care and recruitment of juvenile help, Trends Ecol. Evol., 26 (2011), 533-540. doi: 10.1016/j.tree.2011.06.002
|
| [21] |
K. Isler, C. P. van Schaik, The expensive brain: A framework for explaining evolutionary changes in brain size, J. Hum. Evol., 57 (2009), 392-400. doi: 10.1016/j.jhevol.2009.04.009
|
| [22] |
H. Kaplan, K. Hill, J. Lancaster, A. M. Hurtado, A theory of human life history evolution: Diet, intelligence, and longevity, Evol. Anthropol., 9 (2000), 156-185. doi: 10.1002/1520-6505(2000)9:4<156::AID-EVAN5>3.0.CO;2-7
|
| [23] |
H. Kaplan, M. Gurven, J. Winking, P. Hooper, J. Stieglitz, Learning, menopause and the human adaptive complex, Ann. NY Acad. Sci., 1204 (2010), 30-42. doi: 10.1111/j.1749-6632.2010.05528.x
|
Figures(7) / Tables(3)

Dana Paquin, David Kato, Peter Kim. A mathematical model for the effects of grandmothering on human longevity[J]. Mathematical Biosciences and Engineering, 2020, 17(4): 3175-3189. doi: 10.3934/mbe.2020180


 DownLoad: