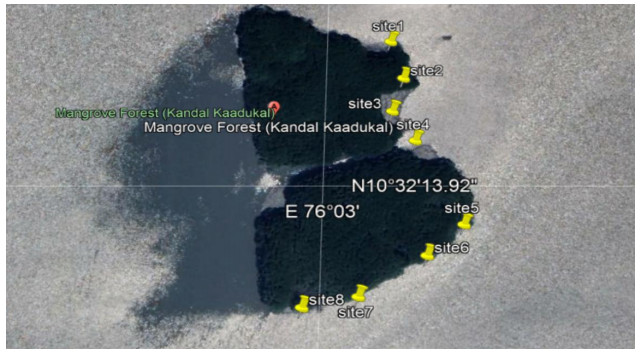
This study investigates an account on the diversity and abundance of benthic infauna of Chettuva mangrove in Kerala. Marine benthic infaunal species are an important factor in marine ecosystems and play a chief ecological function in the mangrove ecosystem. This research article gives an overview of infaunal diversity associated with eight sites of Chettuva mangrove. The present study revealed that infaunal species are significantly moderate within this mangrove ecosystem.
Citation: Rukhsana Kokkadan, Resha Neznin, Praseeja Cheruparambath, Jerisa Cabilao, Salma Albouchi. A Study of Infaunal Abundance, Diversity and Distribution in Chettuva Mangrove, Kerala, India[J]. AIMS Environmental Science, 2023, 10(1): 82-92. doi: 10.3934/environsci.2023005
This study investigates an account on the diversity and abundance of benthic infauna of Chettuva mangrove in Kerala. Marine benthic infaunal species are an important factor in marine ecosystems and play a chief ecological function in the mangrove ecosystem. This research article gives an overview of infaunal diversity associated with eight sites of Chettuva mangrove. The present study revealed that infaunal species are significantly moderate within this mangrove ecosystem.

| [1] |
Zhi QW, Ming HC, Yi ML, et al. (2018) Different effects of reclamation methods on macrobenthos community structure in the Yangtze Estuary, China. Marine Pollution Bulletin 127: 429–436. https://doi.org/10.1016/j.marpolbul.2017.12.038 doi: 10.1016/j.marpolbul.2017.12.038

|
| [2] |
Lv WW, Liu ZQ, Yang Y, et al. (2016) Loss and self-restoration of macrobenthic diversity in reclamation habitats of estuarine islands in Yangtze Estuary, China. Marine Pollution Bulletin 103: 128–136. https://doi.org/10.1016/j.marpolbul.2015.12.030 doi: 10.1016/j.marpolbul.2015.12.030
|
| [3] |
Zainal K, Al-Sayed H, Ghanem E, et al. (2007) Baseline ecological survey of Huwar islands, The Kingdom of Bahrain. Aquat Ecosyst Health Manag 10: 290–300. https://doi.org/10.1080/14634980701520882 doi: 10.1080/14634980701520882
|
| [4] |
Ali TS (2014) Spatial and temporal variations of marine benthic infauna community in northern and southern areas of the Kingdom of Bahrain. Arab Gulf J Sci Res 32: 80–92. https://doi.org/10.51758/AGJSR-01-2014-0010 doi: 10.51758/AGJSR-01-2014-0010
|
| [5] | Fauvel P (1923) PolycheÁtes errantes. Faune de France. Paris 5: 1–488. |
| [6] | Fauvel P (1927) PolycheÁtes seÂdentaires. Faune de France. Paris 16: 1–488. |
| [7] | Hartman O (1968) Atlas of the errantiate polychaetous annelids from California. |
| [8] | Hartman O (1969) Atlas of the sedentariate polychaetous annelids from California. Allan Hancock Foundation. Uni South California, LA. |
| [9] |
Day JH (1967) A monograph on the Polychaeta of Southern Africa. British Museum of Natural History, Publication 656: 1–878. https://doi.org/10.5962/bhl.title.8596 doi: 10.5962/bhl.title.8596
|
| [10] | MACKIE AY (1994) Adercodon pleijeli gen. et sp. nov. (Polychaeta, Ampharetidae) from the Mediterranean Sea. Mémoires du Muséum national d'histoire naturelle 162: 243–250. |
| [11] | Fauvel P (1953) The fauna of India including Pakistan. Ceylon, Burma and Malaya, Annelida Polychaeta, Allahabad. |
| [12] | Clark KR, Gorley RN (2006) Primer v7: User Mannual/Tutorial. Plymouth: Primer-E 182. |
| [13] | Shannon CE, Wiener W (1949) The Mathematical Theory of Communication. Urbana: University of Ilinois Press. |
| [14] | Margalef R (1958) Information theory in ecology. International Journal of General Systems 3: 36–71. |
| [15] |
Pielou EC (1966) The measurement of diversity in different types of biological collections. Journal of Theoretical Biology 13: 131–144. https://doi.org/10.1016/0022-5193(66)90013-0 doi: 10.1016/0022-5193(66)90013-0
|
| [16] |
Shepard RN (1962) The analysis of proximaties: Multidimensional scaling with an unknown distance function. Phychometrika 27: 125–140. https://doi.org/10.1007/BF02289630 doi: 10.1007/BF02289630
|
| [17] |
Kruskal JB (1964) Multidimensional scaling by optimising goodness of fit to a nonmetric hypothesis. Pscyhometrika 29: 1–27. https://doi.org/10.1007/BF02289565 doi: 10.1007/BF02289565
|
| [18] | Paul VRS, Blackburn HT, Pat H, et al. (1997) The importance of marine sediment biodiversity in ecosystems processe. AMBIO 26: 578–583. |
| [19] |
Simpson EH (1949) Measurement of diversity. Nature 163: 688–688. https://doi.org/10.1038/163688a0 doi: 10.1038/163688a0
|
| [20] |
Cootam G, Curtis JT (1956) The use of distance measures in phytosociology sampling. Ecology 37: 451–460. https://doi.org/10.2307/1930167 doi: 10.2307/1930167
|
| [21] | Gauch Jr HG (1983) Multivariate analysis in community structure. Cambridge University Press, Cambridge. |
| [22] |
Ter Braak CJF, Prentice IC (1988) A theory of gradient analysis. Advances in Ecological Research 18: 271–313. https://doi.org/10.1016/S0065-2504(08)60183-X doi: 10.1016/S0065-2504(08)60183-X
|
| [23] | Bandekar PD, Naik UG, Haragi SB (2017) Diversity status of benthic macro polychaetes species in estuarine region of Karwar, West Coast of India. International Journal of Fisheris and Aquatic Studies 5: 216–219. |
| [24] |
Sarkar SK, Bhattacharya A, Giri S, et al. (2005) Spatiotemporal variation in benthic polychaetes (Annelida) and relationships with environmental variables in a tropical estuary. Wetlands Ecology and Management 13: 55–67. https://doi.org/10.1007/s11273-003-5067-y doi: 10.1007/s11273-003-5067-y
|
| [25] |
Lv WW, Huang YH, Liu ZQ, et al. (2016) Application of macrobenthic diversity to estimate ecological health of artificial oyster reef in Yangtze Estuary, China. Marine Pollution Bulletin 103: 137–143. https://doi.org/10.1016/j.marpolbul.2015.12.029 doi: 10.1016/j.marpolbul.2015.12.029
|
| [26] |
Liu ZQ, Fan B, Huang YH, et al. (2019) Assessing the ecological health of the Chongming Dongtan Nature Reserve, China, using different benthic biotic indices. Marine Pollution Bulletin 146: 76–84. https://doi.org/10.1016/j.marpolbul.2019.06.006 doi: 10.1016/j.marpolbul.2019.06.006
|
| [27] | Dittmann S (2001) Abundance and distribution of small infauna in mangroves of Missionary Bay, North Queenland, Australia. Revista de Biologia Tropical 49: 535–544. |
| [28] | Jaritkhuan S, Damrongrojwattana P, Chewprecha B, et al. (2017) Diversity of Polychaetes in Mangrove Forest, Prasae Estuary, Rayong Province, Thailand. Chiang Mai Journal of Science, 44: 816–823. |


Figures(8) / Tables(4)

Rukhsana Kokkadan, Resha Neznin, Praseeja Cheruparambath, Jerisa Cabilao, Salma Albouchi. A Study of Infaunal Abundance, Diversity and Distribution in Chettuva Mangrove, Kerala, India[J]. AIMS Environmental Science, 2023, 10(1): 82-92. doi: 10.3934/environsci.2023005


 DownLoad: