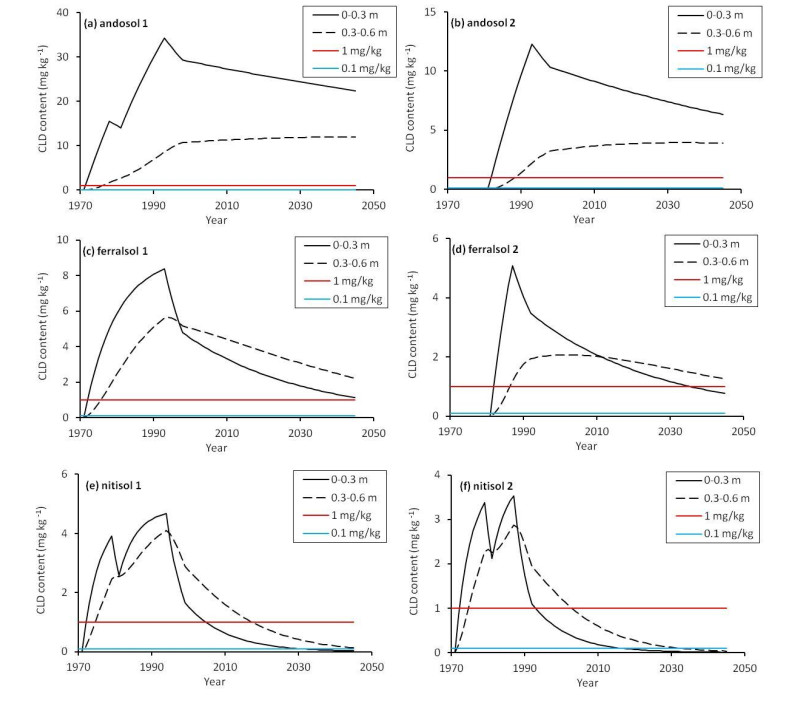
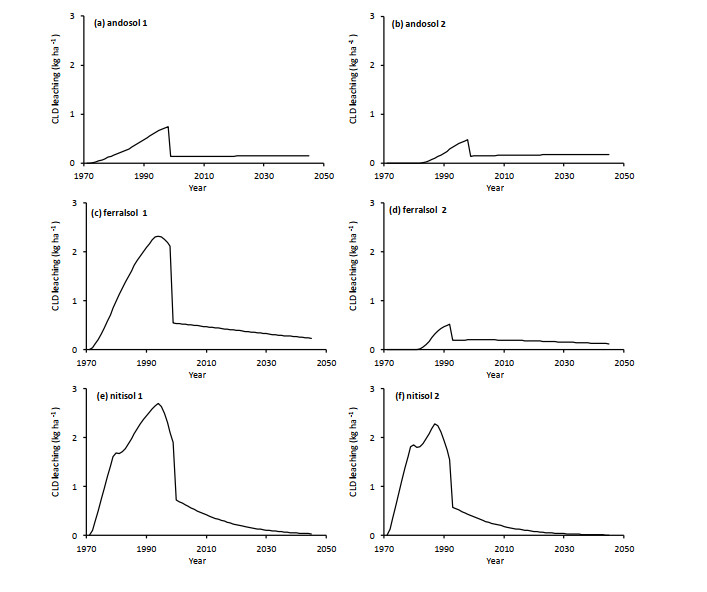
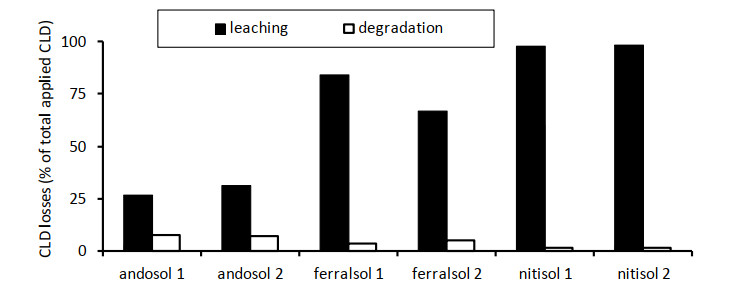
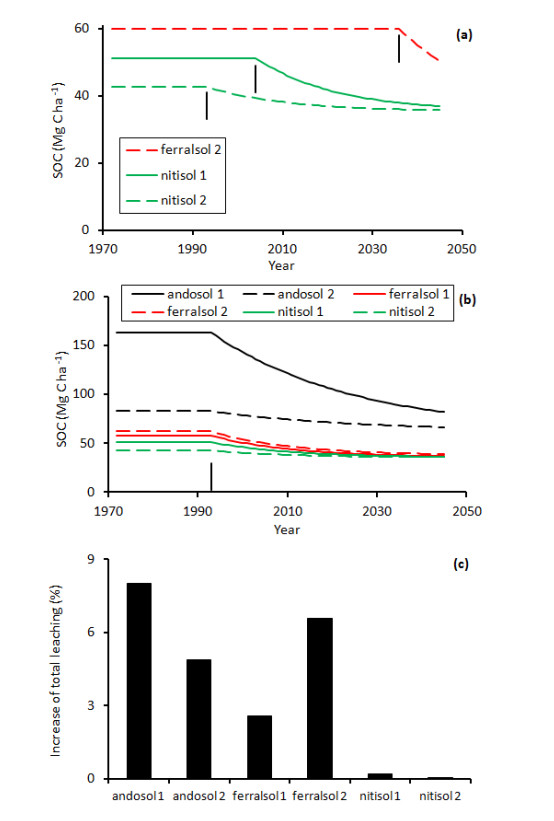
1.
Introduction
The organochlorine insecticide chlordecone (CLD) was used in French Antilles (Guadeloupe and Martinique) from 1972 to 1993 to control banana weevil (Cosmopolites sordidus), which resulted in diffuse soil pollution that induced environmental damage, crop contamination and severe problems for human health [1]. Chlordecone is a very stable and recalcitrant molecule, with a strong affinity for soil organic matter (SOM) and very low volatility [2]. Cabidoche et al. (2009) were the first to report that the persistence of CLD differs between soil types, ranging from decades for nitisols, centuries for ferralsols to about a millennium for andosols; this is linked to their different mineralogy and SOM contents that markedly affect their sorption properties [3]. Some 30 years after these treatments ended, one third of the agricultural land in French Antilles is still polluted by CLD, and both animal breeding and the cultivation of many crops for human consumption (mainly tuber and root crops) have been banned on these soils [4]. In this context, the Guadeloupe Department of Food, Agriculture and Forestry established three thresholds for soil CLD content in the topsoil of polluted land for the cultivation of vegetables (<1 mg CLD kg-1) and tuber crops (<0.1 mg CLD kg-1), and for animal breeding (<0.003 mg CLD kg-1) [5] that would enable the level of contamination of harvested organs and meat not to exceed the maximum residue limit (MRL) defined by European Union health regulations [6]. At present, only banana, orchards and some vegetable crops such as tomato and pepper can be cultivated in soils containing > 1 mg CLD kg-1, because CLD is no longer detected in the harvested fruits [5].
Despite the high stability of CLD, some authors have reported evidence of limited CLD degradation in laboratory experiments under aerobic [7] and anaerobic conditions [8], and its relatively high degradation in the field under anaerobic conditions in a nitisol amended with zero valent iron [1]. Although the CLD content in topsoil had fallen by up to 30% three months after the application of the treatment in the latter study, maintaining anaerobic conditions for several months under real-life soil management by farmers is extremely difficult because of the high water drainage that characterizes the volcanic soils of French Antilles [9]. In a recent study, Cattan et al. (2019) used a model of CLD and metabolite sorption, leaching and degradation to estimate the annual rate of CLD degradation in Martinique soils from data on the CLD and metabolite contents in surface water and groundwater [10]. They found that the estimated annual rate of CLD degradation ranged from 0.02% to 0.15% of the soil CLD stock, which was much less than the rate of CLD leaching. Based on the information available concerning CLD dynamics it can therefore be assumed that leaching is the principal process affecting CLD stocks in the volcanic soils of French Antilles [3,10].
Most studies of soil CLD have only accounted for its dynamics or status in the topsoil layer [3,11,12]. Clostre et al. (2014) analyzed the vertical heterogeneity of CLD levels in six agricultural fields in French Antilles, and observed that although the topsoil layer (e.g., 0–0.3 m) generally contained higher levels than the subsoil layer (e.g., 0.3–0.6 m), the differences between layers were very small for some soils (e.g., 3%), and in one case more CLD was found in the subsoil layer [13]. These authors also noted that within each soil type analyzed (andosols and ferralsols) the CLD content in both layers displayed considerable variability (e.g., the coefficients of variation ranged from 30% to 45%). Such variability may be associated with differences in the total rate of CLD spreading, management of the cropping system and the tillage practices applied by farmers [11]. Cabidoche et al. (2009) also found that the capacity of CLD sorption varies strongly within each soil type, which might differently affect the ratio of CLD content between soil layers since the time of the last CLD application [3]. Taken together, these results suggest that CLD levels in the subsurface layer cannot be predicted directly from observed data on the topsoil layer. Indeed, knowledge of CLD dynamics in the subsurface layer might be crucial when the CLD content in the topsoil approaches the established threshold that permits the cultivation of vegetable crops. This would contribute to reducing the risk of crop contamination for vegetables with a relatively deep root system such as cucumber, pumpkin, melon and watermelon (e.g., 0.6 m depth) [14], which are currently banned on soils with CLD levels > 1 mg kg-1 in the 0–0.3 m layer [5].
Another factor involved in the cultivation of vegetable crops is the impact of these cropping systems on the level of soil organic carbon (SOC) stocks, which may affect the sorption properties of the soil. Sierra et al. (2015, 2017) found that although SOC under the current banana and orchards systems are near or at the steady-state, most vegetable cropping systems in French Antilles induce a reduction in SOC stocks at rates that range from 0.5% to 1% per year [15,16]. Sierra et al. (2015) proposed that such differences between systems are mainly due to the frequency and intensity of soil tillage, which is much higher for vegetable crops [15]. It could be hypothesized that the cultivation of vegetable crops after the topsoil reaches the critical threshold may enhance CLD desorption and leaching, and thus increase the risk of environmental pollution. The same could have occurred since 1993 when a financial crisis affecting the banana sector generated a 32% reduction in the area cultivated with this crop that was partially replaced by vegetable and food crops [17]. It is interesting to note that this crisis was not linked to soil pollution by CLD, which was revealed for the first time in the early 2000s [18]. In a recent study, Sabatier et al. (2021) observed that changes in farming practices on polluted soils in French Antilles, including use of the herbicide glyphosate from the late 1990s, induced a rise in CLD levels in marine sediment through the cumulated erosion of contaminated bare soils [19]. To our knowledge, no study has been performed to assess the overall effect of changes in land use and farming practices on CLD dynamics in soil in terms of SOC and CLD interactions. This is necessary to better manage the risk of crop contamination and to prevent any changes to the management of the cropping systems that might cause a further release of soil CLD towards other environmental compartments.
The aim of this work was therefore to determine the impact of changes in land use on the temporal pattern of CLD content in the topsoil and subsurface layers of different soil types in French Antilles (nitisols, ferralsols and andosols). To achieve this, we applied a modeling approach coupling the WISORCH model that describes CLD dissipation [3] and the MorGwanik model that describes SOC dynamics in different soil types and under different cropping systems [15]. Simulations were carried out over the 1972–2045 period, thus including the time of CLD spreading (1972–1993) and the subsequent phase characterized by CLD losses. We analyzed two cropping systems involving banana in monoculture and banana followed by a monoculture of vegetable crops.
2.
Material and methods
2.1. Soils
The soils analyzed during this study are located in Basse-Terre, the main island of the Guadeloupe archipelago (French Antilles) located in the eastern Caribbean (16°05′ N, 61°40′ W). Basse-Terre Island covers 848 km2 and is dominated by a mountain chain oriented northwest to southeast where the crest stands at 1467 m.a.s.l. (La Soufrière volcano). Although the land west of the crest slopes steeply toward the Caribbean Sea (20–30% slopes), the eastern side of the chain slopes more gently toward the Atlantic Ocean (10% slopes). The soils affected by CLD pollution are located in the southern part of the island where banana cultivated as a monoculture is the main cropping system. The soils are nitisols and ferralsols in the lowlands and andosols in the uplands (FAO classification) [15]. The mean air temperature and mean annual rainfall are respectively 25.0 ℃ and 2200 mm yr-1 in the lowlands, and 23.9 ℃ and 3800 mm yr-1 in the uplands. Nitisols are rich in halloysite clay (around 50%) and have developed on young ash deposits; the soil pH ranges from 5.0 to 6.5, and the cation exchange capacity from 15 cmol kg-1 to 35 cmol kg-1. Ferralsols are rich in kaolinite (around 35%) and aluminum and iron hydrous oxides (around 40%) and have developed on old ash deposits. The soil pH ranges from 4.5 to 5.5, while their cation exchange capacity ranges from 10 cmol kg-1 to 20 cmol kg-1. Andosols are characterized by high amorphous clay content (around 75%) and have developed on young ash deposits. They are very porous and have high aluminum content; the soil pH ranges from 5.0 to 6.5 and the cation exchange capacity from 30 cmol kg-1 to 50 cmol kg-1. SOC stocks are relatively high in all the soils and vary markedly between soil types (Table 1).
For this study, we selected two soils of each type included in the database generated during the study by Cabidoche et al. (2009) [3]. The soils selected within each type corresponded to plots that had received extreme rates of CLD applications between 1972 and 1993. Some characteristics of the selected soils are presented in Table 1. Note that the level of rainfall varies between soil types and within each type as a function of the microclimate surrounding the plots.
2.2. Model of chlordecone dynamics
We used the WISORCH model proposed by Cabidoche et al. (2009) to assess the dynamics of CLD in the topsoil layer [3]. Taking account of the fact that CLD volatilization is nil [2], and losses of CLD by crop uptake [6] and runoff [10] are negligible when compared to CLD stocks in the soil, this model only considers desorption and leaching as the main soil processes affecting CLD stocks. We extended the original model to account for CLD dynamics in the subsurface layer. We also included a term dealing with CLD degradation by soil microorganisms to assess the potential impact of such process on changes in CLD dynamics, using the approach proposed by Cattan et al (2019) [10].
The basic equations of the model are as follows: for the topsoil layer (i.e., 0–0.3 m in this study)
for the subsurface layer (i.e., 0.3–0.6 m in this study)
with
where the suffixes (T) and (S) indicate respectively the topsoil and subsurface layers, the suffix (L) in Eq 3 indicates (T) or (S), CLDn(L) and CLDn-1(L) (kg CLD ha-1) are the CLD stocks in both layers in years n and n-1, respectively, Sn (kg CLD ha-1) is the CLD spread on the soil surface in year n, Deg(L) (yr-1) is the annual rate of CLD degradation for each layer, Drain (m) is the water drainage in year n, KOC(L) (m3 kg-1) is the partitioning coefficient of CLD between SOC and water for each layer, SOCn(L) (Mg SOC ha-1) is the stock of SOC for each layer in year n, and CLDleach, n(T) (kg CLD ha-1) is the CLD leached from the topsoil and entering the subsurface layer in year n, which is calculated using Eq 1. The factor 10 in Eq 3 arises from the units chosen and allowed us to express CLD stocks in kg ha-1. The exponential term in Eq 3 represents the CLD desorption process which is affected by KOC(L) and SOC(L), and the leaching of the CLD released through water drainage. Note that KOC, as expressed in Eq 3, also depends on soil mineralogy [3,20]. This is further discussed in section 3.1. Eq 2 implies that all the CLD leached from the topsoil layer was a CLD input for the subsurface layer. As mentioned above, this assumption is based on the fact that other CLD losses are negligible in the soils being analyzed. The model considers two types of water drainage: i- forced drainage linked to the stemflow induced by the banana plant, which affects CLD leaching during the five years after the last CLD application; it is calculated as 1.2 × annual rainfall, and ii- after that period, homogeneous drainage estimated according to the water balance [3]. The forced drainage was included in the model to take into account that rainfall redistribution by plant canopy induces strong water drainage at the foot of the banana stem, downstream from the stemflow, which crosses the foot spreading of CLD during the application period (i.e., 1972–1993) [3].
The corresponding CLD gravimetric content (CLDcont, in mg CLD kg-1) of each soil layer was calculated as:
where BD(L) (Mg m-3) and Z(L) (m) are respectively the bulk density and thickness of each soil layer. The factor 10 arises from the units chosen and allowed us to express CLDcontn(L) in mg CLD kg-1.
The original WISORCH model accounts for the mechanical dilution of CLD between layers when the depth of soil tillage (e.g., every 5 yr for the banana cropping systems) exceeds the bottom of the topsoil layer [3]. However, it is not clear from the formalisms of the model how the subsurface layer contributes to CLD dilution in the topsoil, and whether SOC dilution between layers is also accounted for. The latter could be important because changes in SOC may affect the sorption properties of the soil (Eq 3). In the present study we did not include any effect of soil tillage on CLD dilution by assuming that tillage only concerned the topsoil layer (i.e., tillage depth equal to 0.3 m). This is further discussed in section 3.1.
2.3. Model of soil organic carbon dynamics
We used the MorGwanik model to assess the impact of changing the cropping system from banana to vegetable crops on the SOC stocks of the topsoil layer, and to set the SOCn(T) value in Eq 1. This model was calibrated and tested using data of the time course of SOC stocks obtained from 253 plots covering most soil types, climates and cropping systems present in the Caribbean, and has been applied successfully to assessing SOC dynamics in many Guadeloupe cropping systems [15,16]. MorGwanik simulates SOC dynamics as a function of annual C inputs and outputs at the plot scale. The basic equation of the model is:
where Cres, n (Mg C ha-1) is the C input from crop residues (aboveground and roots) in year n, Came, n (Mg C ha-1) is the C input from organic amendments in year n, hres and hame (unitless) are respectively the humification coefficients of crop residues and organic amendments, ksoil (yr-1) is the SOC mineralization rate constant for each soil type, and ktill (unitless) is the coefficient accounting for the effect of soil tillage on SOC mineralization. Although ksoil is specific to each soil type, ktill is specific to each cropping system (e.g., higher for annual crops than perennial crops). In this study we did not consider the application of organic amendments and the only C input corresponded to crop residues.
As the SOC stock values in the subsurface layer were lacking for the soils analyzed in this study, we used experimental data reported by other authors to set the initial value of SOCn(S) in Eq 2. In this way, SOC stocks in the subsurface layer represented 56% of the SOC stock in the topsoil layer of andosols [20], 81% of ferralsols [21], and 85% of nitisols [22]. As MorGwanik only accounts for the topsoil layer, we assumed that annual changes in SOC stocks in the subsurface layer corresponded to a fraction of those occurring in the topsoil layer:
where 0.1 is the fraction of the change in the topsoil that was applied to the subsurface layer (i.e., 10%). That value is an average of the changes observed by Poeplau et al. (2011) and Balesdent et al. (2018) in studies dealing with the temporal dynamics of SOC as a function of soil depth [23,24]. Note that SOCn(S) may increase, decrease or remain constant as a function of changes in the topsoil.
2.4. Simulations
A first series of simulations was performed from 1972 to 2045 to assess the effect of soil type on CLD dynamics in the topsoil and subsurface layers. Simulations were made for soils cultivated with a banana monoculture, which corresponds to the more common cropping system observed on polluted soils in French Antilles [10]. This was performed with and without CLD degradation in order to test the impact of this process on changes in CLD content. Data of KOC for the subsurface layer of the analyzed soils was lacking, but the information available indicated that KOC would remain quite stable up to 0.6 m for soils in Guadeloupe [3,20]. We therefore used the same KOC value for both layers in each soil. The same could reasonably be assumed for BD(L) in Eq 4 [21,25]. For the simulations carried out to test the impact of CLD degradation, Deg(T) in Eq 1 was set at 0.0015 yr-1 (i.e., 0.15% of the CLD stock), which is the median value reported by Cattan et al. (2019) for natural CLD degradation in the soils of Martinique (French Antilles) [10]. These authors estimated CLD degradation in soil from data on the pollutant contents in surface water and groundwater at the watershed scale, which involved several soil types. Because data of CLD degradation for each soil type is lacking, in the present study we considered the same Deg value for all the soils and layers analyzed. This simplification is further discussed in section 3.2. The parameter values for the WISORCH model are presented in Table 1. The values of soil and banana parameters for the MorGwanik model are presented in Tables S1, S2 and S3 in Appendix A. Both models were initialized with the SOC stocks presented in Table 1.
A second series of simulations was carried out to assess the impact on CLD and SOC dynamics of changing the cropping system from a banana monoculture to vegetable crops. This was performed in two steps. First, we tested the impact of such a change as from the next year when the CLD content was < 1mg CLD kg-1 in the topsoil layer, which is the maximum CLD level in topsoil established by the Guadeloupe Department of Food, Agriculture and Forestry to permit the cultivation of vegetable crops [5]. In the second step we set the change of cropping system at 1993 for all soils. As mentioned above, the crisis experienced by the banana sector that year induced an increase in the area cultivated with vegetables at the expense banana crops. All these simulations were carried out considering a banana monoculture from 1972 to the year of the change, and then annual vegetable crops up to 2045. The values of soil and vegetable crop parameters for the MorGwanik model are presented in Tables S1 and S2, respectively. Changes in CLD stocks were estimated as for the first simulation series using the parameter values presented in Table 1.
3.
Results and discussion
3.1. Impact of soil type on CLD dynamics
In this section we present the results obtained excluding CLD degradation.The topsoil layer presented a first phase corresponding to the period of CLD spreading, which was characterized by a rapid increase in CLD levels, followed by a second phase when the CLD content diminished at different rates as a function of the soil type (Figure 1). The changes of CLD content in the subsurface layer depended on the soil type: a continuous increase for andosols (Figure 1a, b) and an increase followed by a decrease for ferralsols and nitisols (Figure 1c–f). The slight temporal fall in CLD levels in the topsoil of andosol 1 (Figure 1a), nitisol 1 (Figure 1e) and nitisol 2 (Figure 1f) during the late 1970s reflected the non-application of CLD during two or three years within this period (Table 1). At the time of the maximum CLD content (e.g., 1987 for ferralsol 2 and nitisol 2, and 1993 for the other soils), the correlation between soil CLD stocks up to 0.6 m and the total CLD rate was small and not significant (i.e., R2 = 0.29, P < 0.27). Indeed, at that time soil CLD stocks represented 93% of the CLD applied in andosols, 77% in ferralsols and only 41% in nitisols, which indicates that a large quantity of CLD was lost by leaching below 0.6 m during the period of CLD spreading, and that CLD losses by leaching were markedly dependent on soil type.
During the 1973–1993 period, the rate of CLD leaching varied strongly between soil types: nitisols (average 1.6 kg ha-1 yr-1), ferralsols (0.7 kg ha-1 yr-1), and andosols (0.2 kg ha-1 yr-1) (Figure 2). Differences in CLD content and leaching between soil types can be explained by differences in KOC and SOC stocks, which were the highest in andosols (Table 1) inducing greater CLD sorption and longer residence time in the solid phase of the soil [3]. Cabidoche et al. (2009) had observed that KOC may differ markedly between soils of different types but with similar SOC stocks. This is due to the influence of the different mineralogy of volcanic soils on chlordecone sorption [3]. This was subsequently confirmed by Fernández-Bayo et al. (2013) in a laboratory study [20]. This is particularly true in andosols where the allophane microstructure favors CLD and SOC sequestration [26], thus reducing CLD desorption [27] and SOC mineralization [16]. It is interesting to note that rainfall levels were not the principal factor affecting CLD leaching during the first phase. For example, although CLD leaching was 3.6 times higher for nitisol 1 than for andosol 1 (Figure 2a, e), rainfall was 2.5 times lower for the former (Table 1). Indeed, the high rates of CLD leaching during the 1972–1993 period contributed to the high pollution of rivers, groundwater and crops, as revealed by surveys carried out by the French Department of Health of Martinique in the early 2000s [18].
Figure 1 shows that the CLD content in topsoil declined rapidly over the five years after the last application (i.e., until the late 1990s), which was due to both a lack of CLD input and the effects of forced drainage induced by stemflow. During that period, the rate of CLD leaching was relatively high, after which it fell sharply (Figure 2). Because the negative balance between CLD inputs and outputs was less for the subsurface layer of ferralsols and nitisols, the CLD content in these soils was gradually higher in that layer than in the topsoil (Figure 1c–f). For andosols, the balance for the subsurface layer was positive but CLD contents were always higher in the topsoil (Figure 1a, b). Once again, this was linked to the greater CLD retention in the topsoil of andosols that limited downwards CLD transfer. This implies that the proposal made by Cabidoche et al. (2009) [3] concerning long-term CLD pollution of the topsoil of andosols is also applicable to their subsurface layers. The levels of CLD contents and stocks estimated during the present study for the different soil types were close to the experimental data obtained by several authors between 2001 and 2010 [3,11,28] and the data in a GIS database including more recent CLD measurements [29]. In particular, the GIS database shows a regular decrease in CLD stocks in soil from the early 2000s, which is more pronounced for nitisols and ferralsols than for andosols. Moreover, CLD content in some nitisols in the late 2010s is only slightly higher than the threshold of 1 mg CLD kg-1 established by local authorities.
The rates of CLD leaching over the 2020–2040 period differed markedly from those mentioned above for 1973–1993 and decreased in the order: ferralsols (average 0.24 kg ha-1 yr-1) > andosols (0.16 kg ha-1 yr-1) > nitisols (0.08 kg ha-1 yr-1). In other words, although nitisols were the major source of environmental CLD pollution during the period of spreading, at present the main sources would be ferralsols followed by andosols. Indeed, this is linked to CLD stocks remaining in soils after the period of the highest CLD losses. In this sense, Table 2 shows that in 2045, at the end of the period simulated, CLD stocks will account for < 1% of the total CLD applied in nitisols, 22% in ferralsols and 70% in andosols. At some sites affected by polluted soils, the shallow water table fluctuates between 0.6 and 3.4 m depending on the soil type and rainfall levels, and appears to be the principal contributor to stream contamination [30]. For this reason our calculations of CLD stocks focused only on the first 0.6 m of soils.
3.2. Impact of natural degradation on CLD losses
The inclusion of an effect of CLD degradation in the model had little effect on the general pattern of soil CLD dynamics described above. Throughout the simulated period, CLD degradation averaged 3 kg CLD ha-1 for andosols, 2 kg CLD ha-1 for ferralsols and 1 kg CLD ha-1 for nitisols. These values represented 7% of total applied amount of CLD for andosols, 4% for ferralsols and 1% for nitisols (Figure 3). It is clear that in both absolute and relative terms, CLD degradation was dependent on the residence time of CLD in soils, which is directly associated to the sorption capacity of each soil type (e.g., andosols > ferralsols > nitisols). Total CLD leaching at the end of the simulated period only decreased slightly when compared to the results obtained without CLD degradation: 4% for andosols, 3% for ferralsols and 1% for nitisols (data not shown). CLD degradation therefore appears to be sufficient to induce the presence of transformation products in surface water and groundwater [10], but it is insufficient to markedly modify soil CLD stocks. As a consequence, when estimated considering CLD degradation, the temporal patterns of CLD content and leaching were similar to those presented in Figures 1 and 2 for the simulations excluding degradation (data not shown). For andosols in French Antilles, Woignier et al. (2019) reported that allophane microporosity can strongly limit the ability of microorganisms to decompose sequestrated CLD because of mechanical constraints and poor transport properties [27]. It is thus possible that the CLD degradation in andosols calculated during our study overestimated the true degradation in these soils. In the remainder of this paper we will focus on the results obtained excluding CLD degradation.
3.3. Relationship between CLD dynamics and the critical thresholds of CLD content
The CLD content in topsoil was equal to the critical threshold of 1 mg CLD kg-1 in 1993 for nitisol 2, in 2005 for nitisol 1 and in 2036 for ferralsol 2 (Figure 1). At these dates, CLD content in the subsurface layer were 1.8 mg CLD kg-1 for nitisol 2, 2.1 mg CLD kg-1 for nitisol 1, and 1.5 mg CLD kg-1 for ferralsol 2. The earlier date observed for nitisol 2 reflects its low rate of CLD spreading and the fact that it was last applied in 1987 (Table 1). The CLD content in the topsoil of both andosols and ferralsol 1 did not reach that threshold within the simulated period (Figure 1). Only nitisols reached the second threshold at 0.1 mg CLD kg-1 in topsoil (i.e., in 2016 for nitisol 2 and in 2030 for nitisol 1; Figure 1). Some studies carried out in Guadeloupe have shown that the roots of annual crops such as tropical maize can reach a depth of 0.5 m [21]. In addition, it is well known that vegetables such as cucumber, watermelon and pumpkin have a deep rooting system that can reach 0.6 m [14]. These crops are currently banned in soils with > 1 mg CLD kg-1 in the 0–0.3 m layer [5]. On the other hand, studies performed in French Antilles to assess crop CLD contamination in polluted soils were carried out in the field or under greenhouse conditions using homogenized soils [6,12]. During these studies, only the topsoil was analyzed for CLD content so that any potential contribution of the subsurface layer to crop contamination remained unknown. Our results suggest that the subsurface layer could contribute to attaining crop CLD contents that exceed the MRL when vegetables with deep root systems are cultivated in nitisols and ferralsols just after the topsoil reaches the threshold of 1 mg CLD kg-1. Indeed, further research is necessary to determine the actual CLD content in the subsurface layer of these soils and establish the effects of this layer on crop contamination in the field.
Clostre et al (2014) observed that deeper tillage (i.e., > 0.4 m in their study) causes homogenization and dilution of the CLD content in the soil profile, which reduces the differences between the topsoil and subsurface layers [13]. Soil tillage in the more intensive banana systems in French Antilles includes subsoiling at ≥0.4 m [31]. Unlike deep plowing and deep mixing, subsoiling aims to reduce soil compaction without turning or mixing soil horizons [32]. Although some parts of the bottom of the topsoil and the top of the subsurface layer may be partially mixed, the precise mixed fraction in each layer is hard to estimate. Therefore, although it is clear that deeper tillage may induce mechanical dilution of CLD and high CLD content in the subsurface layer, as observed by Clostre et al. (2014) [13], such an effect cannot be estimated accurately from the data currently available on the effects of subsoiling. This information could be obtained during future research by estimating the fraction of the mixed layers from data on the CLD and SOC contents before and after subsoiling in soils that differ in terms of their mineralogy and structure.
3.4. Impact of changes of the cropping systems on CLD leaching
As described above, during the first step of this analysis we tested the impact of changes of the cropping systems as from the year after the CLD content was < 1mg CLD kg-1 in the topsoil layer; this concerned three soils: nitisol 1 from 2006, nitisol 2 from 1994, and ferralsol 2 from 2037. As reported in previous studies performed in French Antilles [15,16], a change in the cropping system may strongly affect SOC stocks, which could modify the sorption properties of the soil and then CLD leaching. The results showed that SOC stocks remained constant during the period under banana monoculture (Figure 4a), thus reflecting that this system is at the steady-state in terms of SOC stocks in French Antilles [15]. This is associated to the fact that C outputs (mineralization) and C inputs (crop residues) converge in the long-term under the same system management (e.g., more than five decades for banana systems in French Antilles) [3,10,15]. Following the change of cropping system, SOC stocks in the topsoil under vegetable crops fell by 1% yr-1 on average. This was in line with the data observed in Guadeloupe and reported by Sierra et al. (2017) for monocultures of vegetables when organic amendments were not applied by farmers [16]. Because C inputs and outputs were the same in both nitisols (Table S1 and S2), their SOC stocks converged towards the same new equilibrium at around 36 Mg C ha-1 (Figure 4a). High SOC losses under vegetables crops are mainly caused by the high intensity of soil tillage (e.g., up to six tillage operations per year) that enhances SOC mineralization [16]. The ktill parameter in Eq 5 reflects this effect, which is about double with vegetables than with banana systems where tillage is only applied every 5 years [15] (Table S2).
Despite the relatively large fall in SOC stocks under vegetable crops, affecting the sorption properties of the soils, its impact on CLD content and leaching was negligible (data not shown). For example, total CLD leaching at the end of the simulated period rose less than 1% in the three soils when compared to the values obtained with banana monoculture and presented in Table 2. Thus the data presented in Figures 1 and 2 for these soils were not substantially modified by the change of cropping system when CLD content in the topsoil reached the threshold of 1 mg kg-1. Indeed, at that time, CLD stocks were already too small to further affect CLD dynamics and leaching. From these results, it therefore appears that the effect of changing the cropping system when only the topsoil reached the threshold might be more important in terms of crop contamination than environmental pollution.
In the second step of this analysis we fixed the change of cropping system in 1993 following the financial crisis experienced by the banana sector. Figure 4b shows that the fall in SOC stocks under vegetable crops was relatively marked in all soils. At the end of the simulated period, SOC losses averaged 32% of the initial SOC stocks. As an index of the effect of SOC changes on CLD dynamics Figure 4c presents the increase in total CLD leaching compared to those estimated under banana monoculture (i.e., Table 2). On average, total leaching increased by 6% in andosols, 5% in ferralsols and 0.1% in nitisols. This increase was negligible in nitisols because their sorption capacity is too small to be further affected by a gradual decline in SOC stocks under vegetable crops. By contrast, the increase in CLD leaching was more notable in andosols and ferralsols with a relatively high sorption capacity and CLD stocks at the time of the change in the cropping system. In these cases, a reduction of CLD sorption through the decrease in SOC enhanced CLD release and leaching. For this reason, the increase in CLD leaching was the highest for andosol 1 (Figure 4c) which had the highest SOC and KOC values (Table 1). These results suggest that the early substitution of banana systems by vegetable crops following the financial crisis might have contributed to increasing environmental pollution and the risk of crop contamination during the past two decades.
Although the partial replacement of banana by vegetables operated in 1993 mainly involved smallholder farmers [17], the land area cultivated with vegetables and food crops on polluted soil has not yet been fully identified. This is a strategic priority for local authorities [4]. Undoubtedly, to perform CLD analyses on each plot in the territory would be a very long and expensive operation. In a recent study, Rochette et al. (2020) proposed a method for the demarcation of CLD-polluted areas based on surface water analyses and the delimitation of hydrological units at the watershed and sub-watershed scales [29]. Such an approach might be helpful to identify plots that should be targeted as a priority during soil testing campaigns, which should also include an analysis of the subsurface layer.
4.
Conclusion
Coupling the WISORCH model of CLD dynamics and the MorGwanik model accounting for SOC evolution enabled us to highlight the fact that a change of cropping system when the topsoil reaches the threshold for CLD content established by local authorities might increase the risk of crop contamination because of the contribution of the subsurface layer. Although the change in cropping system might not markedly impact CLD fluxes towards other environmental compartments at that time, the impact would much higher for vegetable cropping systems installed in the early 1990s following the financial crisis that affected the banana sector. Under these systems, SOC stocks decline progressively due to intensive soil tillage that reduces the sorption capacity of soils and increases CLD leaching. This would be particularly important for nitisols and ferralsols with a mineralogy inducing a low CLD sorption, which favors CLD leaching.
Our results indicate that in order to reduce the risk of crop contamination and environmental pollution, current soil testing campaigns should include CLD monitoring of not only the topsoil but also of the subsurface layer, paying special attention to temporal changes of SOC stocks in soils cultivated with vegetables. This implies that continuous long-term observations, rather that one-off sampling, are essential to test model predictions for different soil type × cropping system scenarios and improve the accuracy of decision tools at the regional scale. Meanwhile, until decontamination techniques become available, polluted soils should be managed carefully to prevent further CLD and transformation products leaching linked to changes in land use and CLD degradation. To achieve this, farming practices such as reduced soil tillage and the use of organic amendments should be promoted in order to maintain or increase SOC stocks and the sorption properties of polluted soils.
Acknowledgments
This study formed part of the TropEmis Project funded by the Reacctif Program of the French Agency for Ecological Transition (ADEME) (Grant 410-00159), the European Regional Development Fund (FEDER) (Grant 410-00160) and the Regional Council of Guadeloupe (Grant 410-00161). We would like to thank Victoria Hawken for reviewing the English manuscript.
Conflict of interest
The authors declare no conflicts of interest in this paper.