
Citation: Suhail Mahmud, Md Al Masum Bhuiyan, Nusrat Sarmin, Sanjida Elahee. Study of wind speed and relative humidity using stochastic technique in a semi-arid climate region[J]. AIMS Environmental Science, 2020, 7(2): 156-173. doi: 10.3934/environsci.2020010
[1] | Alexander D. Smirnov . Sigmoidal dynamics of macro-financial leverage. Quantitative Finance and Economics, 2023, 7(1): 147-164. doi: 10.3934/QFE.2023008 |
[2] | Ick Jin . Systematic ESG risk and hedge fund. Quantitative Finance and Economics, 2024, 8(2): 387-409. doi: 10.3934/QFE.2024015 |
[3] | Cemile Özgür, Vedat Sarıkovanlık . An application of Regular Vine copula in portfolio risk forecasting: evidence from Istanbul stock exchange. Quantitative Finance and Economics, 2021, 5(3): 452-470. doi: 10.3934/QFE.2021020 |
[4] | Conrado Diego García-Gómez, Mehmet Huseyin Bilgin, Ender Demir, José María Díez-Esteban . Leverage and performance: the case of the U.S. hospitality industry. Quantitative Finance and Economics, 2021, 5(2): 228-246. doi: 10.3934/QFE.2021010 |
[5] | Abdulsalam Abidemi Sikiru, Afees A. Salisu . Hedging with financial innovations in the Asia-Pacific markets during the COVID-19 pandemic: the role of precious metals. Quantitative Finance and Economics, 2021, 5(2): 352-372. doi: 10.3934/QFE.2021016 |
[6] | Antonio Gledson de Carvalho, Pinheiro Roberto, Sampaio Joelson . Venture capital backing: financial policies and persistence over time. Quantitative Finance and Economics, 2021, 5(4): 640-663. doi: 10.3934/QFE.2021029 |
[7] | Tchai Tavor . Uber's impact on Asia Pacific industries: An examination of strategic initiatives and market dynamics. Quantitative Finance and Economics, 2024, 8(3): 610-634. doi: 10.3934/QFE.2024023 |
[8] | Akash Deep . Advanced financial market forecasting: integrating Monte Carlo simulations with ensemble Machine Learning models. Quantitative Finance and Economics, 2024, 8(2): 286-314. doi: 10.3934/QFE.2024011 |
[9] | Stephen L. Lenkey . The market impact of leveraged ETFs: A Survey of the literature. Quantitative Finance and Economics, 2024, 8(4): 815-840. doi: 10.3934/QFE.2024031 |
[10] | Gerasimos G. Rompotis . The impact of taxation on firm performance and risk: Evidence from Greece. Quantitative Finance and Economics, 2024, 8(1): 29-51. doi: 10.3934/QFE.2024002 |
Constant leverage certificates (CLCs), also called factor certificates, rolling turbos or factor turbos, are a relatively new type of investment product and popular mainly in Germany and Switzerland. The worldwide first issuer of CLCs was, to the best of my knowledge, Goldman Sachs. The bank introduced these certificates in 2004 in the German market. Today, there are more than 4 500 CLCs from 13 different issuers listed at Euwax, Europe's largest platform for exchange trading in securitized derivatives, and more than 2 000 CLCs listed at SIX Swiss Exchange. The outstanding volume in Germany varied between EUR 200 and 500 millions in the past years (Eusipa, 2019).
CLCs enable investors to achieve overproportional gains with constant leverage on a daily basis. For instance, a 1% daily increase of the price of the underlying asset results in a 1% times the leverage factor increase of the CLC. Due to the constant leverage, the product is relatively easy to understand for potential investors and appears to be an attractive investment opportunity when comparing it to other leveraged products. Given this product design, it seems intuitive that a long-term upward trend of the underlying results in a favorable development of the price of a CLC with a positive leverage factor. But owing to the literature on leveraged ETFs (see Section 3), which also have a constant leverage either on a daily or monthly basis, it is known that this expectation is not always met. There is a deviation between the long-term product return and the leveraged cumulative return of the underlying due to the effect of compounding, interest and issuer fees. But despite the similarity of the two investment products, it is questionable whether many of the results from the literature on leveraged ETFs can be transferred to CLCs because the leverage factor of leveraged ETFs (between -3 and 3) is typically much smaller than the leverage factor of CLCs (between -15 and 15). E.g., Figure 1 shows typical price paths of six random CLCs and their underlying assets. It is very striking that five of six products are close to a total loss. The last product (at the bottom left) has a slightly negative return despite the outstanding performance of its underlying. It seems that product prizes converge to zero in the long run even though the price development of the underlying is favorable. Such extreme price developments cannot be observed for leveraged ETFs.
This study provides a profound analysis of the most popular CLCs on the Swiss market, which helps investors, regulators and financial advisers not only to comprehend why such a large number of products suffers losses in the long run but to gain a thorough understanding of the risk and return characteristics of CLCs and other products with constant leverage. The analysis contains first an investigation of the relative importance of the different determinants on the deviation between the product return and the leveraged cumulative return of the underlying. Second, I present a theoretical model to explain the products' long-term return and its determinants. It assumes a continuous stochastic process for the underlying asset. A similar model was developed for leveraged ETFs (see Avellaneda and Zhang, 2010; Giese, 2010; Jarrow, 2010) but it did not include a financing spread and a short selling fee, which are often charged by issuers of CLCs. In view of the large leverage factors, this study also conducts a more elaborate model validation using different simulation approaches with constant and time-varying volatility and empirical data. Finally, the distribution of returns over varying holding periods is analyzed. For this purpose, I show the theoretical distribution based on the aforementioned model and compare it with the empirical return distribution.
The reminder of this chapter is structured as follows. Section 2 includes a detailed specification of CLCs, followed by an illustration of the products' hedging and pricing and the compounding effect. In Section 3, related studies are reviewed. Then, I present the research design and data. Section 6 contains the analysis of the return deviation. The model of the return generating process and its validation is treated in Section 7. Subsequently, the return distribution is investigated. The last section concludes.
CLCs are unsecured bonds and thus potentially affected by the default of their issuer. They enable investors to participate disproportionately in price changes of the underlying asset with a constant leverage on a daily basis. A daily price increase of the underlying of x% results in a price increase of the CLC before interest and issuer fees of x% multiplied by the product's constant leverage factor. Products with positive leverage factors are referred to as "long" CLCs, while products with negative leverage factors are labeled as "short" CLCs. Products with a leverage factor greater than or equal to −1 and less than or equal to 1 are not classified as CLCs. (Products with a leverage factor equal to −1 or 1 are known as tracker certificates.) Issuers of CLCs typically use integers from −15 to −3 and from 3 to 15 as leverage factor. The price computation is based on daily closing prices of the underlying asset. There is a large variety of underlyings available, including currency exchange rates, commodities and futures. Stocks and stock indices, however, are most widely used.
The products can be bought through an exchange or over-the-counter. They have a potentially endless lifetime. However, as usually specified in term sheets, issuers have a right of termination. Investors, on the other hand, have an exercise right but can sell the products also through the exchange. Market making is usually handled by the issuers themselves to ensure the products' liquidity.
Due to the partially very high leverage, there is a substantial risk that the product price drops to zero. With a leverage factor of λ, a price increase or decrease of the underlying of −1λ⋅100% would result in a total loss. In order to prevent this, the products are adjusted over the course of the day to reduce the exposure to the underlying if the price of the underlying hits, undercuts (long CLC) or exceeds (short CLC) a predefined, one-sided barrier. The barrier is typically variable and defined as a percentage of the last closing price of the underlying. The percentage is set between 100% and the closest possible boundary to a total loss of λ−1λ⋅100%. The specific adjustment approach to a barrier hit differs from issuer to issuer.
The most common approach is an intraday intervention, where a new trading day is simulated whenever the underlying hits the barrier. The following example illustrates this approach. Assume a long CLC with a leverage factor of 5 and a barrier of 85%. If the price of the underlying drops from 100 to 85 (−15%) before the end of the day, the price of the CLC will drop by −15%⋅5=−75% and a new (hypothetical) closing price of the underlying will be set to 85. If the price of the underlying then drops by another −10% to 76.5 until the end of the day, the price of the CLC will drop by another −50%. In that case, the cumulative return of the product amounts to (1−75%)(1−50%)−1=−87.5%. Without any intervention over the course of the day, the return would amount to 5⋅(76.5%−1)=−117.5%.
Due to potentially large price jumps, e.g., overnight jumps or temporary illiquidity of the underlying, the theoretical value of CLCs can drop below zero despite the products' embedded adjustment mechanism. In that case, the investors would suffer a total loss of the investment but would not need to make an additional payment to cover the negative product value. If in the above example the price of the underlying immediately jumped from 100 to 76.5 without any possibility for the issuer to apply an intraday adjustment, the investor would lose no more than the investment amount. The risk of negative values resulting from large price jumps of the underlying is taken by the issuers, i.e., the issuer would need to bear the outstanding loss of 17.5% itself. However, issuers usually set the barrier such that the (absolute) difference between the barrier and the total loss boundary is large enough to avoid this risk or at least to keep it small.
CLCs can be hedged with a position in the underlying asset, debt (long CLC) and a deposit with the issuer (short CLC). To ensure a leveraged return of λ times the return of the underlying, the position in the underlying needs to correspond λ times the investment amount or the current product price, respectively. Accordingly, a long CLC can be mimicked with an investment in the underlying asset where a share of 1/λ is financed with the cash contribution of the investor and a share of (λ−1)/λ is financed with debt. On the other hand, a short CLC can be reconstructed with an investment in a risk-free asset where a share of −1/λ is financed with cash and a share of (λ−1)/λ with the proceeds from the short sale of the underlying. These ratios have to be satisfied at the end of each day to provide a constant leverage on a daily basis. For this reason, the hedge portfolio needs to be rebalanced daily.
In addition, there is a need for rebalancing when the price of the underlying hits the barrier. Whenever this happens, following the most common adjustment approach, the exposure to the underlying can be reduced such that the position in the underlying corresponds to λ times the current product price again. As indicated above, the hedging strategy can fail if the price of the underlying changes discontinuously and crosses the barrier with a large jump such that the product value would theoretically fall below zero.
Due to the debt component or deposit, the return of CLCs does not fully correspond to the leveraged daily return of the underlying. It has to be adapted by subtracting (long CLC) or adding up (short CLC) the interest incurred during the day. The interest can be computed by multiplying the debt/deposit amount CLCt(λ−1) with the daily interest rate rtΔt, where CLCt is the product's last closing price, rt is the current interest rate and Δt corresponds to one trading day. This allows us to compute the price of a CLC at time t+1 as
CLCt+1=CLCt[1+λΔSt+1+τDt+1St−(λ−1)rtΔt] | (1) |
The term in the squared bracket corresponds to the product's return, where the leveraged return of the underlying (including the tax-adjusted dividend payment τDt+1) is reduced or augmented by the interest component. The interest component reduces the product's return if both λ and rt are positive or negative. In contrast, the product's return is augmented if only one of the variables is positive and the other negative.
Since Equation (1) leaves no room for profit, issuers apply a slightly modified price-setting formula, which typically incorporates an index fee, a financing spread for long certificates and a short sale fee (or "short rate") for short certificates. The generalized equation
CLCt+1=CLCt[1+λΔSt+1+τDt+1St−[(λ−1)(rt+fSPt)−λfSRt+fI]Δt] | (2) |
with fSPt being the financing spread, fSRt being the short rate and fI being the index fee, captures most of the price-setting formulas published by issuers for long and short certificates with an index or stock as underlying. Note that I implicitly assume that fSPt=0 if λ<0 and fSRt=0 if λ>0. Both fSPt and fSRt can vary over time, while fI is constant. Depending on the currency of the underlying, issuers typically use the Eonia, the Libor or similar as interest rate.
A similar pricing formula is also applied to leveraged ETFs (see Avellaneda and Zhang, 2010; Giese, 2010; Jarrow, 2010), , which have a related product design (see Section 3). However, issuer fees for leveraged ETFs are mostly ignored in the literature. Avellaneda and Zhang (2010) consider a cost component that is equivalent to fI and corresponds to the funds' expense ratio. Additional cost components for CLCs (fSPt and fSRt) are included to better mimic the price-setting formulas of issuers, which explicitly indicate such fees that also depend on the leverage factor.
The price-setting formula is often published in term sheets or similar documents. However, even though most of the issuers communicate the formula openly, it is often not apparent at first sight whether a specific CLC is attractive compared to other CLCs with similar characteristics, since the notation and structure of the published formulas can differ widely between issuers, asset classes of the underlying and for long and short certificates. Due to the complex and unequal structure of the formulas and the use of many variables and parameters, investors might find it difficult to understand the price setting of these products.
The price-setting formula provided by issuers, along with daily returns of the underlying assets, allows for a calculation of the products' daily returns. However, it remains unclear how the returns of these products over a period of multiple days are related to the cumulative returns of the underlying assets. A naive expectation could be that the return of the products will equal the leveraged return of the underlying also for periods longer than one trading day. As illustrated with several examples of price paths in Section 1, this expectation is not met. CLCs do not reproduce the corresponding leveraged return of the underlying asset over a time period of multiple days.
This return deviation cannot be explained solely with issuer fees and interest; the main reason for the deviation is compounding. This effect is already well-known in connection with fixed income investments, where it leads to an exponential increase in wealth if the earnings from the investment are reinvested. In a broader context, the compounding effect refers to the process of generating or reducing earnings or losses on an asset's previous earnings or losses. While fixed income investments are positively affected by compounding, this is not necessarily the case for CLCs, as I illustrate in the following example. Consider a product with a leverage factor of 5 and assume that the price of the underlying and the price of the product equal 100 at the beginning of the investment period and the risk-free interest and issuer fees equal zero. If the price of the underlying increases to 110 (+10%) on the next day and declines to 100 (−9.09%) on the subsequent day, the price of the product would augment to 150 (10%⋅5=50%) on the first day and drop to 81.82 (−9.09%⋅5=−45.45%) on the second day. The product lost −18.18% in total even though the underlying has a cumulative return of 0%. This return deviation is caused solely by compounding.
In general, the return deviation due to compounding can be determined by subtracting the leveraged cumulative return of the underlying from the target return, which I define as the cumulative product return excluding issuer fees and interest. The target return after two days is calculated as
rT0,2=(1+rT0,1)(1+rT1,2)−1=(1+λrS0,1)(1+λrS1,2)−1 | (3) |
where rSt,t+1 is the return of the underlying in the time period from t to t+1. On the other hand, the leveraged cumulative return of the underlying can be expressed as
rN0,2=λrS0,2=λ[(1+rS0,1)(1+rS1,2)−1] | (4) |
Note that the leveraged cumulative return is purely generic and fictitious. It is calculated by applying the leverage factor to the cumulative return of the underlying. By subtracting Equation (4) from Equation (3), I obtain
rT0,2−rN0,2=[(1+λrS0,1)(1+λrS1,2)−1]−λ[(1+rS0,1)(1+rS1,2)−1]=(λ2−λ)rS0,1rS1,2 | (5) |
A positive (negative) return deviation can be interpreted as a favorable (unfavorable) impact of compounding for the holder of the CLC. As Equation (5) shows, compounding is favorable if rS0,1 and rS1,2 are both either positive or negative. The return deviation is further boosted by extreme values for λ, given that none of the values rS0,1 and rS1,2 is zero.
The return deviation after a holding period of more than two days can be derived similarly. However, the results and their interpretation become increasingly complex. Nonetheless, it can be concluded that large fluctuations in the price of the underlying negatively affect the product price in the long run. The compounding effect is favorable in periods of monotonically increasing or decreasing prices and unfavorable in periods of high volatility.*
*However, a favorable impact of the compounding effect on the performance of a CLC does not imply that the CLC achieved a positive (cumulative) return and vice versa. E.g., if the price of the underlying decreases monotonically, the compounding effect is favorable because it decelerates the price drop. Nonetheless, the return of the product is negative.
Another implication of the compounding effect is that the cumulative return of the underlying is not sufficient to determine the price of a CLC after a holding period of multiple days. As is apparent from Equation (5), the series of daily returns that occurred during the investment period are required as well.† For this reason, CLCs are path-dependent and cannot be illustrated in the common payoff diagram for structured products. Nevertheless, this is often done in practice, showing the product price as a simple linear function of the price of the underlying, which can potentially mislead investors and result in inaccurate expectations.
†As I show in Section 7, the price of a CLC can be approximately determined with the realized variance of the underlying as input parameter instead of daily returns.
While there are, to my best knowledge, no scientific publications on CLCs, different studies with similar research objectives have been conducted on related products. E.g., leveraged ETFs are very similar to CLCs as they also incorporate the idea of tracking an underlying asset with constant leverage (either on a daily or a monthly basis) and thus have similar return dynamics.
Avellaneda and Zhang (2010), Giese (2010) and Jarrow (2010) were the first to study the implications of periodical rebalancing on the long-term risk and return characteristics of leveraged ETFs using a mathematical framework. The authors independently derived a model to describe the return of a leveraged ETF over any holding period as a function of the return of the underlying. Assuming that the underlying follows a geometric Brownian motion and that the portfolio is rebalanced continuously, the long-term return of leveraged ETFs can be calculated exactly. They found that the logarithmic return of leveraged ETFs basically corresponds to the logarithmic return of the underlying multiplied by the leverage factor minus a discount, which depends on the realized variance of the underlying, the expense ratio of the fund, the interest rate and the short rate. The validity of the model was tested by Avellaneda and Zhang (2010) and Giannetti (2017), which both found a high degree of conformity with empirical data at least for long leveraged ETFs. Giese (2010) also analyzed the profit and loss probability distribution derived from the model. He found that the skewness is increasing with the leverage factor, the volatility of the underlying and the holding period. For very large values of these three parameters, the loss probability tends to one even though the expected return tends to infinity.
Next to the above-mentioned rather theoretical studies, a lot of research has been conducted on the empirical performance of leveraged ETFs. Murphy and Wright (2010) analyzed commodity-based leveraged ETFs and found that they are able to track the leveraged underlying return on a daily basis. However, there were relatively large return deviations between the actual return of leveraged ETFs from the leveraged cumulative return of their underlyings over long-term investment horizons. Two thirds of the funds were negatively affected by compounding over their life time of two to three years. More than 80% of the funds underperformed their underlying. Charupat and Miu (2011) and Lu et al. (2009) confirmed that the return of leveraged ETFs is not significantly different from the leveraged return of their underlyings over holding periods less than one month, but the return deviation can be significant over longer investment horizons.
Tang and Xu (2013) studied the determinants of the return deviation. They split the return deviation into a compounding and a noncompounding component and found that the compounding and noncompounding deviations both increase with longer holding periods and that the noncompounding deviation was at least as important as the compounding deviation with an investment period of up to 40 days. They further split the noncompounding deviation into two additional components. The first component is the deviation between the funds' closing prices and net asset values, for which they found the Libor to be the key driver. The second component is a residual deviation, which is mainly affected by the return of the underlying. The expense ratio of the leveraged ETFs as reported by Tang and Xu (2013) ranges between 0.91% and 0.95% excluding variable costs.
Loviscek et al. (2014) and Bansal and Marshall (2015) analyzed the long-term performance of hypothetical leveraged ETFs with different leverage factors and rebalancing frequencies using a simulation approach. The returns of the funds were calculated based on real-world data, starting with the inception of the DJIA in 1896 and the inception of the S&P 500 in 1964 respectively. Both studies found a positive return deviation also for holding periods of one year or longer and concluded that compounding does not negatively impact buy-and-hold investors. These findings are contradictory to prior research. The authors argued that the other empirical studies were done a few years after the inception of leveraged ETFs, which was a period of high market volatility associated with the financial crisis, resulting in a negative impact of compounding. To explain the discrepancy from the theoretical studies, Loviscek et al. (2014) showed that the distribution of real-world returns is—as opposed to the assumed distribution in the theoretical models of Avellaneda and Zhang (2010), Giese (2010) and Jarrow (2010)—not normal but much more leptokurtic. The higher density of the distribution around the positive mean results in a positive impact of compounding. They also argued that the incorporation of management fees does not change the main conclusion of their paper because the fee-adjusted cumulative returns of leveraged ETFs are still higher than the leveraged cumulative return of the underlying.
Another related investment product are endless leverage certificates (ELCs), sometimes also referred to as mini futures or open-end turbos. Similar to CLCs, ELCs are (potentially) open-ended and designed to gain a leveraged return due to low capital investment. The main difference is that the return of ELCs is not constant on a daily basis but corresponds to the leveraged long-term return of the underlying (before interest and issuer fees). ELCs and similar leveraged certificates were studied, e.g., by Entrop et al. (2009), Rossetto and Van Bommel (2009) and Harčariková and Bobriková (2019).
The objective of my study is to provide a thorough analysis of risk and return of CLCs with three different approaches. The first approach in Section 6 is about the return deviation between the products' effective returns and the leveraged cumulative returns of the underlyings. In particular, I examine whether there is indeed a deviation to the disadvantage of investors on average based on historical data. The second question addressed in the first approach is to what extent different determinants contribute to this deviation. As illustrated in Section 2.3, the most striking determinant is compounding. The other components of the return deviation are interest and issuer fees. The price-setting formula allows for an individual investigation of the impact of these three components of the return deviation. Furthermore, the return deviation and its components are analyzed for varying holding periods and leverage factors.
In the second approach in Section 7, a general model is derived that explains the long-term return of CLCs as a function of the cumulative return of the underlying and other variables. The model is based on the groundwork of Avellaneda and Zhang (2010), Giese (2010) and Jarrow (2010) on leveraged ETFs but is adapted due to additional components in the pricing formula of CLCs. The main assumptions are that rebalancing takes place continuously and that the price of the underlying follows a geometric Brownian motion.
Since these assumptions might be unrealistic in practice, the model is tested using different methods. The first test reveals whether the assumption of continuous rebalancing leads to inaccurate model predictions. The test is carried out by calculating discrete, daily returns of the underlying assets using a geometric Brownian motion with constant volatility. The drift and volatility terms of the geometric Brownian motion correspond to the mean daily return of the underlying and its volatility in the period from the product's issuance to the end of the investigation period. The second test checks the geometric Brownian motion assumption by introducing time-varying volatility using a generalized autoregressive conditional heteroscedasticity (GARCH) model. This approach results in heavier tails in the return distribution, which are characteristic of real-world stock returns. The closest approximation to reality is, however, achieved with the last test, which is carried out with historical returns of the underlying.
All tests undergo a regression analysis with the same regression models. These regression models basically correspond to the theoretical model with different terms being grouped and assigned to a regression coefficient. The last regression model measures the model error relative to the cumulative return of the products. The regressions are performed for different investment horizons. Since in my simulations the drift and volatility terms of the geometric Brownian motion correspond to the historical mean daily return of the underlying and its volatility in the period from the product's issuance to the end of the investigation period, a better comparability of the results from the simulations and empirical analysis is ensured.
The third approach in Section 8 addresses the question of the shape of the return distribution of CLCs. The distribution is first analyzed theoretically under the same assumptions as in the return model. To verify whether the theoretical distribution applies in practice, it is compared to historical return distribution. Since the effect of compounding on the return of the certificates can vary for different investment horizons, the return distribution after multiple holding periods is analyzed. For this purpose, the period from the issuance of the individual products to the end of the sample period is divided into non-overlapping intervals.
To conduct my analysis, I received daily closing prices of CLCs from the Swiss exchange. But while there is a huge variety of CLCs on the Swiss exchange, the trading frequency of individual products is rather low compared to other asset classes. Most of the products are not traded every day and, as a result, the data is incomplete. Also, if price information is available on a particular day, it is still unclear whether the close price reflects the product value at the end of the day, since the close price corresponds to the last price traded. Given the low trading frequency of CLCs, the last trade could be made hours before the end of the trading time when the product had a much different value (CLCs with high leverage in particular).
For this reason, the daily closing prices of CLCs used in all three approaches are calculated based on the price-setting formula provided by the issuers (see Equation (2)).‡ Prices of underlying assets required for the calculation are retrieved from Thomson Reuters Eikon. The returns of the underlying assets are based on the total return, where dividend payments are incorporated. The daily quotes of the reference interest rates are taken from different sources but mostly from the central bank of the respective currency. The other parameters required to calculate the product price, namely the leverage factor, the reference interest rate, the financing spread, the short rate and the index fee, were provided by the Swiss exchange or retrieved from the products' term sheets. Furthermore, I do not capture the currency mismatch between the underlying and product, i.e., product prices are calculated as if they were issued in the currency of the underlying. This allows us to abstract from noise in the calculation of (the determinants of) the return deviation. Finally, for the sake of simplicity, products are excluded from the sample if the close price of the underlying is below the barrier level at any point of time during the investigation period. A correct implementation of the intraday adjustment approach in case of barrier events would require to monitor the intraday price development of the underlying assets.
‡ A similar approach was applied by Entrop et al. (2009) for ELCs.
The calculation of product prices based on the price-setting formula has two limitations. First, in term sheets of some products it can be found that the financing spread and short rate may change over time without further specification of the time of the change or the new amount of the fee. In my analysis, I assume a constant financing spread and short rate corresponding to the amount at issuance of the product. Second, the tax rate is often not clearly communicated by issuers. In some term sheets, it is mentioned that a tax-adjusted dividend is added to the return without specifying the tax rate. In other term sheets, the tax rate at issuance is specified, but issuers reserve the right to change it at any time during the product's lifetime. Consequently, I assume a dividend tax rate of 0%, which is implicitly applied by using the total return of the underlying assets. These limitations could be avoided by using prices from exchanges. However, the trading frequency problem related to using these prices is much more important such that the application of calculated prices based on the price-setting formula is much more accurate.
This research study is based on CLCs issued in Switzerland. The investigation period starts at the beginning of 2013 and lasts until the end of 2017. I do not consider older data because the market for CLCs was very small at that time with only few products available. In 2013, the market emerged with 56 new CLCs issued by Commerzbank. The breakthrough came in 2014 with the market entry of Vontobel. 332 of these certificates were launched in that year.
In my analysis, only CLCs with an equity or index as underlying asset are considered. Products with futures, commodities, currencies or interest rates as underlying are excluded from the sample because they have a differing pricing formula, which would require a separate analysis, and the prices of these underlyings are often not available. Equities and indexes are also the most popular underlying assets for CLCs. Using data provided by the Swiss exchange, I further filter the most popular CLCs based on trading frequency, i.e., products are only included in the sample if they have at least 100 trades during the investigation period. The final sample consists of 339 CLCs.
Figure 2 gives an overview of the product characteristics of the sample. One third of the products was issued by Commerzbank and two thirds were issued by Vontobel. Long certificates, which account for 64% (218) of the sample, are more popular than short certificates. 76% of the long certificates have a leverage factor of either 4, 5 or 6. Among the short certificates, the leverage factors −4, −5 and −6 are most frequently chosen. Other popular leverage factors are 10 and −10. Almost all products are traded in CHF, with a few exceptions in EUR and USD. However, that does not apply to the underlying assets, where only 34% are listed in CHF. 43% of the underlying assets are traded in EUR and 19% are traded in USD. Other currencies in the sample are GBP, JPY and NOK. Equities account for 72% of the underlyings. However, the most popular single underlyings are indexes. DAX, DJIA, Euro Stoxx 50, Nasdaq 100 and S&P 500 are chosen most often and account for at least 3.2% each. The most frequent underlying equities are Swatch, UBS and Volkswagen with a share of 2.4% to 2.6%. The sample contains 94 different underlyings in total, none of which accounts for more than 5% of the sample. More detailed descriptive statistics are included in Supplementary.
The index fee varies from 0.7% to 1.5% with a mean of roughly 1%. The mean financing spread and short rate amount to 0.4% and 0.7% respectively and have relatively large fluctuations. The minimum value of both variables is 0.1%, while the maximum financing spread is 2.5% and the maximum short rate is 25%§. Commerzbank has a lower index fee than Vontobel on average (0.7% versus 1%). However, products issued by Commerzbank typically have a much higher financing spread (0.97% versus 0.14%) and short rate (1.06% versus 0.46%) than Vontobel products. Since the impact of the financing spread and short rate is amplified by the leverage factor, differences in the index fee play a less important role. From this perspective, Vontobel seems to have fairer conditions.¶ A table with further statistics on issuer fees can be found in Supplementary.
§The short rate of 25% is associated with a short certificate on the company Seadrill, which suffered a massive price decline in the period from 2015 until 2017 when they filed for bankruptcy. The value is far above the short rate of any other product.
¶Note that this assessment is only indicative. The products of the two issuers cannot be directly compared to each other due to different underlyings, which may have differing borrowing and currency hedging costs.
I define the total return deviation, denoted by rE−N0,t, over an investment period of length t as the difference between the product's return rE0,t and the leveraged cumulative return of the underlying rN0,t as follows.
rE−N0,t=rE0,t−rN0,t | (6) |
Denote by rF0,t the return if no issuer fees would occur and by rT0,t the return if neither issuer fees nor interest would occur. Then, the total return deviation can be decomposed into three determinants according to
rE−N0,t=rE−F0,t+rF−T0,t+rT−N0,t | (7) |
withrE−F0,t=rE0,t−rF0,trF−T0,t=rF0,t−rT0,t,andrT−N0,t=rT0,t−rN0,t |
rE−F0,t is the return deviation due to issuer fees, rF−T0,t is the return deviation due to interest and rT−N0,t is the return deviation due to the compounding effect. The superscripts E, F, T and N stand for "effective return", "fair return", "target return" and "naively expected return". The latter term is coined by the literature on leveraged ETFs due to the naive expectation that the products' return corresponds to the leveraged return of the benchmark also for long-term investment periods, which some investors might have. The formulas are designed in a way that a negative (positive) sign of any return deviation component can also be interpreted as a negative (positive) impact of the respective component on the effective return. The different types of return are calculated as
rE0,t=CLCt−CLC0CLC0=t−1∏j=0[1+λΔSj+1+τDj+1Sj−((λ−1)(rj+fSPj)−λfSRj+fI)Δt]−1 | (8) |
rN0,t=λt−1∑j=0ΔSj+1+τDj+1S0 | (9) |
rT0,t=t−1∏j=0(1+λΔSj+1+τDj+1Sj)−1 | (10) |
andrF0,t=t−1∏j=0[1+λΔSj+1+τDj+1Sj−(λ−1)rjΔt]−1 | (11) |
These equations are, with the exception of rN0,t, based on the pricing formula in Equation (2).
The return deviation and its components, as defined in the previous section, are calculated for all CLCs in the sample and for different holding periods. An illustration of the main results is displayed in Figure 3. The figure shows mean values for the different return types and for the return deviation (components) over different holding periods. The mean values are displayed for the overall sample but also for sub-samples including only products with a specified leverage factor.
The mean effective return (rE0,t) of the overall sample over a holding period of one day is 0.1%. The mean return increases with a larger holding period. An investment over 365 days results in a mean return of 18.3%. Also, products with a large leverage factor perform better on average. For instance, products with a leverage factor of −10 have a mean return of −91.1%, while products with a leverage factor of 10 have a mean return of 167.3% after one year.||
||Even more extreme returns can be observed for products with a leverage factor of −15, −12, 12 or 15. However, the results for long holding periods may not be representative due to the small sample size.
The total return deviation (rE−N0,t) is negligible for very short investment periods. After 30 days the average of the overall sample amounts to −1.1% and increases to −20.4% for holding periods of one year. However, these values come along with a large standard deviation, which is 4 to 10 times larger than the mean. Also, when comparing the outcome between products with varying leverage, it is difficult to see a uniform picture. Most of the leverage levels are attended by a negative return deviation; however, no clear trend is apparent with increasing or decreasing leverage. The long-term return deviation and its large variance is mainly attributed to the effect of compounding (rT−N0,t), which is responsible for a return deduction of 17.4% over a holding period of one year. I conclude that the magnitude of the return deviation is boosted with increasing holding period or leverage factor mainly due to the compounding effect, but based on empirical data, it is difficult to determine whether compounding has a positive or negative impact on the product performance on average. In any case, these results suggest that the compounding deviation is much more important than the noncompounding deviation also for investment periods of only one month, which is inconsistent with the findings on leveraged ETFs (see Tang and Xu, 2013).
A clearer picture emerges from the analysis of the return deviation due to issuer fees (rE−F0,t). Its mean amounts to −3.2% after a holding period of one year for the overall sample. This value is far above the expense ratio of leveraged ETFs of around 0.95% (see Tang and Xu, 2013) but can be partially justified with the higher leverage in CLCs. Issuer fees seem to be high in particular for products with very high leverage. For instance, they account for a mean return deduction of 6.4% when holding CLCs with a leverage factor of 10 for one year. Since the short rate is amplified with an increasingly negative leverage, one could also expect increasing issuer fees for products with extreme negative leverage. However, this can only be confirmed for a holding period of up to 90 days. Due to the extremely poor long-term performance of these products, the product value virtually shrinks to zero such that the charged fees are relatively small compared to the initial investment amount. Hence, investors and issuers have aligned interests, as a well-performing product results in enhanced earnings for issuers.
It should also be pointed out that the return deviation due to issuer fees is possibly underestimated in our study. As indicated in Section 4, a constant financing spread and short rate corresponding to the amount at issuance of the product is assumed. It has been reported in many studies that issuers use their monopoly power in the secondary market for structured products to extract wealth from investors (Wilkens et al., 2003; Stoimenov and Wilkens, 2005; Ruf, 2011). For this reason, I except that these fees are rather increased than decreased during the products' life cycle. Unfortunately, it is not possible to address this limitation due to unavailable data on the development of issuer fees over time.
While increasing issuer fees always have a negative impact on the return, this is not necessarily the case for the interest component (rF−T0,t). During the investigation period, the interest level was exceptionally low. Depending on the currency of the underlying, the interest rate was slightly positive or negative. As a result, interest contributes to a minor fraction of the total return deviation and has the smallest impact compared to the other components in my results. The mean return deviation due to interest is 0.1% over a period of one year for the overall sample, which implies that the debt or deposit component in CLCs increases the products' return. Again, there is no uniform result among different leverage levels of long or short certificates, but the magnitude is enhanced with increasing holding period.
I assume that the underlying asset follows a geometric Brownian motion, i.e., the price of the underlying St satisfies the stochastic differential equation
dStSt=μdt+σdWt | (12) |
where μ is the return, σ is the return volatility and Wt is a standard Brownian motion. Ito's lemma gives the following solution.
dlnSt=(1StμSt−121St2σ2St2)dt+1StσStdWt=(μ−12σ2)dt+σdWt | (13) |
According to the pricing formula of CLCs given in Equation (2), the return of these products is defined as
dCLCtCLCt=λdStSt+[(1−λ)(rt+fSPt)+λfSRt−fI]dt | (14) |
Note that the dividend term is removed because I consider the return of the underlying dStSt as the total return including dividends in the subsequent analysis. Substituting dStSt according to Equation (12), I obtain
dCLCtCLCt=λμdt+λσdWt+[(1−λ)(rt+fSPt)+λfSRt−fI]dt=[λμ+(1−λ)(rt+fSPt)+λfSRt−fI]dt+λσdWt=˜μtdt+˜σdWt | (15) |
with˜μt=λμ+(1−λ)(rt+fSPt)+λfSRt−fIand˜σ=λσ |
The price process in Equation (15) is basically a geometric Brownian motion for the CLC with adapted values for the return and the volatility. By applying Itô's lemma, the following solution is obtained.
dlnCLCt=(˜μt−12˜σ2)dt+˜σdWt=[λμ+(1−λ)(rt+fSPt)+λfSRt−fI−12λ2σ2]dt+λσdWt | (16) |
I multiply Equation (13) by λ and subtract it from Equation (16) to obtain
dlnCLCt−λdlnSt=[λ−λ22σ2+(1−λ)(rt+fSPt)+λfSRt−fI]dt | (17) |
Considering the investment horizon [0,t], dt becomes t, dlnCLCt becomes lnCLCt−lnCLC0 and dlnSt becomes lnSt−lnS0. By rearranging Equation (17), I obtain the following formula for the product's cumulative logarithmic return in integral form.
lnCLCt−lnCLC0=λ(lnSt−lnS0)+λ−λ22σ2t+(1−λ)∫t0(rs+fSPs)ds+λ∫t0fSRsds−fIt | (18) |
This formula shows that the logarithmic return of CLCs over any investment horizon can be modeled as the logarithmic return of the underlying over the same period multiplied by the product's leverage factor, adjusted by a volatility term and other terms representing interest or issuer fees. As already highlighted in Section 2.3, volatility has a negative impact on the product's return irrespective of whether it is a long or short product, since for any λ larger than 1 or smaller than −1 the term λ−λ22 is negative. It is also apparent from the formula that a larger interest rate rs leads to a decreased (increased) return for long (short) certificates, while higher issuer fees generally decrease the return**.
**Remind that fSPs is zero for short certificates and fSRs is zero for long certificates.
A discrete-time cumulative logarithmic return corresponding to (18) could be written as
lnCLCt−lnCLC0≈λ(lnSt−lnS0)+λ−λ22σ2t+(1−λ)Δtn−1∑s=0(rs+fSPs)+λΔtn−1∑s=0fSRs−fIt | (19) |
where n corresponds to the length of the holding period in days. Δt is required to scale parameters to daily rates. The cumulative (non-logarithmic) return can be derived from Equation (19) as follows.
CLCtCLC0≈(StS0)λ⋅exp[λ−λ22σ2t+(1−λ)Δtn−1∑s=0(rs+fSPs)+λΔtn−1∑s=0fSRs−fIt] | (20) |
Equation (18) gives an exact relation between the return of a CLC and the return of its underlying. But since the products are not rebalanced continuously and the underlying might not be log-normally distributed, it is questionable whether the discretized version of the model in Equation (19) and Equation (20) is appropriate in practice. For this reason, its accuracy is tested in the following three subsections using different simulations and real-world data.
In the first simulation, I simulate daily returns of the underlying with a geometric Brownian motion and constant volatility. This simulation is in line with the assumptions of the theoretical model except that it takes account of the daily rebalancing frequency of CLCs. I use the historical mean and volatility of daily returns of the underlying assets from the issuance of the respective product to the end of the sample period for the parameters μ and σ of the geometric Brownian motion (see Equation (12)).
The accuracy of the return model is tested for holding periods of 5, 20,100 and 250 trading days. For each holding period and each product in the sample 100 simulation paths of the underlying asset and random values for the interest rate, financing spread, short rate and index fee out of a continuous uniform distribution are generated. The intervals of the uniform distributions have a width of multiple percentage points and are sufficiently large to ensure that the data has enough variability to test whether these terms are appropriately incorporated in the model.†† Based on these simulation paths, the randomly drawn numbers for the interest rate, financing spread, short rate and index fee, and the pricing formula of CLCs, I calculate the products' cumulative logarithmic return lnCLCt−lnCLC0 for each simulation path. These returns are then used as dependent variable in the subsequent regression analyses.
††Another possibility would be the application of real numbers for the interest rate, financing spread, short rate and index fee. However, this option proved to be less convenient for the subsequent regression analysis due to low variability of the data.
I apply three regression models to test the theoretical return model. The first regression model basically corresponds to the return model as stated in Equation (19) but with added regression coefficients. To check whether each variable of the model contributes to the cumulative return to the extent expected, a regression coefficient is assigned to each summand of the equation. The second regression model is similar. As in the first one, it includes a regression coefficient for the return of the underlying, but only one coefficient is assigned to the remainder of the equation, which is in the following referred to as "model intercept". I call it model intercept because if the return model in Equation (19) is seen as a function of the cumulative logarithmic return of the underlying, it corresponds to the vertical intercept of the model in case of lnSt−lnS0=0. Formally, the first two regression models are defined as:
lnCLCt−lnCLC0=β0+β1λ(lnSt−lnS0)+β2λ−λ22σ2t+β3(1−λ)Δtn−1∑s=0(rs)+β4(1−λ)Δtn∑s=0(fSPs)+β5λΔtn∑s(fSRs)−β6fIt+ϵ, | (I) |
lnCLCt−lnCLC0=β0+β1λ(lnSt−lnS0)+β2MI+ϵ, | (II) |
withMI=λ−λ22σ2t+(1−λ)Δtn−1∑s=0(rs+fSPs)+λΔtn−1∑s=0fSRs−fIt | (21) |
β0, β1, ... are regression coefficients. MI corresponds to the model intercept if the regression coefficients are zero. The values used for the terms lnSt−lnS0, rs, fSPs, fSRs and fI correspond to the simulation output. σ2 corresponds to the realized volatility of the simulation path of the underlying. Since the regression models (21) and (22) are equivalent to the theoretical model, β0 would be equal to 0 and all other coefficients would be equal to 1 in case of a perfect fit.
The third regression model is an intercept-only model to measure the relative error of the theoretical model. The regressand is calculated as deviation between the effective product return and the product return predicted by the model in Equation (19) divided by the effective product return. Formally, we have
lnCLCt−lnCLC0−[λ(lnSt−lnS0)+MI]lnCLCt−lnCLC0=β0+ϵ | (III) |
The regression coefficient β0 corresponds to the mean relative model error if the residuals are normally distributed. It indicates whether the model is accurate, i.e., whether it is overestimating (β0<0) or underestimating (β0>0) the effective return. The standard error of the coefficient, on the other hand, indicates whether the predictions of the model are precise. An accurate and precise model therefore implies that both the regression coefficient and its standard error are close to zero.
The results of the regression analysis are reported in Table 1. Judging by the (adjusted) R2 measure, the model is very accurate in explaining short- and long-term returns of CLCs. Indeed, the regression coefficients are relatively close to the expected values, in particular for holding periods of 5 and 250 trading days. Some of the regression coefficients assigned to the financing spread, short rate or index fee range between 0.8 and 0.9 for holding periods of 20 and 100 trading days. Contrariwise, the volatility of the underlying seems to have a slightly larger impact on the product return than predicted. Apart from that, all values are roughly in line with the model, i.e., the intercept coefficient is between 0 and 0.07 and the other coefficients range between 0.9 and 1.02. The model error measured by regression model (Ⅲ) ranges between −1% and 2%.
t=5 | t=20 | t=100 | t=250 | |||||||||
(Ⅰ) | (Ⅱ) | (Ⅲ) | (Ⅰ) | (Ⅱ) | (Ⅲ) | (Ⅰ) | (Ⅱ) | (Ⅲ) | (Ⅰ) | (Ⅱ) | (Ⅲ) | |
Intercept | 0.001∗∗∗ | 0.002∗∗∗ | −0.01 | 0.01∗∗∗ | 0.02∗∗∗ | 0.01∗∗∗ | 0.05∗∗∗ | 0.07∗∗∗ | 0.01∗ | 0.04∗∗∗ | 0.05∗∗∗ | 0.02∗ |
(0.0002) | (0.0001) | (0.04) | (0.0005) | (0.0003) | (0.002) | (0.001) | (0.001) | (0.005) | (0.001) | (0.001) | (0.01) | |
λ(lnSt−lnS0) | 1.02∗∗∗ | 1.02∗∗∗ | 1.02∗∗∗ | 1.02∗∗∗ | 1.01∗∗∗ | 1.01∗∗∗ | 1.01∗∗∗ | 1.01∗∗∗ | ||||
(0.0004) | (0.0004) | (0.0005) | (0.0005) | (0.001) | (0.001) | (0.0002) | (0.0002) | |||||
λ−λ22σ2t | 1.10∗∗∗ | 1.21∗∗∗ | 1.19∗∗∗ | 1.07∗∗∗ | ||||||||
(0.002) | (0.002) | (0.001) | (0.0005) | |||||||||
(1−λ)Δt∑n−1s=0(rs) | 0.98∗∗∗ | 1.02∗∗∗ | 1.01∗∗∗ | 1.02∗∗∗ | ||||||||
(0.03) | (0.02) | (0.01) | (0.002) | |||||||||
(1−λ)Δt∑n−1s=0(fSPs) | 0.95∗∗∗ | 0.88∗∗∗ | 0.88∗∗∗ | 0.98∗∗∗ | ||||||||
(0.02) | (0.01) | (0.01) | (0.002) | |||||||||
λΔt∑n−1s=0(fSRs) | 0.96∗∗∗ | 0.83∗∗∗ | 0.85∗∗∗ | 0.98∗∗∗ | ||||||||
(0.02) | (0.01) | (0.01) | (0.002) | |||||||||
−fIt | 0.99∗∗∗ | 0.84∗∗∗ | 0.98∗∗∗ | 1.00∗∗∗ | ||||||||
(0.15) | (0.08) | (0.04) | (0.01) | |||||||||
MI | 1.09∗∗∗ | 1.19∗∗∗ | 1.16∗∗∗ | 1.06∗∗∗ | ||||||||
(0.002) | (0.002) | (0.001) | (0.0004) | |||||||||
Observations | 33 892 | 33 892 | 33 892 | 33 882 | 33 882 | 33 882 | 33 824 | 33 824 | 33 824 | 33 802 | 33 802 | 33 802 |
R2 | 0.99 | 0.99 | 0.00 | 0.99 | 0.99 | 0.00 | 0.99 | 0.99 | 0.00 | 1.00 | 1.00 | 0.00 |
Adjusted R2 | 0.99 | 0.99 | 0.00 | 0.99 | 0.99 | 0.00 | 0.99 | 0.99 | 0.00 | 1.00 | 1.00 | 0.00 |
Note: The dependent variable of the regression models (Ⅰ) and (Ⅱ) is the cumulative logarithmic return of CLCs and the dependent variable of the regression model (Ⅲ) is the relative model error. ∗, ∗∗ and ∗∗∗ represent p<0.1, p<0.05 and p<0.01, respectively. |
Figure 4 illustrates the accuracy of the model graphically. It shows the logarithmic return of four randomly chosen CLCs over one year as a function of the logarithmic return of the underlying over the same period based on the results of an independent but similar simulation. The only difference is that interest rates are kept constant to obtain a constant model intercept, which enables the display of the return model as a straight line. The blue dots represent simulation outcomes and, as anticipated in the model, suggest that there is a strong linear relationship between the logarithmic return of CLCs and the logarithmic return of their underlyings.
A property of the geometric Brownian motion is the log-normal distribution of stock returns. However, it is well-known that stock return distributions are leptokurtic and tend to have fat tails. To take account of this characteristic, a simulation with time-varying volatility is run using a GARCH(p,q) model with p=q=1. The GARCH(1,1) model has proven to be a robust volatility model for equity instruments and to work effectively in forecasting (see, e.g., Andersen and Bollerslev, 1998; Hansen and Lunde, 2005). The model is specified as
σ2t=ω+αϵ2t−1+βσ2t−1 | (22) |
withϵt−1∼N(0,σ2t−1) |
The initial value for the conditional variance σ20 corresponds to the historical (long-term) variance during the investigation period σ2. As in the precedent simulation, the innovations ϵt are used to calculate daily logarithmic returns of the underlying.
The simulation with time-varying volatility is performed once with predefined, fixed values for the parameters α and β (same values for all underlyings) and once with fitted values for each underlying using maximum likelihood estimation. The fixed parameters used in my study are 0.1 for α, 0.85 for β and σ2(1−α−β) for ω. These values are approximately in line with estimated parameters for equity indexes in the literature (see, e.g., Engle, 2001; Koopman et al., 2005; Sabbatini and Linton, 1998, which found values for α between 0.077 and 0.102 and values for β between 0.8 and 0.905). Except for the application of time-varying volatility, the simulations and regression models in this section are identical to the model validation approach with constant volatility.
The results of the regression analysis are given in Table 2 and Table 3. The simulation with fixed parameters leads to a slightly better goodness of fit. Otherwise, the results of both simulations are comparable to the results obtained with constant volatility. The beta assigned to the volatility term is again slightly above 1, ranging between 1.13 and 1.26. The beta assigned to the return of the underlying is relatively stable with values between 1.01 and 1.04. The other regression coefficients are between 0.75 and 1.22. The simulation with fixed parameters results in roughly the same model accuracy as the simulation with constant volatility. However, the model accuracy for the simulation with fitted parameters is lower than before, with a mean model error ranging between -6% and 7%. Possibly, the estimation window for fitting the parameters, which corresponds to the investigation period of five years, is too short to obtain realistic estimates. Consequently, the return distributions of the underlyings resulting from the short estimation window might have unrealistic shapes and differ greatly from the log-normal distribution, which could explain the slightly worse results for the simulation with fitted parameters.
t=5 | t=20 | t=100 | t=250 | |||||||||
(Ⅰ) | (Ⅱ) | (Ⅲ) | (Ⅰ) | (Ⅱ) | (Ⅲ) | (Ⅰ) | (Ⅱ) | (Ⅲ) | (Ⅰ) | (Ⅱ) | (Ⅲ) | |
Intercept | 0.002∗∗∗ | 0.003∗∗∗ | −0.05 | 0.01∗∗∗ | 0.02∗∗∗ | 0.02∗ | 0.03∗∗∗ | 0.04∗∗∗ | −0.01 | 0.07∗∗∗ | 0.10∗∗∗ | 0.01 |
(0.0003) | (0.0002) | (0.07) | (0.001) | (0.0003) | (0.01) | (0.001) | (0.0005) | (0.02) | (0.002) | (0.001) | (0.004) | |
λ(lnSt−lnS0) | 1.02∗∗∗ | 1.02∗∗∗ | 1.02∗∗∗ | 1.02∗∗∗ | 1.01∗∗∗ | 1.01∗∗∗ | 1.01∗∗∗ | 1.01∗∗∗ | ||||
(0.001) | (0.001) | (0.001) | (0.001) | (0.0003) | (0.0003) | (0.0004) | (0.0004) | |||||
λ−λ22σ2t | 1.17∗∗∗ | 1.26∗∗∗ | 1.13∗∗∗ | 1.13∗∗∗ | ||||||||
(0.003) | (0.002) | (0.001) | (0.001) | |||||||||
(1−λ)Δt∑n−1s=0(rs) | 1.04∗∗∗ | 1.01∗∗∗ | 1.01∗∗∗ | 1.01∗∗∗ | ||||||||
(0.05) | (0.02) | (0.01) | (0.004) | |||||||||
(1−λ)Δt∑n−1s=0(fSPs) | 0.93∗∗∗ | 0.86∗∗∗ | 0.94∗∗∗ | 0.94∗∗∗ | ||||||||
(0.04) | (0.02) | (0.004) | (0.004) | |||||||||
λΔt∑n−1s=0(fSRs) | 0.88∗∗∗ | 0.75∗∗∗ | 0.93∗∗∗ | 0.95∗∗∗ | ||||||||
(0.04) | (0.02) | (0.004) | (0.004) | |||||||||
−fIt | 1.22∗∗∗ | 0.80∗∗∗ | 0.99∗∗∗ | 1.02∗∗∗ | ||||||||
(0.25) | (0.11) | (0.03) | (0.02) | |||||||||
MI | 1.16∗∗∗ | 1.23∗∗∗ | 1.11∗∗∗ | 1.10∗∗∗ | ||||||||
(0.003) | (0.002) | (0.001) | (0.001) | |||||||||
Observations | 33 894 | 33 894 | 33 894 | 33 883 | 33 883 | 33 883 | 33 820 | 33 820 | 33 820 | 33 800 | 33 800 | 33 800 |
R2 | 0.99 | 0.99 | 0.00 | 0.99 | 0.99 | 0.00 | 1.00 | 1.00 | 0.00 | 1.00 | 1.00 | 0.00 |
Adjusted R2 | 0.99 | 0.99 | 0.00 | 0.99 | 0.99 | 0.00 | 1.00 | 1.00 | 0.00 | 1.00 | 1.00 | 0.00 |
Note: The dependent variable of the regression models (Ⅰ) and (Ⅱ) is the cumulative logarithmic return of CLCs and the dependent variable of the regression model (Ⅲ) is the relative model error. ∗, ∗∗ and ∗∗∗ represent p<0.1, p<0.05 and p<0.01, respectively. |
t=5 | t=20 | t=100 | t=250 | |||||||||
(Ⅰ) | (Ⅱ) | (Ⅲ) | (Ⅰ) | (Ⅱ) | (Ⅲ) | (Ⅰ) | (Ⅱ) | (Ⅲ) | (Ⅰ) | (Ⅱ) | (Ⅲ) | |
Intercept | 0.002∗∗∗ | 0.003∗∗∗ | −0.06 | 0.01∗∗∗ | 0.02∗∗∗ | −0.002 | 0.05∗∗∗ | 0.07∗∗∗ | 0.02∗ | 0.08∗∗∗ | 0.11∗∗∗ | 0.07∗ |
(0.001) | (0.0002) | (0.05) | (0.001) | (0.0004) | (0.01) | (0.001) | (0.001) | (0.01) | (0.002) | (0.001) | (0.04) | |
λ(lnSt−lnS0) | 1.04∗∗∗ | 1.04∗∗∗ | 1.04∗∗∗ | 1.04∗∗∗ | 1.02∗∗∗ | 1.02∗∗∗ | 1.02∗∗∗ | 1.02∗∗∗ | ||||
(0.001) | (0.001) | (0.001) | (0.001) | (0.001) | (0.001) | (0.0005) | (0.0005) | |||||
λ−λ22σ2t | 1.18∗∗∗ | 1.19∗∗∗ | 1.19∗∗∗ | 1.13∗∗∗ | ||||||||
(0.004) | (0.002) | (0.001) | (0.001) | |||||||||
(1−λ)Δt∑n−1s=0(rs) | 1.20∗∗∗ | 1.02∗∗∗ | 0.99∗∗∗ | 1.02∗∗∗ | ||||||||
(0.08) | (0.03) | (0.01) | (0.01) | |||||||||
(1−λ)Δt∑n−1s=0(fSPs) | 1.03∗∗∗ | 0.98∗∗∗ | 0.94∗∗∗ | 1.00∗∗∗ | ||||||||
(0.06) | (0.03) | (0.01) | (0.005) | |||||||||
λΔt∑n−1s=0(fSRs) | 1.00∗∗∗ | 0.86∗∗∗ | 0.86∗∗∗ | 0.94∗∗∗ | ||||||||
(0.06) | (0.02) | (0.01) | (0.005) | |||||||||
−fIt | 0.92∗∗ | 1.05∗∗∗ | 0.97∗∗∗ | 1.01∗∗∗ | ||||||||
(0.38) | (0.16) | (0.05) | (0.03) | |||||||||
MI | 1.18∗∗∗ | 1.19∗∗∗ | 1.17∗∗∗ | 1.11∗∗∗ | ||||||||
(0.004) | (0.002) | (0.001) | (0.001) | |||||||||
Observations | 33 800 | 33 800 | 33 800 | 33 741 | 33 741 | 33 741 | 33 570 | 33 570 | 33 570 | 33 451 | 33 451 | 33 451 |
R2 | 0.97 | 0.97 | 0.00 | 0.98 | 0.98 | 0.00 | 0.99 | 0.99 | 0.00 | 1.00 | 1.00 | 0.00 |
Adjusted R2 | 0.97 | 0.97 | 0.00 | 0.98 | 0.98 | 0.00 | 0.99 | 0.99 | 0.00 | 1.00 | 1.00 | 0.00 |
Note: The dependent variable of the regression models (Ⅰ) and (Ⅱ) is the cumulative logarithmic return of CLCs and the dependent variable of the regression model (Ⅲ) is the relative model error. ∗, ∗∗ and ∗∗∗ represent p<0.1, p<0.05 and p<0.01, respectively. |
The last model validation is performed with empirical data, where the products' returns predicted by the theoretical model are compared to effective returns. The results are displayed in Table 4. As the (adjusted) R2 measure shows, the goodness of fit is not worse than previously obtained values with simulated returns. Moreover, the regression coefficient assigned to the volatility term ranges between 0.9 and 1.05 and is therefore much closer to 1. The regression coefficient assigned to the return of the underlying is in line with previously obtained results and ranges between 1.02 and 1.03.
t=5 | t=20 | t=100 | t=250 | |||||||||
(Ⅰ) | (Ⅱ) | (Ⅲ) | (Ⅰ) | (Ⅱ) | (Ⅲ) | (Ⅰ) | (Ⅱ) | (Ⅲ) | (Ⅰ) | (Ⅱ) | (Ⅲ) | |
Intercept | 0.001 | −0.002∗∗∗ | 0.004 | 0.001 | −0.002∗∗∗ | 0.27 | −0.01 | −0.004∗∗ | 0.003 | −0.06∗∗ | −0.01∗∗∗ | 0.07 |
(0.001) | (0.0001) | (0.01) | (0.002) | (0.0003) | (0.21) | (0.01) | (0.002) | (0.004) | (0.03) | (0.005) | (0.05) | |
λ(lnSt−lnS0) | 1.03∗∗∗ | 1.03∗∗∗ | 1.03∗∗∗ | 1.03∗∗∗ | 1.03∗∗∗ | 1.03∗∗∗ | 1.02∗∗∗ | 1.02∗∗∗ | ||||
(0.0004) | (0.0004) | (0.001) | (0.001) | (0.001) | (0.001) | (0.002) | (0.002) | |||||
λ−λ22σ2t | 0.90∗∗∗ | 1.00∗∗∗ | 1.04∗∗∗ | 1.05∗∗∗ | ||||||||
(0.002) | (0.002) | (0.003) | (0.004) | |||||||||
(1−λ)Δt∑n−1s=0(rs) | 1.25∗∗∗ | 1.22∗∗∗ | 1.17∗∗∗ | 1.13∗∗∗ | ||||||||
(0.11) | (0.10) | (0.10) | (0.14) | |||||||||
(1−λ)Δt∑n−1s=0(fSPs) | 3.32∗∗∗ | 2.33∗∗∗ | 1.50∗∗∗ | 1.20∗∗∗ | ||||||||
(0.27) | (0.23) | (0.24) | (0.31) | |||||||||
λΔt∑n−1s=0(fSRs) | 2.27∗∗∗ | 1.02∗∗∗ | 0.03 | −0.09 | ||||||||
(0.08) | (0.08) | (0.09) | (0.10) | |||||||||
−fIt | 13.61∗∗∗ | 4.53∗ | −3.38 | −6.47∗∗ | ||||||||
(2.70) | (2.33) | (2.35) | (2.89) | |||||||||
MI | 0.90∗∗∗ | 1.00∗∗∗ | 1.02∗∗∗ | 1.02∗∗∗ | ||||||||
(0.002) | (0.002) | (0.003) | (0.004) | |||||||||
Observations | 54 906 | 54 906 | 54 906 | 13 610 | 13 610 | 13 610 | 2 597 | 2 597 | 2 597 | 891 | 891 | 891 |
R2 | 0.99 | 0.99 | 0.00 | 1.00 | 1.00 | 0.00 | 1.00 | 1.00 | 0.00 | 1.00 | 1.00 | 0.00 |
Adjusted R2 | 0.99 | 0.99 | 0.00 | 1.00 | 1.00 | 0.00 | 1.00 | 1.00 | 0.00 | 1.00 | 1.00 | 0.00 |
Note: The dependent variable of the regression models (Ⅰ) and (Ⅱ) is the cumulative logarithmic return of CLCs and the dependent variable of the regression model (Ⅲ) is the relative model error. ∗, ∗∗ and ∗∗∗ represent p<0.1, p<0.05 and p<0.01, respectively. |
In contrast, the regression coefficients assigned to the interest rate, financing spread, short rate and index fee deviate from 1, in some cases even drastically. It seems that the lack of variability of these variables is a serious shortcoming. For instance, the index fee amounts to 0.7% for 223 products, 1% for 112 products and 1.5% for 4 products, which makes it difficult to capture its impact on the return correctly. However, it should be added that the variables with low variability have a relatively small effect size. This becomes apparent when comparing the beta coefficient of the model intercept from model (Ⅱ) to the beta coefficient assigned to the volatility term in model (Ⅰ). These are in general very close, which suggests that the overall predictive capability is not affected by the lack of data variability. It appears to be difficult to prove the correct incorporation of all variables and parameters in the model based on empirical data. But given the results obtained by the—in this regard probably more meaningful—simulation-based validation, I believe that the theoretical model reflects real-world data well.
The average model error ranges from -1% to 7%, with the exception of the value obtained for a holding period of 20 days, which surprisingly amounts to 27%. This value, however, comes along with a relatively large standard deviation. Accordingly, it is not significantly different from 0, which also applies to average model errors obtained for the other holding periods.
Overall, I conclude that the cumulative logarithmic return of CLCs can be explained well by the leveraged cumulative logarithmic return of the underlying, a volatility adjustment term and a fee and interest reduction. This applies to a broad range of processes for the underlying and to empirical data. The large goodness of fit also implies that other potential explanatory variables (such as, e.g., sentiment or market states) are only relevant insofar as they are reflected in the realized return series of the underlying.
The estimated regression coefficients assigned to the volatility term (β2) is, however, mostly larger than 1, which implies that the volatility of the underlying has a stronger effect on the return of CLCs than predicted by the model. A possible explanation for this is that the model generally tends to predict values that are too high, which then results in a larger regression coefficient for the volatility term to reduce the model output.‡‡ One can show numerically that the model output is relatively large compared to the effective cumulative product return if the latter is negative (especially if it is only slightly negative). This explanation is therefore plausible if the cumulative product return is negative on average or—because least squares regressions are dragged towards outliers—if a small minority of simulation paths produces extremely large model errors. In any case, the relatively large regression coefficient for the volatility term can be found in all simulation approaches and thus irrespective of whether returns of the underlying are log-normally distributed or not. I thus believe that the assumption on the rebalancing frequency is more critical for the model accuracy.
‡‡Note that the volatility term (λ−λ22σ2dt) is always negative.
The model introduced in the last section allows for an analysis of the return distribution for varying holding periods and leverage factors. For simplicity, I assume constant interest and issuer fees in the subsequent analysis. In that case, according to Equation (16), the logarithmic return over the investment period [0,t] equals
lnCLCtCLC0=[λμ+(1−λ)(r+fSP)+λfSR−fI−12λ2σ2]t+λσWt | (23) |
Since Wt is the only stochastic component and normally distributed with Wt∼N(0,t), it follows that
lnCLCtCLC0∼N(ˆμ,ˆσ2)orCLCtCLC0∼LN(ˆμ,ˆσ2) | (24) |
withˆμ=[λμ+(1−λ)(r+fSP)+λfSR−fI−12λ2σ2]tandˆσ2=λ2σ2t |
The probability density function is thus given by
f(ptp0)=1√2πˆσCLCtCLC0⋅exp[−(lnCLCtCLC0−ˆμ)22ˆσ211] | (25) |
Figure 5 shows probability density functions for varying leverage factors and over holding periods of 1, 7, 30, 90 and 365 days. All parameters correspond to average values during the investigation period. To facilitate the comparison between different investment horizons, the density functions are only displayed in the range of −1 to 2 (ordinary return) and −2 to 2 (logarithmic return). However, that does not affect the overall interpretation of the diagrams.
There are two peculiarities that are particularly apparent when analyzing the distributions. First, short certificates have a much lower performance than long certificates, which is in line with the overall positive long-term trend of stock prices. For instance, when comparing the mean logarithmic returns of pairs of long and short certificates, a clear difference can be observed. The difference becomes increasingly obvious with longer holding periods.
Second, there is an increasing skewness of the distribution of ordinary returns over long-term investment horizons. The distribution is relatively symmetrical for a holding period of 1 day but gets an increasingly long tail on the right for holding periods of 7 days or more, in particular if the leverage factor is extremely negative or extremely positive. The skewness of the distribution of CLCs with leverage factors -10 and 10 over an investment period of 365 days is so large that the left tail is no longer visible.
Interestingly, for λ→∞ as well as for t→∞ the loss probability given by
P(CLCtCLC0≤1)=Φ(−ˆμˆσ)=Φ[−(μ+(1λ−1)(r+fSP)+fSR−1λfI−12λσ2)√tσ11] | (26) |
with Φ(⋅) being the cumulative standard normal distribution, tends to 100%, since the term within the squared brackets in Equation (29) is dominated mainly by the variance of the underlying. At the same time, the mean return given by
E(CLCtCLC0)=exp(ˆμ+12ˆσ2)=exp[(λμ+(1−λ)(r+fSP)+λfSR−fI)t] | (27) |
tends to infinity. Hence, an investment in a long CLC with extremely large leverage and/or with an extremely long holding period has similar risk-return characteristics as the well-known St. Petersburg lottery. For short CLCs with λ→−∞ the loss probability tends to 100% as well, however, the expected return converges towards a total loss. These findings also show why a lot of these products have strongly negative returns.
Figure 6 shows histograms of ordinary and logarithmic historical returns of CLCs. For better comparison, the same holding periods are analyzed as in the previous section.
In general, the histograms of historical returns have a similar shape as the theoretical distributions. Logarithmic returns are relatively symmetrically distributed, while there is a clearly recognizable positive skewness of ordinary returns over long-term investment periods. However, the theoretical distributions seem to have a more pronounced skewness, especially for products with leverage factors -10 and 10. The long tail on the right of the historical distribution is clearly recognizable only for holding periods of 90 days or more.
The deviation between the theoretical and historical distributions might be explained by the fact that 80% of the products from the sample have a leverage factor between -6 and 6. As a result, the historical distributions rather look like the theoretical distributions for the leverage factors -5 and 5. Unfortunately, the amount of data does not allow for an isolated analysis of CLCs with different leverage factors.
Another possible driver for the greater skewness of the theoretical distributions could be the mismatched rebalancing frequency. In contrast to the continuous rebalancing frequency assumed in the model, CLCs are rebalanced only once a day in practice. This explanation is supported by Trainor (2011), who studied the difference between daily and monthly rebalancing leveraged ETFs and found that the compounding effect is more pronounced if the rebalancing frequency is high.
The historical distributions also reveal that there are more extreme negative logarithmic returns than extreme positive ones for long-term investment horizons. This observation is in line with theoretical distributions for short certificates. But in contrast to the theoretical analysis, historical logarithmic returns of long certificates also seem to have a heavier tail on the left. However, the distribution of long-term returns is much less smooth due to the smaller amount of available data, which makes a conclusive argument based on empirical data difficult.
CLCs are relatively new financial products, which enable a leveraged participation in the underlying asset for risk-seeking investors. The main innovation of these certificates is the constant leverage on a daily basis, i.e., their daily return (roughly) corresponds to the daily return of the underlying multiplied by the product's leverage factor. The increasing popularity of CLCs might be attributed to their seemingly easy comprehensibility associated with this product feature. However, many investors may not be familiar with the implications of the daily rebalancing on the long-term return. Already a brief look at a few price paths of CLCs over a longer period of time suggests that their return prospects may not be as good as it initially seems. Many of these products have a negative return over an investment period of one year despite a positive development of the underlying. A substantial part of the products suffers a price decline that is practically a total loss.
I examine this phenomenon in my study with a profound theoretical and empirical analysis of the short- and long-term return of these certificates based on the price-setting formula communicated in term sheets. The analysis starts with a comparison of the return of CLCs with the leveraged return of the underlying over holding periods longer than one day. I often find a large but insignificant deviation between these two returns, as the variance of the deviation is also relatively large. The deviation is mainly related to the effect of compounding, which can have a positive or negative impact on the products' return. In general, compounding has positive (negative) effects in periods of low (high) volatility. Due to the low interest level with partly negative rates during the investigation period, interest does not significantly lower or increase the return despite the large debt or deposit portion in some CLCs. Issuer fees, however, negatively affect the products' return, especially in case of a favorable product performance. They contribute to a return decrease of 3.2% on average over a holding period of one year.
I thus further deepen my analysis by presenting a model that links the (long-term) return of CLCs to the return of its underlying. It shows that the products' logarithmic return is best predicted by the logarithmic return of the underlying multiplied by the leverage factor minus a deduction related to the volatility of the underlying, interest and issuer fees. A regression analysis with simulated and empirical returns for the underlying showed that the model has a high goodness of fit also in case of time-varying volatility. The relative model error mostly amounts to maximally a few percentage points and has a low standard deviation, which indicates that the model predictions are accurate as well as precise.
Based on the model, I derive a theoretical return distribution and study the effects of different holding periods and leverage factors on its shape. The findings show that the length of the holding period and the size of the leverage factor have a negative impact on the average product return for short certificates but not for long certificates. These two factors, however, also lead to a positively skewed return distribution with long tails on the right. Therefore, (long) certificates held over long investment periods are associated with an increasing loss probability (despite higher expected returns), which also explains why a majority of the products results in a large loss in the long run. The right-skewed shape of the return distribution can also be found in empirical product returns.
A limitation of this study is its exclusive focus on products with equities and indexes as underlying. Other asset classes, such as futures, commodities, currencies or interest rates, might have a differently shaped return distribution. My results suggest that the process for the underlying is not crucial for the model accuracy. Nonetheless, a profound analysis of the implications of different return distributions on the long-term performance of the products in general or the compounding effect in particular would be required to answer this question conclusively.
Investment products with constant leverage have been criticized in many scholarly articles. At the one hand, there is concern that such a product design may attract speculators and noise traders that could theoretically destabilize financial markets (Chen and Diaz, 2012). In practice, however, banks limit the issuing volume of CLCs to an extend that disables a large impact on the price stability of underlying assets. On the other hand, constant leverage products have been criticized for not being suited as long-term investments due to their large loss probability in the long run (see, e.g., Lu et al., 2014; Murphy and Wright, 2010; Charupat and Miu, 2011; Tang and Xu, 2013). I argue that CLCs should be considered as an alternative to other leveraged instruments by investors that are either speculating on a low volatility of the underlying asset or looking for lottery-like risk-return characteristics, where a high profit potential comes along with a high loss probability. Also, it could be interesting to explore momentum strategies because CLCs would profit even more from the continuance of an existing upward market trend due to the compounding of prior returns. Finally, it could be interesting to explore the implications of these certificates in a portfolio context, which could potentially improve the overall portfolio performance as a recent study on the related leveraged ETFs suggests (Smirnov and Smirnov, 2020). A large drawback of CLC, however, is that they are relatively expensive. Consequently, large institutional investors may find it ineffective to use CLCs for any purpose as they can reconstruct the payoff profile of these products at a smaller price.
I would like to thank Martin Wallmeier and two anonymous reviewers for valuable comments.
The author declares no conflicts of interest in this paper.
[1] |
Kavasseri RG, Seetharaman K (2009) Day-ahead wind speed forecasting using f-ARIMA models. Renew Energ 34: 1388-1393. doi: 10.1016/j.renene.2008.09.006
![]() |
[2] |
Cassola F, Burlando M (2012) Wind speed and wind energy forecast through Kalman filtering of Numerical Weather Prediction model output. Appl Energ 99: 154-166. doi: 10.1016/j.apenergy.2012.03.054
![]() |
[3] |
Warner TT, Peterson RA, Treadon RE (1997) A tutorial on lateral boundary conditions as a basic and potentially serious limitation to regional numerical weather prediction. B Am Meteorol Soc 78: 2599-2618. doi: 10.1175/1520-0477(1997)078<2599:ATOLBC>2.0.CO;2
![]() |
[4] |
Franzke CL, O'Kane TJ, Berner J, et al. (2015) Stochastic climate theory and modeling. Wiley Interdis Rev: Climate Change 6: 63-78. doi: 10.1002/wcc.318
![]() |
[5] | Yu Media Group. El Paso, TX. Detailed climate information and monthly weather forecast. Available from https://www.weather-us.com/en/texas-usa/el-paso-climate. |
[6] | Misachi J (2017) What Are The Characteristics Of A Semi-arid Climate Pattern. Available from: https://www.worldatlas.com/articles/what-are-the-characteristics-of-a-semi-arid-climate pattern.html |
[7] | Novlan DJ, Hardiman M, Gill TE (2007) A synoptic climatology of blowing dust events in El Paso, Texas from 1932-2005. In Preprints, 16th Conference on Applied Climatology, American Meteorological Society J |
[8] |
Breshears DD, Kirchner TB, Whicker JJ, et al. (2012) Modeling aeolian transport in response to succession, disturbance and future climate: Dynamic long-term risk assessment for contaminant redistribution. Aeolian Res 3: 445-457. doi: 10.1016/j.aeolia.2011.03.012
![]() |
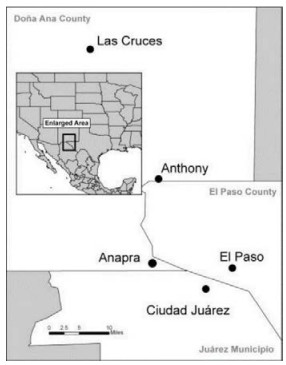
[9] | Regional Stakeholders Committee (2009) The Paso Del Norte Region, US-Mexico: Self-Evaluation Report, OECD Reviews of Higher Education in Regional and City Development, IMHE. Available from: https://www.oecd.org/unitedstates/44210876.pdf |
[10] |
Baumbach JP, Foster LN, Mueller M, et al. (2008) Seroprevalence of select blood borne pathogens and associated risk behaviors among injection drug users in the Paso del Norte region of the United States-Mexico border. Harm Reduct J 5: 33. doi: 10.1186/1477-7517-5-33
![]() |
[11] |
Lu D, Reddy R, Fitzgerald R, et al. (2008) Sensitivity modeling study for an ozone occurrence during the 1996 Paso del Norte ozone campaign. Int J Environ Res Pub He 5: 181-203. doi: 10.3390/ijerph5040181
![]() |
[12] | Pearson R, Fitzgerald R (2005) Application of a wind model for the El Paso-Juarez airshed. J Air Waste Manage Assoc 51: 669-680. |
[13] | Cai C, Kelly JT, Avise Stockwell WR, et al. (2001) Photochemical modeling in California with two chemical mechanisms: model intercomparison and response to emission reductions. J Air Waste Manage Assoc 61: 559-572. |
[14] | Mahmud S, Wangchuk P, Fitzgerald R, et al. (2016) Study of Photolysis Rate Coefficients to Improve Air Quality Models. B Am Phy Soc 61. |
[15] | Mahmud S (2016) The use of remote sensing technologies and models to study pollutants in the Paso del Norte region. The University of Texas at El Paso. Available from: https://scholarworks.utep.edu/open_etd/685/ |
[16] | Ullwer C, Sprung D, Sucher E, et al. (2019) Global simulations of Cn2 using the Weather Research and Forecast Model WRF and comparison to experimental results. In Laser communication and Propagation through the Atmosphere and Oceans VIII: 111330I |
[17] | Brown MJ, Muller C, Wang W (2001) Costigan, K. Meteorological simulations of boundary layer structure during the 1996 Paso del Norte Ozone Study. Sci Total Environ. 276: 111-133. |
[18] | Michalakes J, Dudhia J, Gill D, et al. (2005) The weather research and forecast model: software architecture and performance. Use High Perform Comput Meteorol 2005: 156-168. |
[19] | Michalakes J, Chen S, Dudhia J, et al. (2001) Development of a next-generation regional weather research and forecast model. Dev Teracomput 2001: 269-276. |
[20] | Skamarock WC, Klemp J B, Dudhia J, et al. (2005) A description of the advanced research WRF version 2 (No. NCAR/TN-468+ STR). National Center for Atmospheric Research Boulder Co Mesoscale and Microscale Meteorology Div. |
[21] |
Islam MR, Peace A, Medina D, Oraby T (2020) Integer versus Fractional Order SEIR Deterministic and Stochastic Models of Measles. Int J Env Res Pub He 17: 2014. doi: 10.3390/ijerph17062014
![]() |
[22] | Allen DT, Torres VM (2010) TCEQ Flare Study Project, Final Report. The University of Texas at Austin The Center for Energy and Environmental Resources. |
[23] | Wilby RL, Charles SP, Zorita E, et al. (2004) Guidelines for use of climate scenarios developed from statistical downscaling methods. Supporting material of the Intergovernmental Panel on Climate Change, available from the DDC of IPCC TGCIA 27. |
[24] |
Raysoni AU, Sarnat JA, Sarnat SE, et al. (2011) Binational school-based monitoring of traffic-related air pollutants in El Paso, Texas (USA) and Ciudad Jurez, Chihuahua (Mxico). Env Pol 159: 2476-2486. doi: 10.1016/j.envpol.2011.06.024
![]() |
[25] |
Said SE, Dickey D (1984) Testing for Unit Roots in Autoregressive Moving-Average Models with Unknown Order. Biometrika 71: 599-607. doi: 10.1093/biomet/71.3.599
![]() |
[26] |
Phillips PCB, Perron Pierre (1988) Testing for a Unit Root in Time Series Regression. Biometrika 75: 335-346. doi: 10.1093/biomet/75.2.335
![]() |
[27] | Wellner Jon A (2003) Gaussian White Noise Models: Some Results for Monotone Functions. Lecture Notes-Monograph Series 2003: 87-104. |
[28] | Kitagawa G (1994) State Space Modeling of Time Series. The Institute of Statistical Mathematics 43-64. |
[29] |
Grineski SE, Collins TW, McDonald YJ, et al. (2015) Double exposure and the climate gap: changing demographics and extreme heat in Ciudad Jurez, Mexico. Local Env 20: 180-201. doi: 10.1080/13549839.2013.839644
![]() |
[30] | Wilder M, Garfin G, Ganster P, et al. (2013) Climate change and US-Mexico border communities. In Assessment of Climate Change in the Southwest United States, Island Press, Washington DC: 340-384. |
1. | Annika Homburg, Christian H. Weiß, Gabriel Frahm, Layth C. Alwan, Rainer Göb, Analysis and Forecasting of Risk in Count Processes, 2021, 14, 1911-8074, 182, 10.3390/jrfm14040182 | |
2. | Rongwu Zhang, Yanzhen Lin, Yingxu Kuang, Will the Governance of Non-State Shareholders Inhibit Corporate Social Responsibility Performance? Evidence from the Mixed-Ownership Reform of China’s State-Owned Enterprises, 2022, 14, 2071-1050, 527, 10.3390/su14010527 |
t=5 | t=20 | t=100 | t=250 | |||||||||
(Ⅰ) | (Ⅱ) | (Ⅲ) | (Ⅰ) | (Ⅱ) | (Ⅲ) | (Ⅰ) | (Ⅱ) | (Ⅲ) | (Ⅰ) | (Ⅱ) | (Ⅲ) | |
Intercept | 0.001∗∗∗ | 0.002∗∗∗ | −0.01 | 0.01∗∗∗ | 0.02∗∗∗ | 0.01∗∗∗ | 0.05∗∗∗ | 0.07∗∗∗ | 0.01∗ | 0.04∗∗∗ | 0.05∗∗∗ | 0.02∗ |
(0.0002) | (0.0001) | (0.04) | (0.0005) | (0.0003) | (0.002) | (0.001) | (0.001) | (0.005) | (0.001) | (0.001) | (0.01) | |
λ(lnSt−lnS0) | 1.02∗∗∗ | 1.02∗∗∗ | 1.02∗∗∗ | 1.02∗∗∗ | 1.01∗∗∗ | 1.01∗∗∗ | 1.01∗∗∗ | 1.01∗∗∗ | ||||
(0.0004) | (0.0004) | (0.0005) | (0.0005) | (0.001) | (0.001) | (0.0002) | (0.0002) | |||||
λ−λ22σ2t | 1.10∗∗∗ | 1.21∗∗∗ | 1.19∗∗∗ | 1.07∗∗∗ | ||||||||
(0.002) | (0.002) | (0.001) | (0.0005) | |||||||||
(1−λ)Δt∑n−1s=0(rs) | 0.98∗∗∗ | 1.02∗∗∗ | 1.01∗∗∗ | 1.02∗∗∗ | ||||||||
(0.03) | (0.02) | (0.01) | (0.002) | |||||||||
(1−λ)Δt∑n−1s=0(fSPs) | 0.95∗∗∗ | 0.88∗∗∗ | 0.88∗∗∗ | 0.98∗∗∗ | ||||||||
(0.02) | (0.01) | (0.01) | (0.002) | |||||||||
λΔt∑n−1s=0(fSRs) | 0.96∗∗∗ | 0.83∗∗∗ | 0.85∗∗∗ | 0.98∗∗∗ | ||||||||
(0.02) | (0.01) | (0.01) | (0.002) | |||||||||
−fIt | 0.99∗∗∗ | 0.84∗∗∗ | 0.98∗∗∗ | 1.00∗∗∗ | ||||||||
(0.15) | (0.08) | (0.04) | (0.01) | |||||||||
MI | 1.09∗∗∗ | 1.19∗∗∗ | 1.16∗∗∗ | 1.06∗∗∗ | ||||||||
(0.002) | (0.002) | (0.001) | (0.0004) | |||||||||
Observations | 33 892 | 33 892 | 33 892 | 33 882 | 33 882 | 33 882 | 33 824 | 33 824 | 33 824 | 33 802 | 33 802 | 33 802 |
R2 | 0.99 | 0.99 | 0.00 | 0.99 | 0.99 | 0.00 | 0.99 | 0.99 | 0.00 | 1.00 | 1.00 | 0.00 |
Adjusted R2 | 0.99 | 0.99 | 0.00 | 0.99 | 0.99 | 0.00 | 0.99 | 0.99 | 0.00 | 1.00 | 1.00 | 0.00 |
Note: The dependent variable of the regression models (Ⅰ) and (Ⅱ) is the cumulative logarithmic return of CLCs and the dependent variable of the regression model (Ⅲ) is the relative model error. ∗, ∗∗ and ∗∗∗ represent p<0.1, p<0.05 and p<0.01, respectively. |
t=5 | t=20 | t=100 | t=250 | |||||||||
(Ⅰ) | (Ⅱ) | (Ⅲ) | (Ⅰ) | (Ⅱ) | (Ⅲ) | (Ⅰ) | (Ⅱ) | (Ⅲ) | (Ⅰ) | (Ⅱ) | (Ⅲ) | |
Intercept | 0.002∗∗∗ | 0.003∗∗∗ | −0.05 | 0.01∗∗∗ | 0.02∗∗∗ | 0.02∗ | 0.03∗∗∗ | 0.04∗∗∗ | −0.01 | 0.07∗∗∗ | 0.10∗∗∗ | 0.01 |
(0.0003) | (0.0002) | (0.07) | (0.001) | (0.0003) | (0.01) | (0.001) | (0.0005) | (0.02) | (0.002) | (0.001) | (0.004) | |
λ(lnSt−lnS0) | 1.02∗∗∗ | 1.02∗∗∗ | 1.02∗∗∗ | 1.02∗∗∗ | 1.01∗∗∗ | 1.01∗∗∗ | 1.01∗∗∗ | 1.01∗∗∗ | ||||
(0.001) | (0.001) | (0.001) | (0.001) | (0.0003) | (0.0003) | (0.0004) | (0.0004) | |||||
λ−λ22σ2t | 1.17∗∗∗ | 1.26∗∗∗ | 1.13∗∗∗ | 1.13∗∗∗ | ||||||||
(0.003) | (0.002) | (0.001) | (0.001) | |||||||||
(1−λ)Δt∑n−1s=0(rs) | 1.04∗∗∗ | 1.01∗∗∗ | 1.01∗∗∗ | 1.01∗∗∗ | ||||||||
(0.05) | (0.02) | (0.01) | (0.004) | |||||||||
(1−λ)Δt∑n−1s=0(fSPs) | 0.93∗∗∗ | 0.86∗∗∗ | 0.94∗∗∗ | 0.94∗∗∗ | ||||||||
(0.04) | (0.02) | (0.004) | (0.004) | |||||||||
λΔt∑n−1s=0(fSRs) | 0.88∗∗∗ | 0.75∗∗∗ | 0.93∗∗∗ | 0.95∗∗∗ | ||||||||
(0.04) | (0.02) | (0.004) | (0.004) | |||||||||
−fIt | 1.22∗∗∗ | 0.80∗∗∗ | 0.99∗∗∗ | 1.02∗∗∗ | ||||||||
(0.25) | (0.11) | (0.03) | (0.02) | |||||||||
MI | 1.16∗∗∗ | 1.23∗∗∗ | 1.11∗∗∗ | 1.10∗∗∗ | ||||||||
(0.003) | (0.002) | (0.001) | (0.001) | |||||||||
Observations | 33 894 | 33 894 | 33 894 | 33 883 | 33 883 | 33 883 | 33 820 | 33 820 | 33 820 | 33 800 | 33 800 | 33 800 |
R2 | 0.99 | 0.99 | 0.00 | 0.99 | 0.99 | 0.00 | 1.00 | 1.00 | 0.00 | 1.00 | 1.00 | 0.00 |
Adjusted R2 | 0.99 | 0.99 | 0.00 | 0.99 | 0.99 | 0.00 | 1.00 | 1.00 | 0.00 | 1.00 | 1.00 | 0.00 |
Note: The dependent variable of the regression models (Ⅰ) and (Ⅱ) is the cumulative logarithmic return of CLCs and the dependent variable of the regression model (Ⅲ) is the relative model error. ∗, ∗∗ and ∗∗∗ represent p<0.1, p<0.05 and p<0.01, respectively. |
t=5 | t=20 | t=100 | t=250 | |||||||||
(Ⅰ) | (Ⅱ) | (Ⅲ) | (Ⅰ) | (Ⅱ) | (Ⅲ) | (Ⅰ) | (Ⅱ) | (Ⅲ) | (Ⅰ) | (Ⅱ) | (Ⅲ) | |
Intercept | 0.002∗∗∗ | 0.003∗∗∗ | −0.06 | 0.01∗∗∗ | 0.02∗∗∗ | −0.002 | 0.05∗∗∗ | 0.07∗∗∗ | 0.02∗ | 0.08∗∗∗ | 0.11∗∗∗ | 0.07∗ |
(0.001) | (0.0002) | (0.05) | (0.001) | (0.0004) | (0.01) | (0.001) | (0.001) | (0.01) | (0.002) | (0.001) | (0.04) | |
λ(lnSt−lnS0) | 1.04∗∗∗ | 1.04∗∗∗ | 1.04∗∗∗ | 1.04∗∗∗ | 1.02∗∗∗ | 1.02∗∗∗ | 1.02∗∗∗ | 1.02∗∗∗ | ||||
(0.001) | (0.001) | (0.001) | (0.001) | (0.001) | (0.001) | (0.0005) | (0.0005) | |||||
λ−λ22σ2t | 1.18∗∗∗ | 1.19∗∗∗ | 1.19∗∗∗ | 1.13∗∗∗ | ||||||||
(0.004) | (0.002) | (0.001) | (0.001) | |||||||||
(1−λ)Δt∑n−1s=0(rs) | 1.20∗∗∗ | 1.02∗∗∗ | 0.99∗∗∗ | 1.02∗∗∗ | ||||||||
(0.08) | (0.03) | (0.01) | (0.01) | |||||||||
(1−λ)Δt∑n−1s=0(fSPs) | 1.03∗∗∗ | 0.98∗∗∗ | 0.94∗∗∗ | 1.00∗∗∗ | ||||||||
(0.06) | (0.03) | (0.01) | (0.005) | |||||||||
λΔt∑n−1s=0(fSRs) | 1.00∗∗∗ | 0.86∗∗∗ | 0.86∗∗∗ | 0.94∗∗∗ | ||||||||
(0.06) | (0.02) | (0.01) | (0.005) | |||||||||
−fIt | 0.92∗∗ | 1.05∗∗∗ | 0.97∗∗∗ | 1.01∗∗∗ | ||||||||
(0.38) | (0.16) | (0.05) | (0.03) | |||||||||
MI | 1.18∗∗∗ | 1.19∗∗∗ | 1.17∗∗∗ | 1.11∗∗∗ | ||||||||
(0.004) | (0.002) | (0.001) | (0.001) | |||||||||
Observations | 33 800 | 33 800 | 33 800 | 33 741 | 33 741 | 33 741 | 33 570 | 33 570 | 33 570 | 33 451 | 33 451 | 33 451 |
R2 | 0.97 | 0.97 | 0.00 | 0.98 | 0.98 | 0.00 | 0.99 | 0.99 | 0.00 | 1.00 | 1.00 | 0.00 |
Adjusted R2 | 0.97 | 0.97 | 0.00 | 0.98 | 0.98 | 0.00 | 0.99 | 0.99 | 0.00 | 1.00 | 1.00 | 0.00 |
Note: The dependent variable of the regression models (Ⅰ) and (Ⅱ) is the cumulative logarithmic return of CLCs and the dependent variable of the regression model (Ⅲ) is the relative model error. ∗, ∗∗ and ∗∗∗ represent p<0.1, p<0.05 and p<0.01, respectively. |
t=5 | t=20 | t=100 | t=250 | |||||||||
(Ⅰ) | (Ⅱ) | (Ⅲ) | (Ⅰ) | (Ⅱ) | (Ⅲ) | (Ⅰ) | (Ⅱ) | (Ⅲ) | (Ⅰ) | (Ⅱ) | (Ⅲ) | |
Intercept | 0.001 | −0.002∗∗∗ | 0.004 | 0.001 | −0.002∗∗∗ | 0.27 | −0.01 | −0.004∗∗ | 0.003 | −0.06∗∗ | −0.01∗∗∗ | 0.07 |
(0.001) | (0.0001) | (0.01) | (0.002) | (0.0003) | (0.21) | (0.01) | (0.002) | (0.004) | (0.03) | (0.005) | (0.05) | |
λ(lnSt−lnS0) | 1.03∗∗∗ | 1.03∗∗∗ | 1.03∗∗∗ | 1.03∗∗∗ | 1.03∗∗∗ | 1.03∗∗∗ | 1.02∗∗∗ | 1.02∗∗∗ | ||||
(0.0004) | (0.0004) | (0.001) | (0.001) | (0.001) | (0.001) | (0.002) | (0.002) | |||||
λ−λ22σ2t | 0.90∗∗∗ | 1.00∗∗∗ | 1.04∗∗∗ | 1.05∗∗∗ | ||||||||
(0.002) | (0.002) | (0.003) | (0.004) | |||||||||
(1−λ)Δt∑n−1s=0(rs) | 1.25∗∗∗ | 1.22∗∗∗ | 1.17∗∗∗ | 1.13∗∗∗ | ||||||||
(0.11) | (0.10) | (0.10) | (0.14) | |||||||||
(1−λ)Δt∑n−1s=0(fSPs) | 3.32∗∗∗ | 2.33∗∗∗ | 1.50∗∗∗ | 1.20∗∗∗ | ||||||||
(0.27) | (0.23) | (0.24) | (0.31) | |||||||||
λΔt∑n−1s=0(fSRs) | 2.27∗∗∗ | 1.02∗∗∗ | 0.03 | −0.09 | ||||||||
(0.08) | (0.08) | (0.09) | (0.10) | |||||||||
−fIt | 13.61∗∗∗ | 4.53∗ | −3.38 | −6.47∗∗ | ||||||||
(2.70) | (2.33) | (2.35) | (2.89) | |||||||||
MI | 0.90∗∗∗ | 1.00∗∗∗ | 1.02∗∗∗ | 1.02∗∗∗ | ||||||||
(0.002) | (0.002) | (0.003) | (0.004) | |||||||||
Observations | 54 906 | 54 906 | 54 906 | 13 610 | 13 610 | 13 610 | 2 597 | 2 597 | 2 597 | 891 | 891 | 891 |
R2 | 0.99 | 0.99 | 0.00 | 1.00 | 1.00 | 0.00 | 1.00 | 1.00 | 0.00 | 1.00 | 1.00 | 0.00 |
Adjusted R2 | 0.99 | 0.99 | 0.00 | 1.00 | 1.00 | 0.00 | 1.00 | 1.00 | 0.00 | 1.00 | 1.00 | 0.00 |
Note: The dependent variable of the regression models (Ⅰ) and (Ⅱ) is the cumulative logarithmic return of CLCs and the dependent variable of the regression model (Ⅲ) is the relative model error. ∗, ∗∗ and ∗∗∗ represent p<0.1, p<0.05 and p<0.01, respectively. |
t=5 | t=20 | t=100 | t=250 | |||||||||
(Ⅰ) | (Ⅱ) | (Ⅲ) | (Ⅰ) | (Ⅱ) | (Ⅲ) | (Ⅰ) | (Ⅱ) | (Ⅲ) | (Ⅰ) | (Ⅱ) | (Ⅲ) | |
Intercept | 0.001∗∗∗ | 0.002∗∗∗ | −0.01 | 0.01∗∗∗ | 0.02∗∗∗ | 0.01∗∗∗ | 0.05∗∗∗ | 0.07∗∗∗ | 0.01∗ | 0.04∗∗∗ | 0.05∗∗∗ | 0.02∗ |
(0.0002) | (0.0001) | (0.04) | (0.0005) | (0.0003) | (0.002) | (0.001) | (0.001) | (0.005) | (0.001) | (0.001) | (0.01) | |
λ(lnSt−lnS0) | 1.02∗∗∗ | 1.02∗∗∗ | 1.02∗∗∗ | 1.02∗∗∗ | 1.01∗∗∗ | 1.01∗∗∗ | 1.01∗∗∗ | 1.01∗∗∗ | ||||
(0.0004) | (0.0004) | (0.0005) | (0.0005) | (0.001) | (0.001) | (0.0002) | (0.0002) | |||||
λ−λ22σ2t | 1.10∗∗∗ | 1.21∗∗∗ | 1.19∗∗∗ | 1.07∗∗∗ | ||||||||
(0.002) | (0.002) | (0.001) | (0.0005) | |||||||||
(1−λ)Δt∑n−1s=0(rs) | 0.98∗∗∗ | 1.02∗∗∗ | 1.01∗∗∗ | 1.02∗∗∗ | ||||||||
(0.03) | (0.02) | (0.01) | (0.002) | |||||||||
(1−λ)Δt∑n−1s=0(fSPs) | 0.95∗∗∗ | 0.88∗∗∗ | 0.88∗∗∗ | 0.98∗∗∗ | ||||||||
(0.02) | (0.01) | (0.01) | (0.002) | |||||||||
λΔt∑n−1s=0(fSRs) | 0.96∗∗∗ | 0.83∗∗∗ | 0.85∗∗∗ | 0.98∗∗∗ | ||||||||
(0.02) | (0.01) | (0.01) | (0.002) | |||||||||
−fIt | 0.99∗∗∗ | 0.84∗∗∗ | 0.98∗∗∗ | 1.00∗∗∗ | ||||||||
(0.15) | (0.08) | (0.04) | (0.01) | |||||||||
MI | 1.09∗∗∗ | 1.19∗∗∗ | 1.16∗∗∗ | 1.06∗∗∗ | ||||||||
(0.002) | (0.002) | (0.001) | (0.0004) | |||||||||
Observations | 33 892 | 33 892 | 33 892 | 33 882 | 33 882 | 33 882 | 33 824 | 33 824 | 33 824 | 33 802 | 33 802 | 33 802 |
R2 | 0.99 | 0.99 | 0.00 | 0.99 | 0.99 | 0.00 | 0.99 | 0.99 | 0.00 | 1.00 | 1.00 | 0.00 |
Adjusted R2 | 0.99 | 0.99 | 0.00 | 0.99 | 0.99 | 0.00 | 0.99 | 0.99 | 0.00 | 1.00 | 1.00 | 0.00 |
Note: The dependent variable of the regression models (Ⅰ) and (Ⅱ) is the cumulative logarithmic return of CLCs and the dependent variable of the regression model (Ⅲ) is the relative model error. ∗, ∗∗ and ∗∗∗ represent p<0.1, p<0.05 and p<0.01, respectively. |
t=5 | t=20 | t=100 | t=250 | |||||||||
(Ⅰ) | (Ⅱ) | (Ⅲ) | (Ⅰ) | (Ⅱ) | (Ⅲ) | (Ⅰ) | (Ⅱ) | (Ⅲ) | (Ⅰ) | (Ⅱ) | (Ⅲ) | |
Intercept | 0.002∗∗∗ | 0.003∗∗∗ | −0.05 | 0.01∗∗∗ | 0.02∗∗∗ | 0.02∗ | 0.03∗∗∗ | 0.04∗∗∗ | −0.01 | 0.07∗∗∗ | 0.10∗∗∗ | 0.01 |
(0.0003) | (0.0002) | (0.07) | (0.001) | (0.0003) | (0.01) | (0.001) | (0.0005) | (0.02) | (0.002) | (0.001) | (0.004) | |
λ(lnSt−lnS0) | 1.02∗∗∗ | 1.02∗∗∗ | 1.02∗∗∗ | 1.02∗∗∗ | 1.01∗∗∗ | 1.01∗∗∗ | 1.01∗∗∗ | 1.01∗∗∗ | ||||
(0.001) | (0.001) | (0.001) | (0.001) | (0.0003) | (0.0003) | (0.0004) | (0.0004) | |||||
λ−λ22σ2t | 1.17∗∗∗ | 1.26∗∗∗ | 1.13∗∗∗ | 1.13∗∗∗ | ||||||||
(0.003) | (0.002) | (0.001) | (0.001) | |||||||||
(1−λ)Δt∑n−1s=0(rs) | 1.04∗∗∗ | 1.01∗∗∗ | 1.01∗∗∗ | 1.01∗∗∗ | ||||||||
(0.05) | (0.02) | (0.01) | (0.004) | |||||||||
(1−λ)Δt∑n−1s=0(fSPs) | 0.93∗∗∗ | 0.86∗∗∗ | 0.94∗∗∗ | 0.94∗∗∗ | ||||||||
(0.04) | (0.02) | (0.004) | (0.004) | |||||||||
λΔt∑n−1s=0(fSRs) | 0.88∗∗∗ | 0.75∗∗∗ | 0.93∗∗∗ | 0.95∗∗∗ | ||||||||
(0.04) | (0.02) | (0.004) | (0.004) | |||||||||
−fIt | 1.22∗∗∗ | 0.80∗∗∗ | 0.99∗∗∗ | 1.02∗∗∗ | ||||||||
(0.25) | (0.11) | (0.03) | (0.02) | |||||||||
MI | 1.16∗∗∗ | 1.23∗∗∗ | 1.11∗∗∗ | 1.10∗∗∗ | ||||||||
(0.003) | (0.002) | (0.001) | (0.001) | |||||||||
Observations | 33 894 | 33 894 | 33 894 | 33 883 | 33 883 | 33 883 | 33 820 | 33 820 | 33 820 | 33 800 | 33 800 | 33 800 |
R2 | 0.99 | 0.99 | 0.00 | 0.99 | 0.99 | 0.00 | 1.00 | 1.00 | 0.00 | 1.00 | 1.00 | 0.00 |
Adjusted R2 | 0.99 | 0.99 | 0.00 | 0.99 | 0.99 | 0.00 | 1.00 | 1.00 | 0.00 | 1.00 | 1.00 | 0.00 |
Note: The dependent variable of the regression models (Ⅰ) and (Ⅱ) is the cumulative logarithmic return of CLCs and the dependent variable of the regression model (Ⅲ) is the relative model error. ∗, ∗∗ and ∗∗∗ represent p<0.1, p<0.05 and p<0.01, respectively. |
t=5 | t=20 | t=100 | t=250 | |||||||||
(Ⅰ) | (Ⅱ) | (Ⅲ) | (Ⅰ) | (Ⅱ) | (Ⅲ) | (Ⅰ) | (Ⅱ) | (Ⅲ) | (Ⅰ) | (Ⅱ) | (Ⅲ) | |
Intercept | 0.002∗∗∗ | 0.003∗∗∗ | −0.06 | 0.01∗∗∗ | 0.02∗∗∗ | −0.002 | 0.05∗∗∗ | 0.07∗∗∗ | 0.02∗ | 0.08∗∗∗ | 0.11∗∗∗ | 0.07∗ |
(0.001) | (0.0002) | (0.05) | (0.001) | (0.0004) | (0.01) | (0.001) | (0.001) | (0.01) | (0.002) | (0.001) | (0.04) | |
λ(lnSt−lnS0) | 1.04∗∗∗ | 1.04∗∗∗ | 1.04∗∗∗ | 1.04∗∗∗ | 1.02∗∗∗ | 1.02∗∗∗ | 1.02∗∗∗ | 1.02∗∗∗ | ||||
(0.001) | (0.001) | (0.001) | (0.001) | (0.001) | (0.001) | (0.0005) | (0.0005) | |||||
λ−λ22σ2t | 1.18∗∗∗ | 1.19∗∗∗ | 1.19∗∗∗ | 1.13∗∗∗ | ||||||||
(0.004) | (0.002) | (0.001) | (0.001) | |||||||||
(1−λ)Δt∑n−1s=0(rs) | 1.20∗∗∗ | 1.02∗∗∗ | 0.99∗∗∗ | 1.02∗∗∗ | ||||||||
(0.08) | (0.03) | (0.01) | (0.01) | |||||||||
(1−λ)Δt∑n−1s=0(fSPs) | 1.03∗∗∗ | 0.98∗∗∗ | 0.94∗∗∗ | 1.00∗∗∗ | ||||||||
(0.06) | (0.03) | (0.01) | (0.005) | |||||||||
λΔt∑n−1s=0(fSRs) | 1.00∗∗∗ | 0.86∗∗∗ | 0.86∗∗∗ | 0.94∗∗∗ | ||||||||
(0.06) | (0.02) | (0.01) | (0.005) | |||||||||
−fIt | 0.92∗∗ | 1.05∗∗∗ | 0.97∗∗∗ | 1.01∗∗∗ | ||||||||
(0.38) | (0.16) | (0.05) | (0.03) | |||||||||
MI | 1.18∗∗∗ | 1.19∗∗∗ | 1.17∗∗∗ | 1.11∗∗∗ | ||||||||
(0.004) | (0.002) | (0.001) | (0.001) | |||||||||
Observations | 33 800 | 33 800 | 33 800 | 33 741 | 33 741 | 33 741 | 33 570 | 33 570 | 33 570 | 33 451 | 33 451 | 33 451 |
R2 | 0.97 | 0.97 | 0.00 | 0.98 | 0.98 | 0.00 | 0.99 | 0.99 | 0.00 | 1.00 | 1.00 | 0.00 |
Adjusted R2 | 0.97 | 0.97 | 0.00 | 0.98 | 0.98 | 0.00 | 0.99 | 0.99 | 0.00 | 1.00 | 1.00 | 0.00 |
Note: The dependent variable of the regression models (Ⅰ) and (Ⅱ) is the cumulative logarithmic return of CLCs and the dependent variable of the regression model (Ⅲ) is the relative model error. ∗, ∗∗ and ∗∗∗ represent p<0.1, p<0.05 and p<0.01, respectively. |
t=5 | t=20 | t=100 | t=250 | |||||||||
(Ⅰ) | (Ⅱ) | (Ⅲ) | (Ⅰ) | (Ⅱ) | (Ⅲ) | (Ⅰ) | (Ⅱ) | (Ⅲ) | (Ⅰ) | (Ⅱ) | (Ⅲ) | |
Intercept | 0.001 | −0.002∗∗∗ | 0.004 | 0.001 | −0.002∗∗∗ | 0.27 | −0.01 | −0.004∗∗ | 0.003 | −0.06∗∗ | −0.01∗∗∗ | 0.07 |
(0.001) | (0.0001) | (0.01) | (0.002) | (0.0003) | (0.21) | (0.01) | (0.002) | (0.004) | (0.03) | (0.005) | (0.05) | |
λ(lnSt−lnS0) | 1.03∗∗∗ | 1.03∗∗∗ | 1.03∗∗∗ | 1.03∗∗∗ | 1.03∗∗∗ | 1.03∗∗∗ | 1.02∗∗∗ | 1.02∗∗∗ | ||||
(0.0004) | (0.0004) | (0.001) | (0.001) | (0.001) | (0.001) | (0.002) | (0.002) | |||||
λ−λ22σ2t | 0.90∗∗∗ | 1.00∗∗∗ | 1.04∗∗∗ | 1.05∗∗∗ | ||||||||
(0.002) | (0.002) | (0.003) | (0.004) | |||||||||
(1−λ)Δt∑n−1s=0(rs) | 1.25∗∗∗ | 1.22∗∗∗ | 1.17∗∗∗ | 1.13∗∗∗ | ||||||||
(0.11) | (0.10) | (0.10) | (0.14) | |||||||||
(1−λ)Δt∑n−1s=0(fSPs) | 3.32∗∗∗ | 2.33∗∗∗ | 1.50∗∗∗ | 1.20∗∗∗ | ||||||||
(0.27) | (0.23) | (0.24) | (0.31) | |||||||||
λΔt∑n−1s=0(fSRs) | 2.27∗∗∗ | 1.02∗∗∗ | 0.03 | −0.09 | ||||||||
(0.08) | (0.08) | (0.09) | (0.10) | |||||||||
−fIt | 13.61∗∗∗ | 4.53∗ | −3.38 | −6.47∗∗ | ||||||||
(2.70) | (2.33) | (2.35) | (2.89) | |||||||||
MI | 0.90∗∗∗ | 1.00∗∗∗ | 1.02∗∗∗ | 1.02∗∗∗ | ||||||||
(0.002) | (0.002) | (0.003) | (0.004) | |||||||||
Observations | 54 906 | 54 906 | 54 906 | 13 610 | 13 610 | 13 610 | 2 597 | 2 597 | 2 597 | 891 | 891 | 891 |
R2 | 0.99 | 0.99 | 0.00 | 1.00 | 1.00 | 0.00 | 1.00 | 1.00 | 0.00 | 1.00 | 1.00 | 0.00 |
Adjusted R2 | 0.99 | 0.99 | 0.00 | 1.00 | 1.00 | 0.00 | 1.00 | 1.00 | 0.00 | 1.00 | 1.00 | 0.00 |
Note: The dependent variable of the regression models (Ⅰ) and (Ⅱ) is the cumulative logarithmic return of CLCs and the dependent variable of the regression model (Ⅲ) is the relative model error. ∗, ∗∗ and ∗∗∗ represent p<0.1, p<0.05 and p<0.01, respectively. |