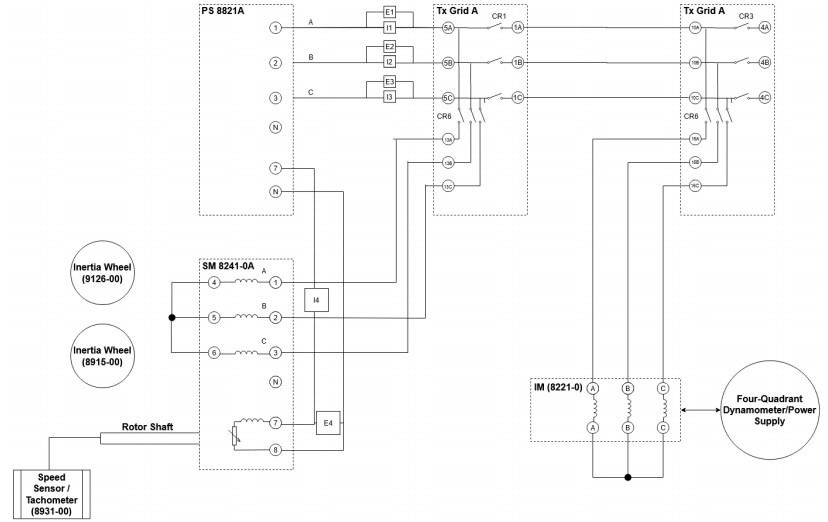
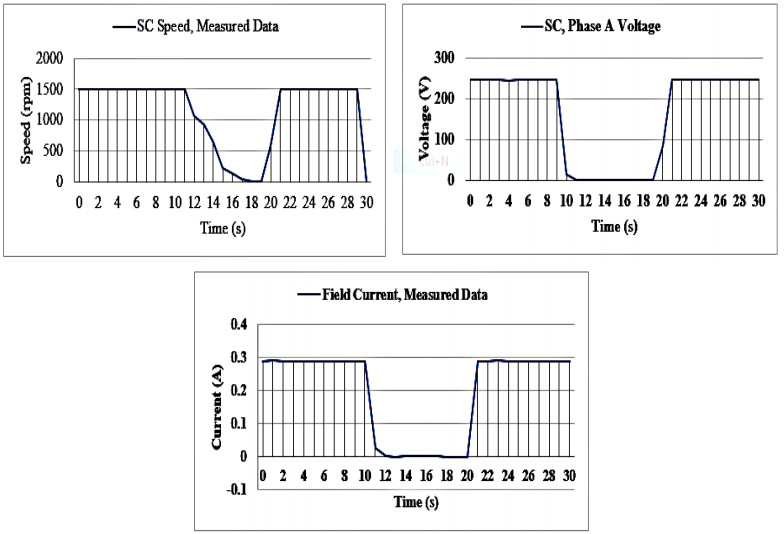
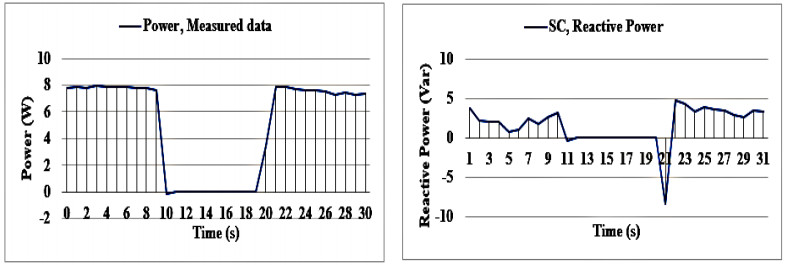
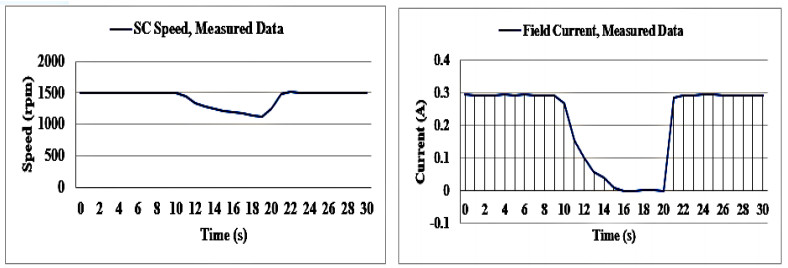
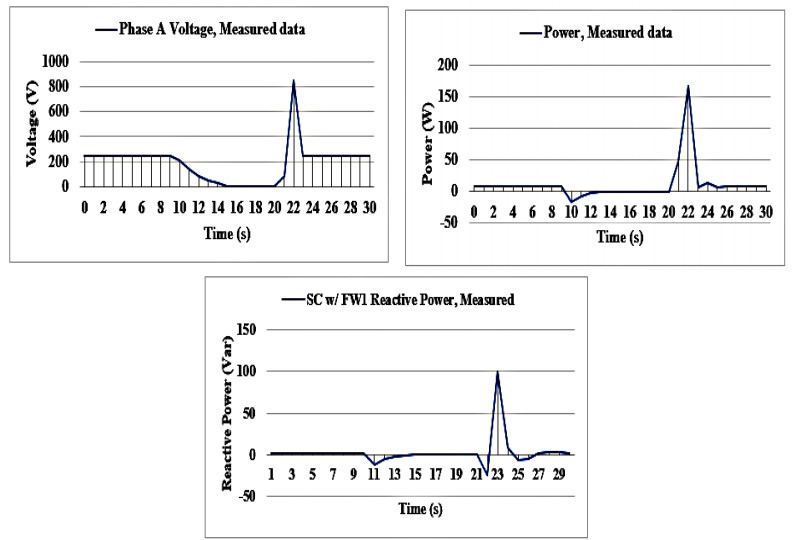
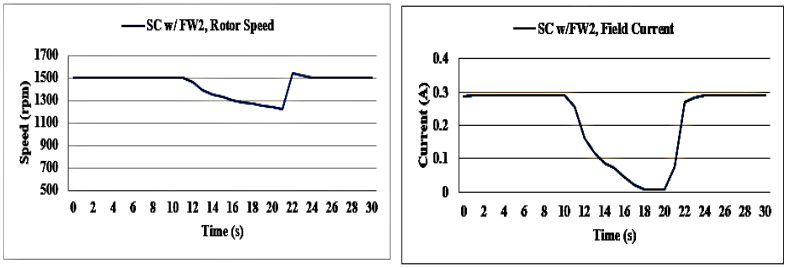
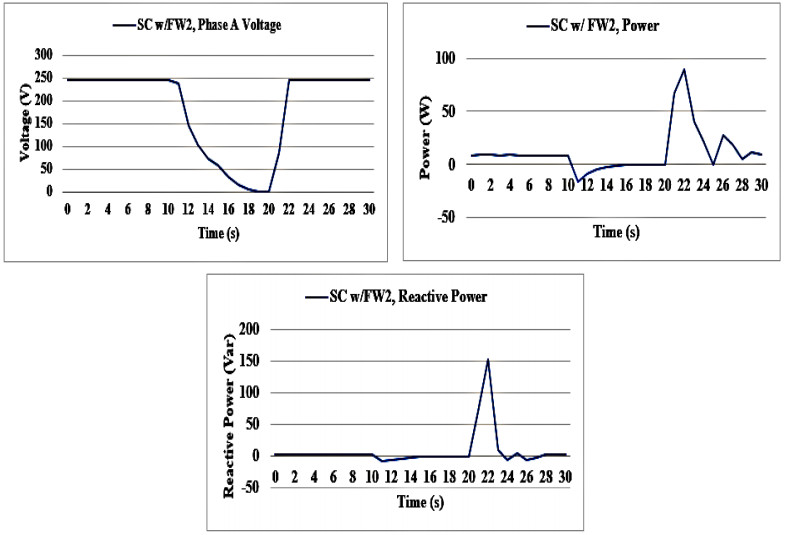
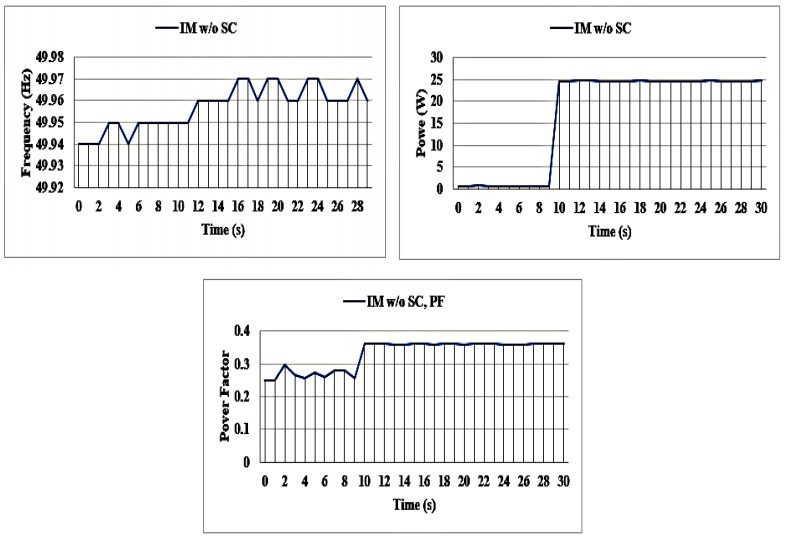
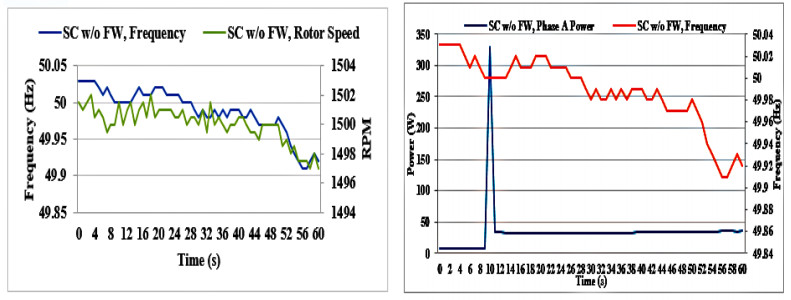
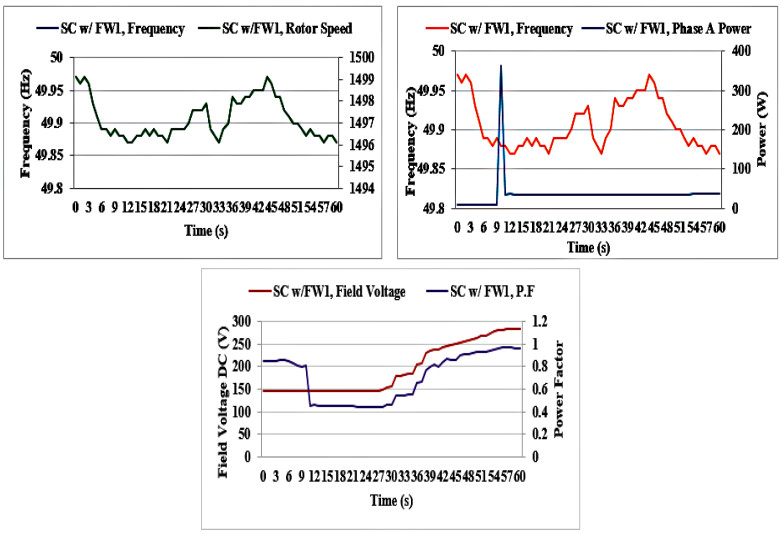
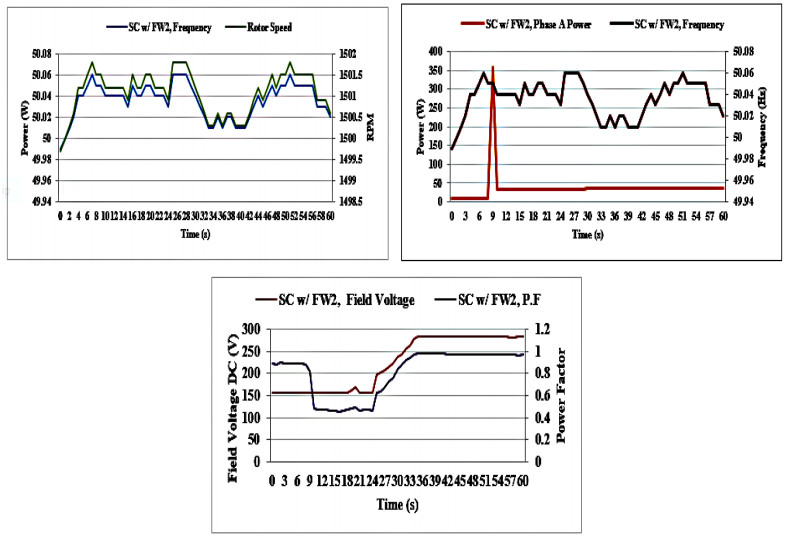
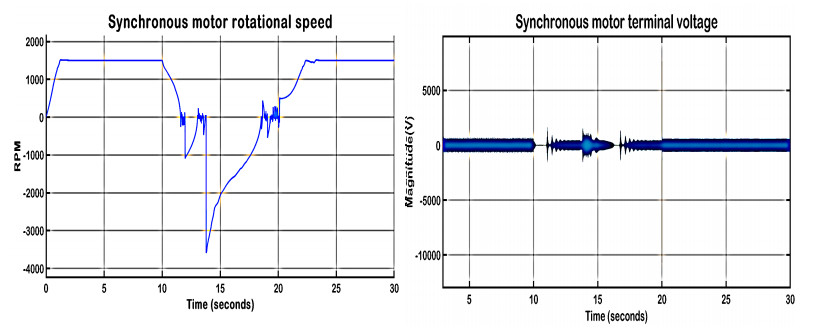
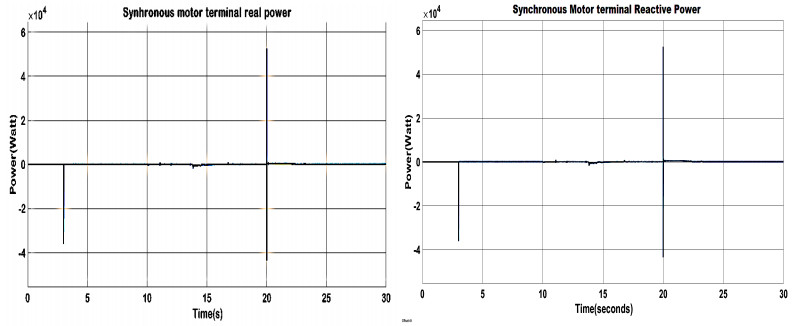
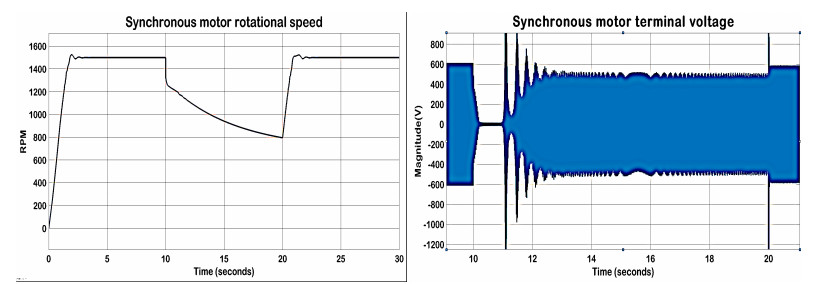
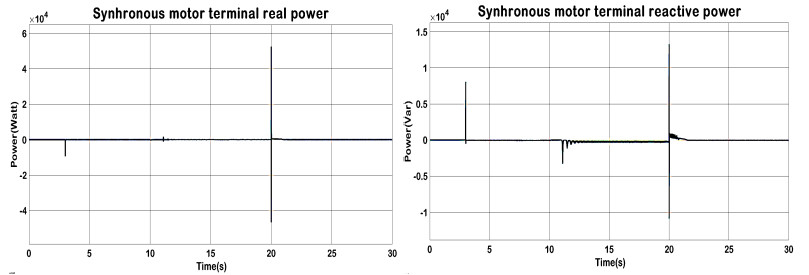
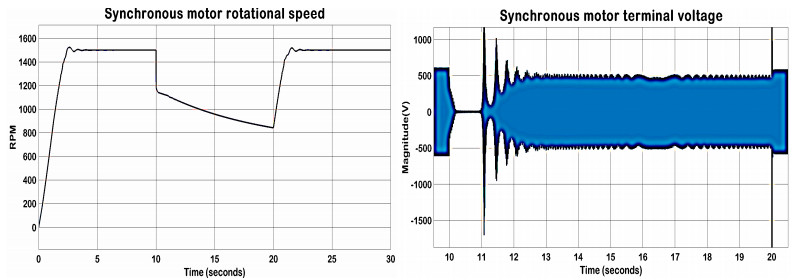
This paper studies the integration of flywheel energy storage system (FESS) to a synchronous condenser (SC) and its effect on the stability margin of the power system. To show the applicability of FESS-integrated SC in mitigating sudden power loss and sudden load implementation, the experimental and simulation results are presented.
Citation: Parveen Tania, Sanjari Mohammad J., Arace Luke. Inertia compensation of power grid with flywheel-integrated synchronous condenser[J]. AIMS Energy, 2023, 11(3): 404-422. doi: 10.3934/energy.2023021
This paper studies the integration of flywheel energy storage system (FESS) to a synchronous condenser (SC) and its effect on the stability margin of the power system. To show the applicability of FESS-integrated SC in mitigating sudden power loss and sudden load implementation, the experimental and simulation results are presented.

| [1] | Igbinovia FO (2019) Reactive power compensation in modern electricity grid architecture with the synchronous condenser. PhD thesis, Czech Technical University in Prague. |
| [2] |
Balint H, Istvan V, Istvan T (2019) Effect of decreasing synchronous inertia on power dynamics-overview of recent experiences and marketisation of services. Int Trans Electr Energy Syst 29: e12128. https://doi.org/10.1002/2050-7038.12128 doi: 10.1002/2050-7038.12128

|
| [3] |
Mustafa EA, Keith RP (2019) Combination of synchronous condenser and synthetic inertia for frequency stability enhancement in low-inertia systems. IEEE Trans Sustainable Energy 10: 997–1005. https://doi.org/10.1109/TSTE.2018.2856938 doi: 10.1109/TSTE.2018.2856938
|
| [4] | Kaushik D, Feng G, Edgar N (2020) Frequency stability of power system with large share of wind power under storm conditions. Modern Power Syst Clean Energy |
| [5] | AEMO. Black system in South Australia on Wednesday 28 September 2016. |
| [6] | Zhou L, Qi ZP (2019) Modeling and control of a flywheel energy storage system for uninterruptible power supply. IEEE, 2009 International Conference on Sustainable Power Generation and Supply. https://doi.org/10.1109/SUPERGEN.2009.5348077 |
| [7] | Gu H, Yan R, Saha T (2019) Review of system strength and inertia requirements for the national electricity market of Australia. CSEE J Power Energy Syst 5: 295–305. |
| [8] |
Gu HJ, Yanand RF, Saha T (2018) Minimum synchronous inertia requirement of renewable power systems. IEEE Trans Power Syst 33:1533–1543. https://doi.org/10.1109/TPWRS.2017.2720621 doi: 10.1109/TPWRS.2017.2720621
|
| [9] | Li F, John K, Tom R (2006) A preliminary analysis of the economics of using distributed energy as a source of reactive power supply. The U.S. Department of Energy. https://doi.org/10.2172/930730 |
| [10] |
Rezkalla M, Pertl M, Marinelli M (2018) Electric power system inertia: requirements, challenges and solutions. Electr Eng 100: 2677–2693. https://doi.org/10.1007/s00202-018-0739-z doi: 10.1007/s00202-018-0739-z
|
| [11] |
Bolund B, Bernhoff H, Leijon M (2007) Flywheel energy and power storage systems. Renewable Sustainable Energy Rev 11: 235–258. https://doi.org/10.1016/j.rser.2005.01.004 doi: 10.1016/j.rser.2005.01.004
|
| [12] |
Zhang Y, Zhang X, Qian T (2020) Modeling and simulation of a passive variable inertia flywheel for diesel generators. Energy Rep 6: 58–68. https://doi.org/10.1016/j.egyr.2020.01.001 doi: 10.1016/j.egyr.2020.01.001
|
| [13] |
Mohanan V, Mareels MYI, Evans JR (2020) Stabilising influence of a synchronous condenser in low inertia networks. IET Gener Transm Distrib 14: 3582–3593. https://doi.org/10.1049/iet-gtd.2020.0178 doi: 10.1049/iet-gtd.2020.0178
|
| [14] |
Teleke S, Abdulahovic T, Thiringer T (2008) Dynamic performance comparison of synchronous condenser and SVC. IEEE Trans Power Deliv 23: 1606–1612. https://doi.org/10.1109/TPWRD.2007.916109 doi: 10.1109/TPWRD.2007.916109
|
| [15] | Igbinovia OF, Fandi G, Zden (2016) Optimal location of the synchronous condenser in electric-power system networks. 1–6. https://doi.org/10.1109/EPE.2016.7521731 |
| [16] | Palone F, Gatta FM, Geri A, et al. (2019) New synchronous condenser-flywheel systems for a decarbonized sardinian power system. IEEE Milan PowerTech 1–6. https://doi.org/10.1109/PTC.2019.8810780 |
| [17] | Liu Y, Yang S, Zhang S, et al. (2014) Comparison of synchronous condenser and STATCOM for inertial response support. 2014 IEEE Energy Conversion Congress and Exposition (ECCE), Pittsburgh, PA, USA, 2684–2690. https://doi.org/10.1109/ECCE.2014.6953761 |
| [18] |
Nguyen TH, Yang G, Nielsen AH (2019) Combination of synchronous condenser and synthetic inertia for frequency stability enhancement in low-inertia systems. IEEE Trans Sustainable Energy 10: 997–1005. https://doi.org/10.1109/TSTE.2018.2856938 doi: 10.1109/TSTE.2018.2856938
|
| [19] |
Saarinen L, Norrlund P, Yang W (2017) Linear synthetic inertia for improved frequency quality and reduced hydropower wear and tear. Int J Electri Power Energy Syst 98: 488–495. https://doi.org/10.1016/j.ijepes.2017.12.007 doi: 10.1016/j.ijepes.2017.12.007
|
| [20] | ABB Australia (2020) Synchronous condenser packages: Solving the challenges of renewable energy integration. |
| [21] | Jia J, Yang G, Nielsen AH, et al. (2017) Synchronous condenser allocation for improving system short circuit ratio. 2018 5th International Conference on Electric Power and Energy Conversion Systems (EPECS), Kitakyushu, Japan, 1–5. https://doi.org/10.1109/EPECS.2018.8443358 |
| [22] | Labvolt (2020) Available from: https://www.labvolt.com/about_us. |
| [23] | J Gonçalves de Oliveira (2011) Power control systems in a flywheel based all-electric driveline. 2011: 102. Uppsala: Acta Universitatis Upsaliensis. Available from: http://www.diva-portal.org/smash/record.jsf?pid = diva2%3A434755 & dswid = 7105. |
| [24] |
Amiryar ME, Pullen KR (2017) A Review of flywheel energy storage system technologies and their applications. Appl Sci 7: 286. https://doi.org/10.3390/app7030286 doi: 10.3390/app7030286
|
| [25] | Fooladivanda D, Mancini G, Garg S (2014) State of charge evolution equations for flywheels. Available from: https://arXiv.org/pdf/1411.1680. |
| [26] |
Freeman E, Occello D, Barnes F (2016) Energy storage for electrical systems in the USA. AIMS Energy 4: 856–875. https://doi.org/10.3934/energy.2016.6.856 doi: 10.3934/energy.2016.6.856
|
| [27] | Gonzalez F, Sumper A, Bellimunt O (2012) Modeling and validation of a flywheel energy storage Lab-Setup. IEEE PES Innovative Smart Grid Technologies Europe (ISGT Europe), Berlin. |
| [28] | Pullen KR (2022) Flywheel energy storage. Storing Energy (Second Edition), 207–242. https://doi.org/10.1016/B978-0-12-824510-1.00035-0 |
| [29] |
Amiryar ME, Pullen KR, Nankoo D (2018) Development of a high-fidelity model for an electrically driven energy storage flywheel suitable for small scale residential applications. Appl Sci 8: 1–29. https://doi.org/10.3390/app8030453 doi: 10.3390/app8030453
|
| [30] |
Ulbig A, Borsche TS, Andersson G (2014) Impact of low rotational inertia on power system stability and operation. IFAC Proc Vol 47: 7290–7297. https://doi.org/10.3182/20140824-6-ZA-1003.02615 doi: 10.3182/20140824-6-ZA-1003.02615
|
| [31] |
Zeng F, Zhang J, Chen G, et al. (2020) Online estimation of power system inertia constant under normal operating conditions. IEEE Access 8: 101426–101436. https://doi.org/10.1109/ACCESS.2020.2997728 doi: 10.1109/ACCESS.2020.2997728
|
| [32] |
Ashton P, Saunders C, Taylor G, et al. (2015) Inertia estimation of the GB power system using synchrophasor measurements. IEEE Trans Power Syst 30: 701–709. https://doi.org/10.1109/TPWRS.2014.2333776 doi: 10.1109/TPWRS.2014.2333776
|
| [33] |
Taher AM, Hasanien HM, Abdel Aleem SHE, et al. (2023) Optimal model predictive control of energy storage devices for frequency stability of modern power systems. J Energy Storage 57: 106310. https://doi.org/10.1016/j.est.2022.106310 doi: 10.1016/j.est.2022.106310
|
| [34] |
Hany HM, Tostado-Véliz M, Turky RA, et al. (2022) Hybrid adaptive controlled flywheel energy storage units for transient stability improvement of wind farms. J Energy Storage 54: 105262. https://doi.org/10.1016/j.est.2022.105262 doi: 10.1016/j.est.2022.105262
|

Figures(19)

Parveen Tania, Sanjari Mohammad J., Arace Luke. Inertia compensation of power grid with flywheel-integrated synchronous condenser[J]. AIMS Energy, 2023, 11(3): 404-422. doi: 10.3934/energy.2023021


 DownLoad: