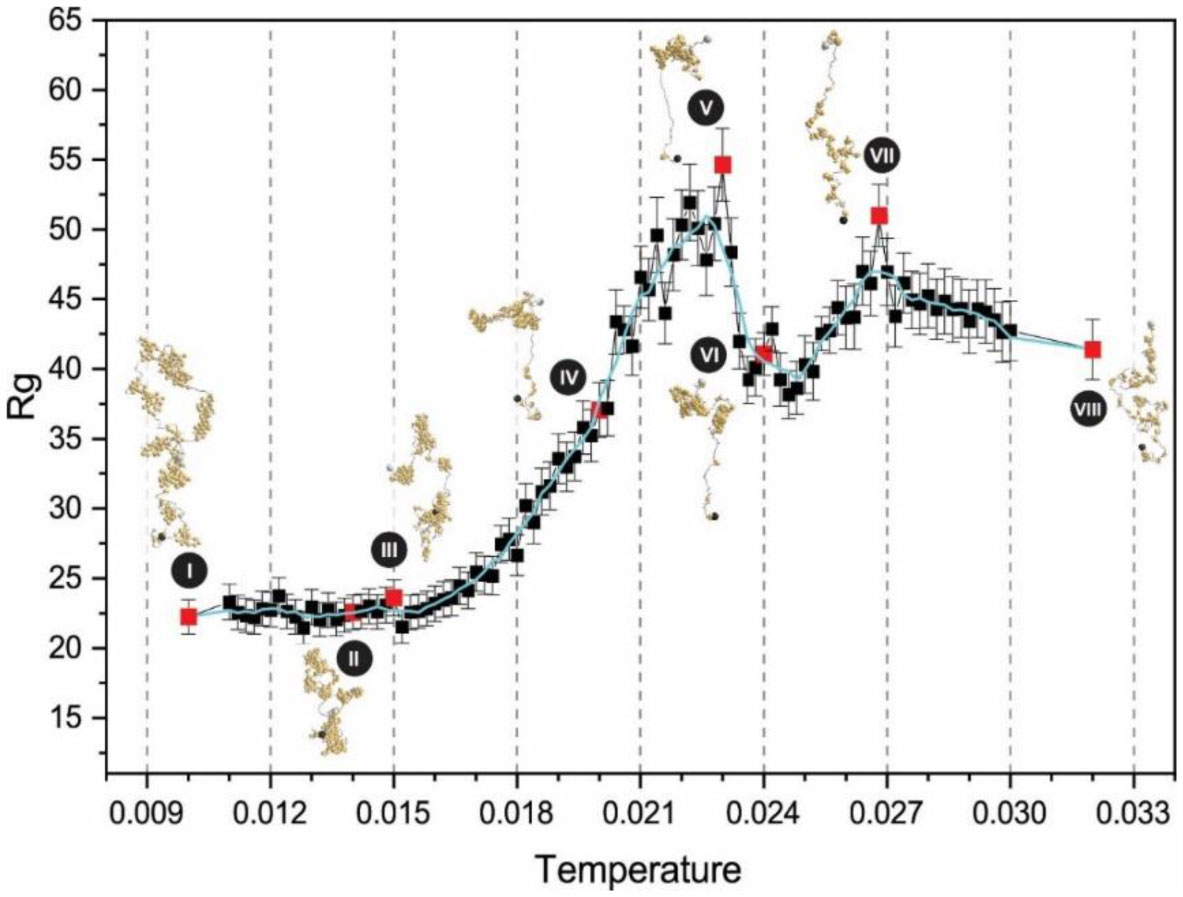
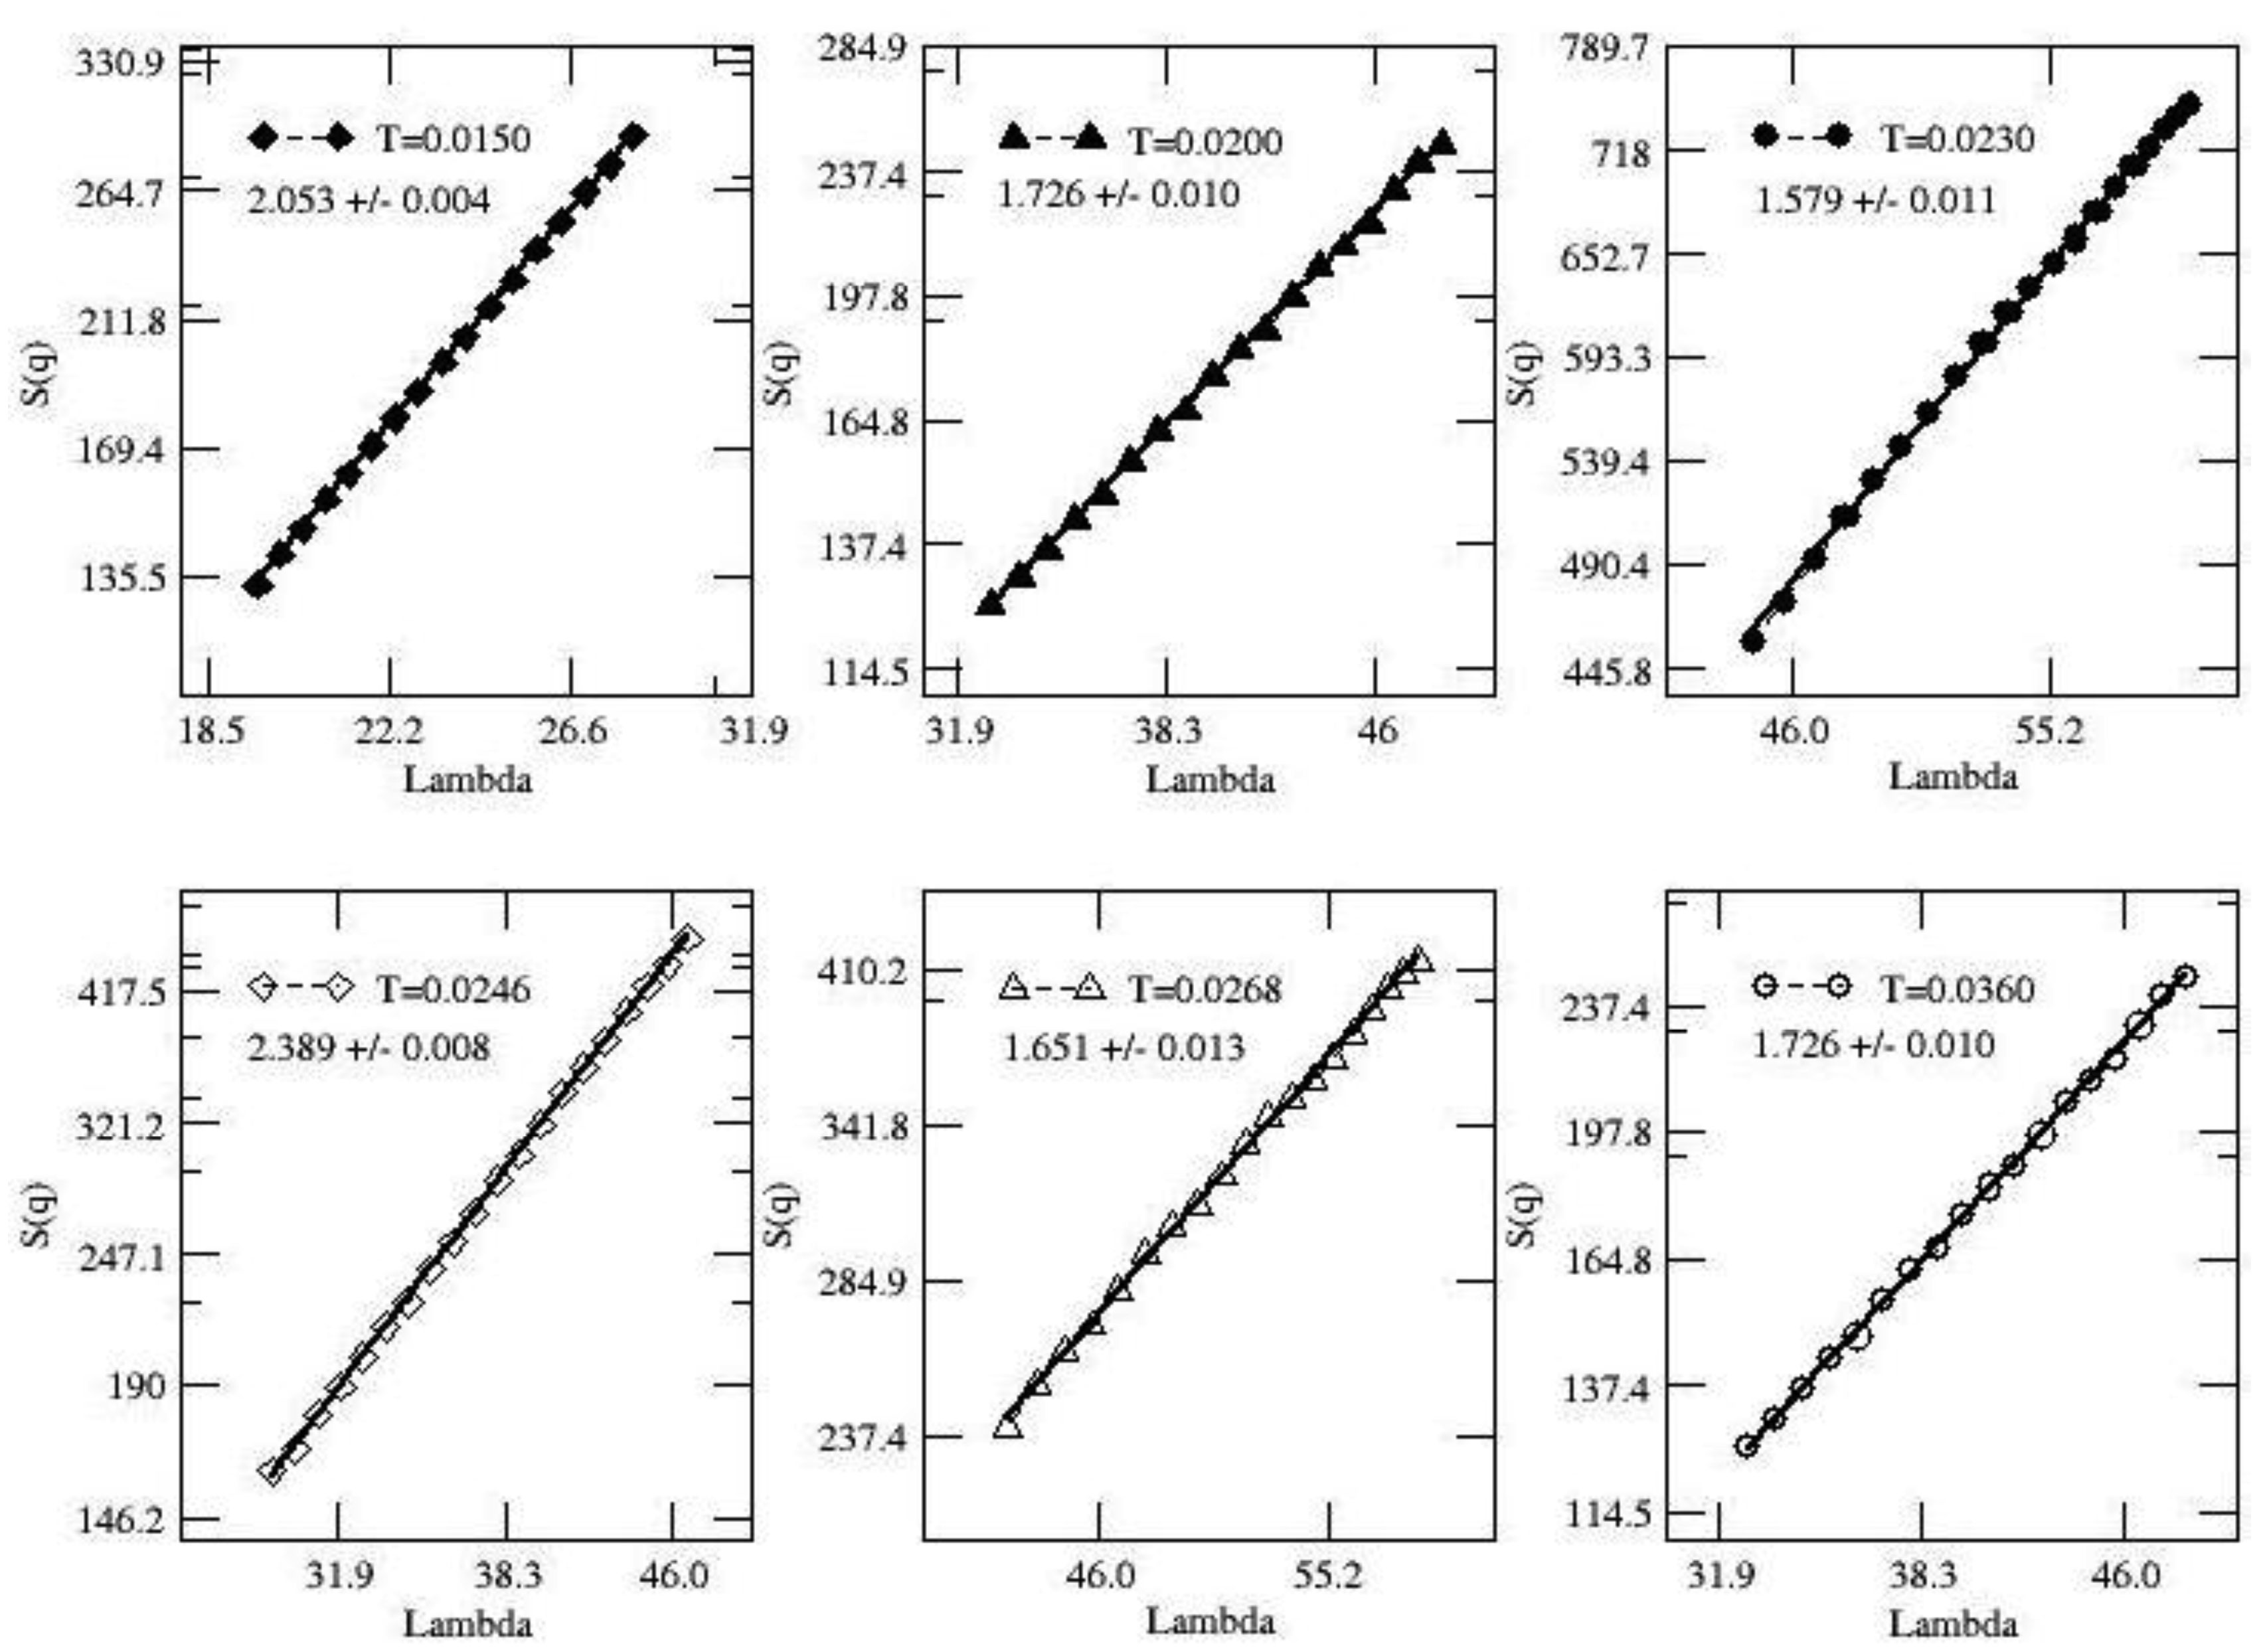
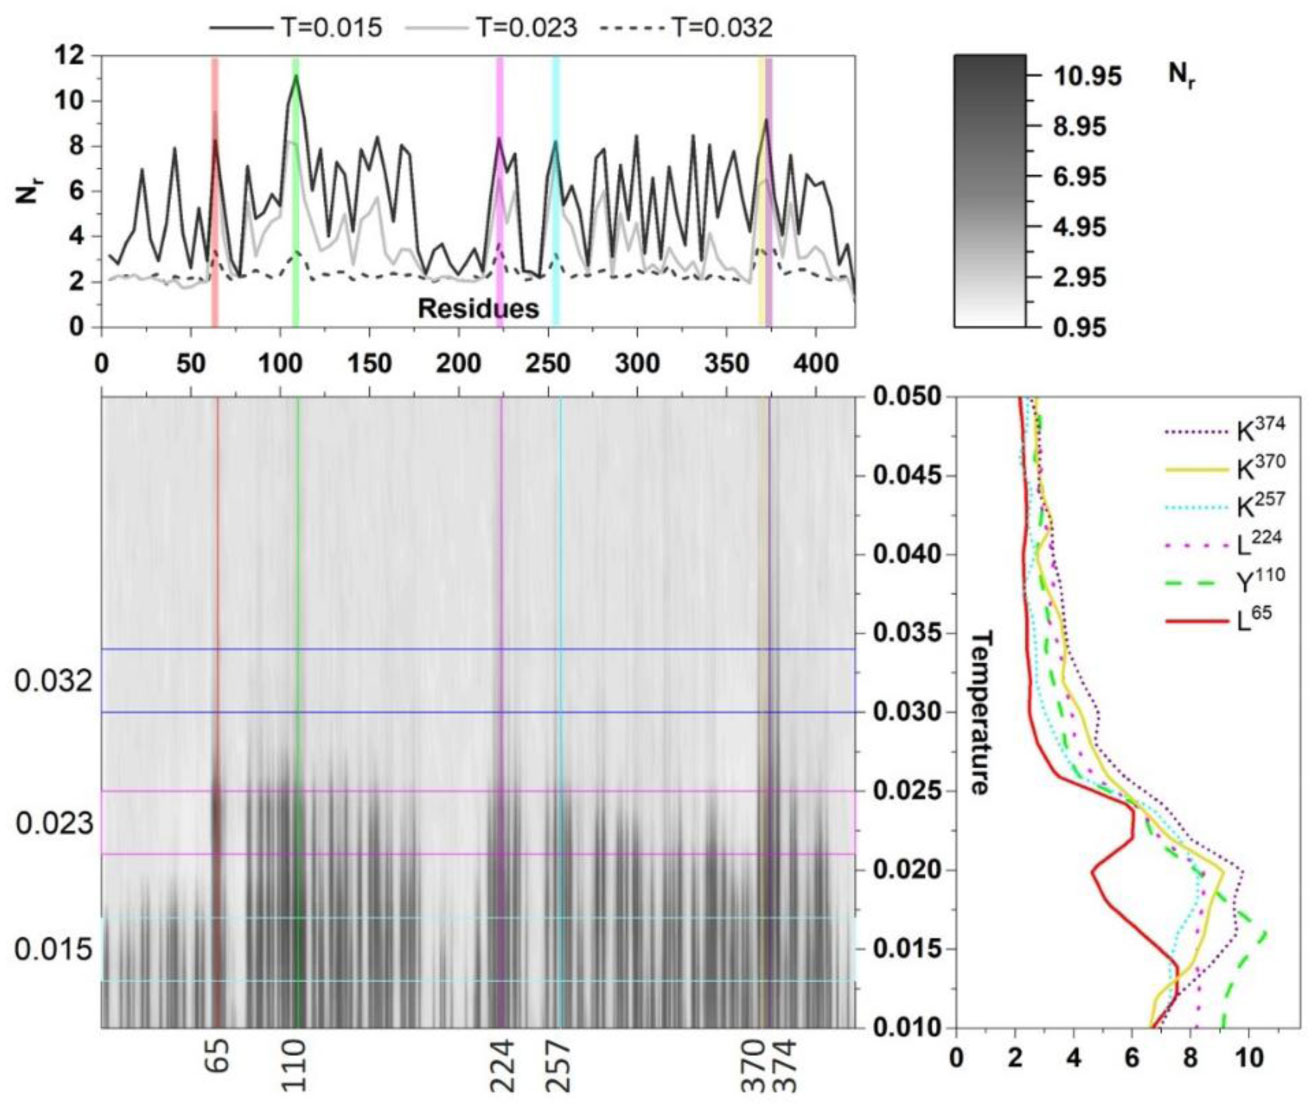
Unfolding of a coarse-grained COVN protein from its native configuration shows a linear response with increasing temperature followed by non-monotonic double peaks in its radius of gyration. The protein conforms to a random coil of folded segments in native state with increasingly tenuous and globular structures in specific temperature regimes where the effective dimensions of corresponding structures D ≈ 1.6–2.4. Thermal agitation alone is not sufficient to fully eradicate its segmental folding as few local folds are found to persist around such residues as 65L, 110Y, 224L, 374P even at high temperatures.
1.
Introduction
Mobile phones are commonly used in everyday life. The number of smartphone users in the world today is about 3.5 billion, which means that approximately 45% of the world's population owns a smartphone [1]. The constant growing number of mobile devices in use is a reason for rising concerns and fears in some communities, especially when it comes to the issue of human exposure to artificial electromagnetic fields.
According to in-vitro and in-vivo studies, absorption of electromagnetic radiation can cause thermal and non-thermal effects, which may potentially manifest as various disorders in the human body. The thermal effects of RF-EMF caused by heat absorption causing an increase in tissue temperature have been widely reported and generally accepted in the literature [1],[2]. On the other hand, non-thermal health effects have been studied for years and, so far, there has been no strong evidence proving that such exposure increases the risk of studied diseases [2]–[4]. Some authors reported possible adverse health effects, such as cancers [5]–[7], electromagnetic hypersensitivity (EHS) [8],[9], impairment in the functioning of the nervous system [10], sleep problems [11],[12], and reproductive system disorders [13]; however, these results remain highly inconclusive and the skepticism regarding some studies' quality has been raised [14].
Thermal effect is defined as a rise in temperature because of exposure and mainly concerns the superficial layers of the human body, especially skin covering body parts the closest to the source of radiation. Infrared thermography has proved its high usefulness in analyzing the changes in skin temperature resulting from mobile phone use and has been utilized in numerous studies on this subject. It has been shown that the degree of local tissue temperature increase is dependent on the mobile phone parameters, including SAR ratings, operational frequencies, antenna position, and battery capacity [15]–[17] [1]. Infrared thermography has been also used for quantitative analysis of localized surface heating depending on whether the mobile phone was in contact with the skin or not [15],[16], and to examine heating differences while using a smartphone in normal and flight mode [2].
The commonly used unit for measurement of the amount of radiofrequency energy (RF EMF) absorbed by the body is the Specific Absorption Rate (SAR). SAR measurements are used for the mobile phones' compliance assessment and are expressed in W/kg. Many people mistakenly assume that using phones with a lower reported SAR value, rather than using a mobile phone with a high SAR, decreases a user's exposure to RF EMF emissions. However, because of numerous factors influencing the real exposure to RF-EMF in addition to SAR value [18], it cannot be used as a single indicator of exposure. While SAR values are an important tool in judging the maximum possible exposure to RF EMF from a particular model of smartphone, a single value does not provide sufficient information about the amount of RF EMF exposure under typical usage conditions.
On the other hand, some studies focused on the role of mobile phones not only as a RF-EMF source, but as a significant heat source [15],[16]. Humans can control their heat production and heat loss rates to maintain a nearly constant core temperature of 37°C under a wide range of environmental conditions. Using a mobile phone may disturb some physiological and physical skin mechanisms, such as convection on the skin surface and increased skin blood perfusion, causing us to ask the following question: What can lead to a cumulative imbalance manifesting in the change of local temperature of the skin surface.
Infrared thermal imaging studies to measure local temperature rises caused by handheld mobile phones have been performed many times[1],[2],[15],[16]. However, they focused on the comparison of thermal effects obtained from phones operating at different parameters (different SAR values, battery capacity), skin contact modes and/or time of exposition [2],[15],[16]. In comparison to previous studies, our innovations have consisted of the application of the additional OFF-mode phone to verify the potential inhibition of heat dissipation from the surface of the auricle region. Studies have also been conducted on slightly smaller populations (up to 20) and have shown a dependence of heat accumulation on gender [2]; in our study, realistic conditions of standardized conservation for a larger group of subjects with the same gender were provided, including the electric power density control in the measurement room. In addition, due to complexity and spatial inhomogeneities in thermal structures [19], commonly accepted values of standard heat flux coefficients cannot be applied for theoretical estimations of heat transfer, therefore based on the measurements of parameters describing sources of energy, the heat transfer model, supported by experiment, reflecting an imbalance of the thermoregulation process caused by the phone being in direct contact with the skin surface, was developed.
Our aim of the study is to identify the real mechanism underlying the skin temperature increase because of human auricular region exposure to smartphone operating in different modes. Using the data obtained with the use of infrared thermography we aimed to quantitatively distinguish and assess the factors influencing temperature increase on the surface of the auricle region, with a particular emphasis on the role of RF EMF exposure.
Our second purpose is to develop a quantitative model to describe the heat transfer between the mobile phone and the ear.
2.
Materials and methods
The study was conducted for a group of 40 men aged from 18 to 65 years. The study complies with the declaration of Helsinki and ethical approval was obtained from the Jagiellonian University bioethics committee (Date 23 January 2020/No.1072.6120.10.2020). Exclusion criteria included acute medical conditions during enrolment meeting or uncontrolled chronic diseases.
2.1. Procedure
Sixty minutes before the experiment, participants were not allowed to drink hot drinks, eat, or smoke cigarettes. Each participant was tested using a mobile phone working in three different modalities in the same order: OFF, FLIGHT, and ON. Before each provocation session participants were given 30 minutes in a sitting position to adapt their skin temperature to the room temperature. During these 30-minute breaks, participants were asked to remain in a stable, sitting position and not to use any electronic devices. At the beginning of each session, the distributions of temperature of both ears and smartphone were acquired using a thermographic camera to confirm the temperature stabilization. Then, the subject performed a simulated 15-minute phone call with the phone placed against the auricular region (same ear during each session, side selection left to the discretion of participant) followed immediately by another thermogram of both ears and smartphone. After a 60-minute break and confirmation of stable skin temperature, the next session was conducted, and then the third followed the same procedure.
2.2. Equipment
All thermographic measurements were performed in an air-conditioned room set at a constant room temperature. The ambient temperature was controlled (T0 = 25.0 °C) by the air-conditioning system, and variations in air temperature between individual measurements did not exceed 1 °C.
The thermographic camera (VIGO, Warsaw, Poland), operating in the range of 8–12 µm, was used to measure the temperature distributions of the auricle region and to study the smartphone before and after each exposure session. The camera was originally designed to register temperatures between 15 and 49 °C, with a thermal sensitivity of 0.05 °C at 30 °C. At the beginning of each experimental day, proper calibration of the cameras was confirmed with the use of equipment provided by the manufacturer, as recommended in the manual. The emissivity of soft tissues, regardless of skin tone, is known to be ϵ = 0.98 ± 0.01 for a λ of > 2 µm [15] and was set in the control software of the thermal camera used for auricular region measurement. In the camera used for smartphone temperature measurement, the properties were set acaccordingo the value of glass emissivity (ϵ = 0.92 ± 0.01 for a λ of >2 µm). Uncertainty of temperature measurement taken with thermo-camera was determined experimentally as equal to 0.2 °C with the use of a homogenously heated surface. The standard error of the mean temperature change (SEM) was calculated to show how different the population mean is likely to be from a sample mean.
Thermograms of the auricular region were taken from the lateral view of the left- and right-hand side of the head just before and immediately after a simulated phone call. A smartphone thermogram was obtained with a separate camera in a pre-arranged spot in the study room.
During the simulated phone call, the smartphone was held with the participant's hand in direct, light contact with the skin of the auricular region. Participants were asked to avoid excessive rubbing and to keep the phone in a stable position throughout the session; however, to mimic regular phone calls, no additional measures were taken. Although some variability in terms of smartphone placement between subjects cannot be excluded, this method has been previously described [16] and best reflects real life situations.
2.3. Exposure
Exposure of each participant was assessed following the methodology used previously by the authors in a similar study concerning exposure to RF-EMF originating from activated mobile phones [20].
For the assessment of near-field exposure, Received Signal Strength Indicator (RSSI) and Specific Absorption Rate (SAR) were used. During exposure sessions RSSI values were continuously measured and retrospectively controlled. All the participants received exposure at an arbitrary mean value of RSSI between −90 and −80 dBm. The SAR quantifies the absorption of RF-EMF in tissues, and for the human body, it depends on the dielectric properties of tissues due to the complexity of the human head anatomy its estimation is a subject of great challenge [21],[22] and for the phone used (Huawei P20 Lite), it was reported as 0.75 W/kg in the manual.
For the far-field exposure a personal exposure meter (ExpoM-RF, Zurich, Switzerland) performing a spectral analysis of RF-EMF within 16 different frequency bands from 87.5 MHz up to 5.875 GHz was used. Based on electric field strength, the power density was calculated as 45 µW. The uplink and downlink radiation remained on a comparable level throughout a simulated phone call.
In OFF mode, the smartphone was switched off, while in FLIGHT mode, there was no connection with the GSM network, so music was constantly playing. In ON mode, the mobile phone was fully connected to the GSM network and the smartphone was operating at a frequency of 1800 MHz.
2.4. Statistical methods
The areas of the auricle regions and smartphone front surface (ROI) were segmented on the obtained thermograms before and after the phone call simulation. The software provided by the producer of the thermal camera was then used to obtain the average temperatures of analyzed ROIs. Then, the differences in the temperature before and after each analyzed exposure session were calculated. Due to software limitations, pre- and post-experimental ROIs were segmented manually and separately, so they could not always be identical. Nonetheless, the pre-study analyses showed that the potential impact of such limitations is negligible with standardized study conditions.
To determine statistical differences between operating mode and differences in temperature rise between the ears, a non-parametric Kolmogorov–Smirnov test was used at α = 0.05 [23].
2.5. Theory
A heat balance model concerning the most important thermal processes involved in the final temperature stabilization in the auricle region during smartphone use was developed. To verify and confirm the proposed hypothesis, we compared the calculations from our model with the data obtained from thermographic measurements of the auricle region in the study group.
The values used in the model are presented in Table 1. Some parameters of the proposed model were taken from the literature [24],[25], but some were estimated. The model output was confirmed in simple experiments. It was assumed that all objects are lumped thermal capacity objects. In this approach, the temperature of the solid body is assumed to be a function of time, which means that the temperature must be spatially independent. This assumption can be made for Biot numbers (Bi = hLc/k, where Lc = V/AS, Bi – Biot number, h – convective heat transfer coefficient, k – thermal conductivity of the body, V – volume, AS – area) smaller than 1[26]. For the skin layer Biot number was estimated as Bi = 0.017, therefore, the error associated with using the lumped capacitance method is small [17]. Figure 1 presents a diagram schematically representing the physical model.
Initially, in our approach, all investigated heat sources (the smartphone and the ear) are treated separately to find their properties and all necessary parameters. Finally, they are combined in the final model describing the heat transfer in the applied provocation test.
2.6. Description of the smartphone as a heat source
The process of heat transfer can be mathematically based on first-order differential equations. The second crucial simplification to be made was that heat losses are mainly related to convection and radiation. In the model, the heat transfer caused by convection qCON may be expressed as
whilst the radiation process qRAD may be given as
Therefore, the total heat loss Q can be given by the equation
where hTE is the ‘cumulative’ heat transfer coefficient of the phone, including the effects of both convection and radiation.
The surface temperature change of the smartphone can be described as follows:
where i = ON or FLIGHT, or for OFF mode QOFF=0.
The solution of equation (4) in combination with smartphone surface thermographic measurements in FLIGHT mode and ON mode was used to find the power of smartphone QFLIGHT and QON, respectively. The solution of equation (4) is given by
where
An example of the average temperature increase, measured on the smartphone surface as a function of time for a phone operating in either FLIGHT or ON mode, is presented in Figure 2 (six experimental runs were performed). Measurements in different modes were taken to find the power Qi of the smartphone and hTE -‘cumulative’ heat transfer coefficient of phone, including the effects of both convection and radiation.
2.7. The ear as a heat source (QE)
The power of a smartphone can be estimated by substituting Qi in equation (4) with different heat sources (i.e., smartphones working in ON mode or in FLIGHT mode) and fitting the solution (5) of equation (4) to the experimental data.
The auricle region can also be regarded as a source of thermal energy QE. Blood perfusion generates the heat in this case, whereas heat loss takes place on the surface of the skin. Thermographic measurements provide only the average temperature increase of the auricle region ΔTE for time t at equilibrium (for 900 s). Mathematically, it can be calculated from the constant ai in equation (5). To calculate the power of ear QE, additional parameters are required, such as AE and hE – the heat transfer coefficient of the skin's surface. The heat transfer coefficient hE was assumed to be 4.7 W m−2·0 C−1 [19], while AE was estimated based on geometrical measurements (Table 1).
2.8. Final model
Finally, in the applied model (the provocation test using a smartphone), heat transfer may be described as a transfer of thermal energy between objects at different temperatures. Thermal energy always flows from a region of higher temperature to a region of lower temperature. In this case, heat is transmitted from the ear to the smartphone through the conduction process, which is confirmed by thermographic measurements.
The equation describing the temperature changes ΔTE at the auricle region may be given as:
The solution of equation (7) has the form of equation (5) and allows the temperature increase of the auricle region ΔTE to be calculated at equilibrium state (assumed to be 900 s and longer); in our case, this happened just after simulating a phone call. The temperature increases of the auricle region ΔTE between starting the phone call and achieving the equilibrium state (for 900 s) were measured experimentally with the thermal camera in the group of 40 participants.
The only unknown variable in equation (7) is the value of the overall conductive heat transfer coefficient between the ear and smartphone hETE. This was experimentally determined during a separate experiment. By studying the superficial temperature changes of the smartphone used and the temperature changes of the auricle region during a 15-minute phone call, the thermographic temperature difference of the auricle region TE and smartphone TTE was determined at several time points (Figure 3). As a result of the experiment, hETE was estimated to be 400 Wm−2·0C−1) ± 10%. The set of equations that reflects the process of heat propagation through direct contact between the auricle region and the smartphone (8) and the transfer of thermal energy via telephone, which is a consequence of the heating effect produced by the ear (9), is given by
The solution to the system of equations (8) and (9) is:
In order to facilitate the analysis, the following constants were used in equations (10) and (11):
Moreover, by substituting the value QE = 0.09 W (as indicated in Table 2) into equation (10), and then making the following substitutions
H=QE−8hETEAEhETEAE, F=AAE, G=QEhETEAE the subsequent form of the function was established and fitted to the experimental data:
where G, H, and F constants were calculated from the fitted function (12).
3.
Results
Examples of thermographic measurements for the auricle region before and after the provocation test in FLIGHT mode are presented in Figure 4. The auricle area was segmented manually for each subject.
Average temperature increases, minimal, maximal, and median measured values of the auricle region of exposed ear after a provocation test for the three smartphone operating modes are presented in Figure 5 as a box plot. The calculated value of ear power in comparison to the power of the phone in ON and FLIGHT mode is presented in Table 2. The comparison of average temperature increases ΔTExp calculated from thermographic measurements and estimated in accordance with the applied simplified model and supported thermographic measurements of smartphones ΔTE are given in Table 3. A graph showing the changes in temperature between the auricle region and the smartphone ΔTETE with fitting solution equation (12) is presented in Figure 3.
To find the statistical differences between operating mode and differences in temperature rise between the ears, the two sample Kolmogorov–Smirnov was used. This test compares the cumulative distributions of two data sets and is performed by computing the statistic parameter (KS statistic) which measures the maximum distance between the cumulative distributions functions of the two samples (CDF). The higher value of the KS statistic is the greatest distance between CDFs of each sample (Table 4).
Statistically significant differences (p = 0.02) were found between the mean temperature rise at the surface of the auricle region after the provocation test and for the contralateral ear when the phone was OFF (Table 4). Similarly, statistically significant differences were observed for FLIGHT (p = 0.003) and ON (p < 0.001) modes of the mobile phone (Table 4). The results of the temperature increase of the exposed auricle region after provocation tests were compared for different phone modes. A statistical comparison between them is presented in Table 4. No differences were noted for non-exposed ears for the same comparison. The effect size (Cohen's d) measuring the intensity of the relationship between mean temperature rise for different modes was also calculated (Table 4).
4.
Discussion
Thermal imaging is a well-known and scientifically approved method of temperature distribution measurements in medical science [27]. In this study, it was used to find the superficial temperature increase of a mobile phone in use as a function of time in two modes: FLIGHT and ON (Figure 2). Figure 2 illustrates that the temperature increases monotonically up to 0.9 °C and reaches a maximum value at 1000 s for FLIGHT, whereas in ON mode equilibrium (~1.8 °C) was obtained at 1800 s (saturation) [15] found that the increase in mean temperature after 15 min in ON mode was approximately 2 °C for mobile phones with an SAR of 0.39 W·kg−1 and 3.2 °C for mobile phones with an SAR of 1.26 W·kg−1 (weight of mobile phones used not given in the text). Lahiri et al. [16] reported average temperature increases ranging from 1.5 °C to 4 °C on three different commercially available models of mobile phones in ON mode with different SAR values: 0.83, 1.1, and 1.5 W·kg−1 (weight of mobile phones used not given in the text) (Table 5). The mean temperature rise in our study seems comparable, particularly as the SAR value of the mobile phone we used was 0.75 W·kg−1 and newer generation compared to mobile phones produced in 2005 or even in 2015 (Table 5).
Based on the model, the direction of heat transfer was calculated for the system under study from the ear to the phone. The results of temperature increases in the auricle region (Table 3) are in excellent agreement (in the range of uncertainty) with experimentally measured increases acquired from thermographic measurements (Table 3). Despite some assumptions made in the model, we can conclude that the temperature increase in the auricle region is mainly caused by disturbances in heat loss from the surface of the skin. There are two major factors affecting heat loss on the skin surface during a phone call: the smartphone being held against the ear and the heat generated by an active smartphone. The second factor significantly decreases the temperature gradient between the skin surface and the smartphone, simultaneously reducing heat loss. As a result of both factors, the temperature of the smartphone also rises, which is illustrated in Figure 3. The monotonically decreasing temperature difference between the ear and the smartphone is a result of both the temperature rise at the smartphone's surface and the temperature increase of the skin surface because of heat dissipation being blocked by the smartphone. To explain the observed effects, it is not necessary to consider the increase of the heat produced by the ear QE. Blocking the heat loss with only a deactivated smartphone being in direct contact with the ear causes a surprising temperature to increase of 1.1 ± 0.2 °C (Table 3). Unfortunately, this result cannot be compared with other studies due to the vast differences in test conditions. Only Bauer et al. [2] have investigated the influence of involuntary movements of volunteers on the increased temperature of the auricle region; they found that for a switched-off mobile phone, the temperature changes resulting from holding the mobile phone in contact with the ear for the duration of the call is ~ 0.12 °C. Kargel [15] observed only very subtle temperature increases (Table 5).
In FLIGHT mode, there is some electronic activity of smartphones – i.e. the battery, processor, and speaker – which significantly reduces the heat transfer between the ear and the smartphone, increasing the temperature of the auricle region by 1.4 ± 0.2 °C. However, the mean temperature in our study is far higher than what was reported by Bauer et al. [2] (0.55 °C for FLIGHT mode). It must be noted that Bauer et al. measured the temperature after a 5-minute phone call and used a telephone model with a lower SAR value (0.34 W kg−1). Any further average temperature increases in the auricle region, up to 1.9 ± 0.3 °C, were measured for active smartphones (ON mode) just after a standardized 15-minute conversation, which could suggest the influence of RF EMF. Bauer et al. (Bauer et al., 2018) found that the ear temperature could rise by 0.83 °C after a 5-minute-long phone call. Kargel [15] reported increases in mean temperatures in the ear/skull region of six subjects during standardized 35-min conversations by 1.2–2.3 °C, whereas Lahiri et al. [16] found temperature increases between 1.2 °C (SAR: 0.83 W·kg−1; battery capacity: 800 mAh) and 1.8 °C (SAR: 1.5 W·kg−1; battery capacity: 1320 mAh) after a 40-min phone call.
It is important to note that the temperature response, as observed in previous studies, is unique to individual use and that a high range of variability in temperature rise (Max - Min) can be observed in all operating modes of mobile phones (2.9–4.8 °C) (Figure 5). However, despite differences between the temperature increases at the surface of the auricle region (Table 3) caused by different modes of smartphones, not statistically significant differences between ON and FLIGHT modes (p = 0.20) were observed in the study groups, which may indicate that the contribution of RF EMF in the heat process is very small. On the other hand, the large variability in temperature rise among the tested subjects significantly affects the results of statistical tests (Figure 5). Lahiri et al. [16] reported that between 47.7% and 54.1% of the temperature rise on the skin's surface was due to the absorption of RF EMF energy alone; however, in other publications, this was reported as 40%–45%, while 55%–60% was due to pressure and friction between the mobile phone and the skin when the mobile phone was placed lightly against the skin surface [28]. In this study, the relative contribution of RF EMF to the temperature increase in the auricle region is around 26%. The relative contribution of RF EMF was found as the ratio between the temperature rise of the auricle region in FLIGHT mode to the temperature rise in ON mode and it was expressed as the percentage value.
Statistically significant differences in the ΔTExp of the auricle region were observed between OFF and ON modes (p = 0.03). It is important to emphasize that, in all phone modes, these significant differences (p < 0.05) between the average temperature increase of the contralateral side and the exposed auricle region were noted, which confirms the restricted mechanism of heat transfer from mobile phone use. Modeled increases in temperature are not a major problem for humans, especially regarding the skin surface – some other activities of daily life, such as sunbathing or bathing in warm water, cause even higher temperature increases, which experience shows are not very dangerous.
Our study has several limitations. One should note that to mimic real-life conditions, the smartphone was held against the auricular region with the hand of the participant throughout simulated phone calls. For this reason, despite proper participants' education prior to the experiment, the influence of rubbing or changing the position of the device during the experiment cannot be fully excluded. Second, due to software limitations, we were not able to consider identical ROIs in separate thermograms of the same participant. Nevertheless, as the pre-study analyses showed, the potential impact of such limitation on obtained results is negligible. Another limitation of our study is the inherent delay in capturing temperature data using a thermal imaging camera. Specifically, in order to record an image, the mobile phone had to be removed from the subject's ear, introducing a brief time delay between the removal and the moment the infrared image was taken. This delay may have allowed for a small amount of heat dissipation, potentially leading to a reduction in the measured skin temperature compared to the actual temperature during phone use. Although we took steps to minimize this effect by standardizing the procedure and ensuring that measurements were taken as quickly as possible, some degree of heat loss is unavoidable with this method. Future studies might benefit from exploring real-time thermal monitoring techniques to address this limitation.
In future studies, it would be valuable to include a comparison with non-heat-producing, heat-resistant materials, such as a metal object with similar dimensions and heat capacity to a mobile phone. This approach would allow for a more comprehensive understanding of how the physical properties of mobile phones, beyond their electromagnetic emissions, contribute to skin temperature increases. By controlling for the device's heat capacity, it would be possible to isolate the thermal impact caused solely by the restriction of heat dissipation from the skin, providing further clarity on the factors influencing temperature changes during phone use.
5.
Conclusions
It has been shown that, contrary to popular belief, the heat generated by the human ear propagates and runs in a temperature gradient from the ear to the mobile phone. The combined thermal effects observed and modeled on the surface of the auricle region manifested in a temperature increase, resulting from a combination of different factors stemming from the reduction of heat loss by the skin's surface, such as the phone directly restricting heat convection and radiation from the skin (OFF mode) – which was the dominant factor – the electrical activity of the phone (FLIGHT mode), and the impact of RF EMF (ON mode). Despite the not statistically significant differences in temperature increases on the auricle region between ON and FLIGHT modes (p = 0.20), it was determined that the influence of RF EMF on cumulative ear heating is manifested as a temperature rise of the auricle region in the system and that it represents only 26% of all distributed thermal energy. When measuring with thermal imaging, the cumulative thermal effects cannot be separated. The temperature increase of the auricle region is not an accurate parameter/method reflecting the absorption of RF EMF and merits further investigations.
AI tools declaration
The authors declare they have not used Artificial Intelligence (AI) tools in the creation of this article.
Declarations
This study was performed in line with the principles of the Declaration of Helsinki. Approval was granted by the Ethics Committee of Jagiellonian University (Date 23 January 2020./No.1072.6120.10.2020).