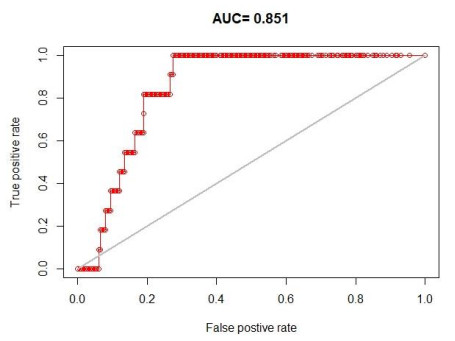
The impacts of climate change are projected to become more intense and frequent. One of the indirect impacts of climate change is food insecurity. Agriculture in Pakistan, measured fourth best in the world, is already experiencing visible adverse impacts of climate change. Among many other food sources, potato crop remains one of the food security crops for developing nations. Potatoes are widely cultivated in Pakistan. To assess the impact of climate change on potato crop in Pakistan, it is imperative to analyze its distribution under future climate change scenarios using Species Distribution Models (SDMs). Maximum Entropy Model is used in this study to predict the spatial distribution of Potato in 2070 using two CMIP5 models for two climate change scenarios (RCP 4.5 and RCP 8.5). 19 Bioclimatic variables are incorporated along with other contributing variables like soil type, elevation and irrigation. The results indicate slight decrease in the suitable area for potato growth in RCP 4.5 and drastic decrease in suitable area in RCP 8.5 for both models. The performance evaluation of the model is based on AUC. AUC value of 0.85 suggests the fitness of the model and thus, it is applicable to predict the suitable climate for potato production in Pakistan. Sustainable potato cultivation is needed to increase productivity in developing countries while promoting better resource management and optimization.
Citation: Tayyaba Khalil, Saeed A. Asad, Nusaiba Khubaib, Ayesha Baig, Salman Atif, Muhammad Umar, Jürgen P. Kropp, Prajal Pradhan, Sofia Baig. Climate change and potential distribution of potato (Solanum tuberosum) crop cultivation in Pakistan using Maxent[J]. AIMS Agriculture and Food, 2021, 6(2): 663-676. doi: 10.3934/agrfood.2021039
The impacts of climate change are projected to become more intense and frequent. One of the indirect impacts of climate change is food insecurity. Agriculture in Pakistan, measured fourth best in the world, is already experiencing visible adverse impacts of climate change. Among many other food sources, potato crop remains one of the food security crops for developing nations. Potatoes are widely cultivated in Pakistan. To assess the impact of climate change on potato crop in Pakistan, it is imperative to analyze its distribution under future climate change scenarios using Species Distribution Models (SDMs). Maximum Entropy Model is used in this study to predict the spatial distribution of Potato in 2070 using two CMIP5 models for two climate change scenarios (RCP 4.5 and RCP 8.5). 19 Bioclimatic variables are incorporated along with other contributing variables like soil type, elevation and irrigation. The results indicate slight decrease in the suitable area for potato growth in RCP 4.5 and drastic decrease in suitable area in RCP 8.5 for both models. The performance evaluation of the model is based on AUC. AUC value of 0.85 suggests the fitness of the model and thus, it is applicable to predict the suitable climate for potato production in Pakistan. Sustainable potato cultivation is needed to increase productivity in developing countries while promoting better resource management and optimization.

| [1] | IPCC (2019) Climate change and land: An IPCC special report on climate change, desertification, land degradation, sustainable land management, food security, and greenhouse gas fluxes in terrestrial ecosystems. Available from: https://www.ipcc.ch/srccl/download. |
| [2] |
Hertel TW, Burke MB, Lobell DB (2010) The poverty implications of climate-induced crop yield changes by 2030. Global Environ Change 20: 577-585. doi: 10.1016/j.gloenvcha.2010.07.001

|
| [3] |
Rosenzweig C, Parry ML (1994) Potential impact of climate change on world food supply. Nature 367: 133-138. doi: 10.1038/367133a0
|
| [4] | Mbow C, Rosenzweig C, Barioni LG, et al. (2019) Food security. In: Climate Change and Land: an IPCC special report on climate change, desertification, land degradation, sustainable land management, food security, and greenhouse gas fluxes in terrestrial ecosystems. |
| [5] | Stocker TF, Qin D, Plattner GK, et al. (2014) Technical Summary. In: Climate change 2013: The physical science basis. Contribution of working group I to the fifth assessment report of the intergovernmental panel on climate change. United Kingdom, New York: Cambridge University Press. |
| [6] |
van Meijl H, Havlik P, Lotze-Campen H, et al. (2018) Comparing impacts of climate change and mitigation on global agriculture by 2050. Environ Res Lett 13: 064021. doi: 10.1088/1748-9326/aabdc4
|
| [7] | Schmidhuber J (2015) "The Food Equation": Taking a long/term view on world agriculture, climate change and food security. Avaliable from: https://ojs.macsur.eu/index.php/Reports/article/view/SP4-15/76. |
| [8] | Chaudhri T (2017) The China-Pakistan Economic Corridor (CPEC). Ohio USA: The Ohio State University. Avaliable from: http://cpec.gov.pk. |
| [9] | Pradhan P, Fischer G, van Velthuizen H, et al. (2015) Closing yield gaps: How sustainable can we be? PLoS ONE 10: e0129487. |
| [10] |
Baig N, He C, Khan S, et al. (2019) CPEC and food security: Empirical evidence from Pakistan. J Public Adm Governance 9: 191-208. doi: 10.5296/jpag.v9i1.14309
|
| [11] | Von Grebmer K, Bernstein J, Patterson F, et al. (2019) 2019 global hunger index: The challenge of hunger and climate change. Dubli, Bonn: Welt hungerh ilfen. |
| [12] | World Food Programme (2017) Year in review 2018, WFP: The last resort, the first defence. Avaliable from: https://www.wfp.org/publications/wfp-year-review-2018. |
| [13] |
Guo YL, Li X, Zhao ZF, et al. (2017) Prediction of the potential geographic distribution of the ectomycorrhizal mushroom Tricholoma matsutake under multiple climate change scenarios. Sci Rep 7: 46221. doi: 10.1038/srep46221
|
| [14] |
Zaheer K, Akhtar MH (2016) Potato production, usage, and nutrition-A review. Crit Rev Food Sci Nutr 56: 711-721. doi: 10.1080/10408398.2012.724479
|
| [15] |
Devaux A, Kromann P, Ortiz O (2014) Potatoes for sustainable global food security. Potato Res 57: 185-199. doi: 10.1007/s11540-014-9265-1
|
| [16] |
Cotton PA, Subar AF, Friday JE, et al. (2004) Dietary sources of nutrients among US adults, 1994 to 1996. J Am Diet Assoc 104: 921-930. doi: 10.1016/j.jada.2004.03.019
|
| [17] |
Li Q, Zhang SQ (2020) Impacts of recent climate change on potato yields at a provincial scale in Northwest China. Agronomy 10: 426. doi: 10.3390/agronomy10030426
|
| [18] |
Hijmans RJ (2003) The effect of climate change on global potato production. Am J Pot Res 80: 271-279. doi: 10.1007/BF02855363
|
| [19] | Hussain T (2016) Potatoes: Ensuring food for the future. Adv Plants Agric Res 3: 00117. |
| [20] | Majeed A, Muhammad Z (2018) Potato production in Pakistan: Challenges and prospective management strategies-a review. Pakistan J Bot 50: 2077-2084. |
| [21] |
Byeon D, Jung S, Lee WH (2018) Review of CLIMEX and MaxEnt for studying species distribution in South Korea. J Asia-Pac Biodivers 11: 325-333. doi: 10.1016/j.japb.2018.06.002
|
| [22] |
Heumann BW, Walsh SJ, McDaniel PM (2011) Assessing the application of a geographic presence-only model for land suitability mapping. Ecol Inform 6: 257-269. doi: 10.1016/j.ecoinf.2011.04.004
|
| [23] | Reddy M, Sunil N, Pandravada S, et al. (2015) Assessing climate suitability for sustainable vegetable roselle (Hibiscus sabdariffa var. sabdariffa L.) cultivation in India using MaxEnt model. Agr Biol Sci J 1: 62-70. |
| [24] | Reddy MT, Begum H, Sunil N, et al. (2015) Mapping the climate suitability using MaxEnt modeling approach for Ceylon spinach (Basella alba L.) cultivation in India. J Agr Sci 10: 87-97. |
| [25] |
Singh M (2020) Evaluating the impact of future climate and forest cover change on the ability of Southeast (SE) Asia's protected areas to provide coverage to the habitats of threatened avian species. Ecol Indic 114: 106307. doi: 10.1016/j.ecolind.2020.106307
|
| [26] | Agricultural Statistics of Pakistan (2015) Government of Pakistan Statistics Division Pakistan Bureau of Statistics. Available from: https://www.pbs.gov.pk/content/agriculture-statistics. |
| [27] | R Core Team (2019) R: A language and environment for statistical computing. R Foundation for Statistical Computing, Vienna, Austria. Available from: https://www.R-project.org. |
| [28] |
Sanderson BM, Knutti R, Caldwell P (2015) Addressing interdependency in a multimodel ensemble by interpolation of model properties. J Climate 28: 5150-5170. doi: 10.1175/JCLI-D-14-00361.1
|
| [29] | Mani M, S. Bandyopadhyay, S. Chonabayashi, et al. (2019) South Asia's hotspots: Impact of temperature and precipitation changes on living standards. Washington, DC: World Bank. |
| [30] |
Phillips SJ, Dudik M (2008) Modeling of species distributions with Maxent: new extensions and a comprehensive evaluation. Ecography 31: 161-175. doi: 10.1111/j.0906-7590.2008.5203.x
|
| [31] | Hijmans RJ, Phillips S, Leathwick J, et al. (2015) Dismo: Species distribution modelin, Version 1.3-3. Avaliable from: http://CRAN.R-project.org/package=dismo. |
| [32] | Phillips SJ (2017) A brief tutorial on Maxent. Avaliable from: https://biodiversityinformatics.amnh.org/open_source/maxent. |
| [33] |
Elith J, Phillips SJ, Hastie T, et al. (2011) A statistical explanation of MaxEnt for ecologists. Divers Distrib 17: 43-57. doi: 10.1111/j.1472-4642.2010.00725.x
|
| [34] |
Tourne DCM, Ballester MVR, James PMA, et al. (2019) Strategies to optimize modeling habitat suitability of Bertholletia excelsa in the Pan-Amazonia. Ecol Evol 9: 12623-12638. doi: 10.1002/ece3.5726
|
| [35] |
Merow C, Smith MJ, Silander JA (2013) A practical guide to MaxEnt for modeling species' distributions: what it does, and why inputs and settings matter. Ecography 36: 1058-1069. doi: 10.1111/j.1600-0587.2013.07872.x
|
| [36] | Arain GN (2013) Maize (corn) cultivation in Pakistan. Available from: http://www.valleyirrigationpakistan.com/wp-content/uploads/2012/09/Maize-Cultivation-in-Pakistan1.pdf. |
| [37] |
Fielding AH, Bell JF (1997) A review of methods for the assessment of prediction errors in conservation presence/absence models. Environ Conserv 24: 38-49. doi: 10.1017/S0376892997000088
|
| [38] |
Phillips SJ, Anderson RP, Schapire RE (2006) Maximum entropy modeling of species geographic distributions. Ecol Model 190: 231-259. doi: 10.1016/j.ecolmodel.2005.03.026
|
| [39] | Peavey L (2010) Predicting pelagic habitat with presence-only data using maximum entropy for olive ridley sea turtles in the Eastern Tropical Pacific. Available from: https://dukespace.lib.duke.edu/dspace/bitstream/handle/10161/2247/Peavey_MP_4_30_10-1?sequence=1. |
| [40] | Yackulic CB, Chandler R, Zipkin EF, et al. (2013) Presence-only modelling using MAXENT: when can we trust the inferences? Methods Ecol Evol 4: 236-243. |
| [41] |
Kumar P (2012) Assessment of impact of climate change on Rhododendrons in Sikkim Himalayas using Maxent modelling: limitations and challenges. Biodivers Conserv 21: 1251-1266. doi: 10.1007/s10531-012-0279-1
|
| [42] |
Zhang KL, Yao LJ, Meng JS, et al. (2018) Maxent modeling for predicting the potential geographical distribution of two peony species under climate change. Sci Total Enviro 634: 1326-1334. doi: 10.1016/j.scitotenv.2018.04.112
|
| [43] | Abdelaal M, Fois M, Fenu G, et al. (2019) Using MaxEnt modeling to predict the potential distribution of the endemic plant Rosa arabica Crep. in Egypt. Ecol Inform 50: 68-75. |
| [44] | Wei B, Wang RL, Hou K, et al. (2018) Predicting the current and future cultivation regions of Carthamus tinctorius L. using MaxEnt model under climate change in China. Glob Ecol Conserv 16: e00447. |
| [45] |
Finnan JM, Donnelly A, Jones MB, et al. (2005) The effect of elevated levels of carbon dioxide on potato crops. J Crop Improv 13: 91-111. doi: 10.1300/J411v13n01_06
|
| [46] |
Kimball BA (2016) Crop responses to elevated CO2 and interactions with H2O, N, and temperature. Curr Opin Plant Biol 31: 36-43. doi: 10.1016/j.pbi.2016.03.006
|
| [47] |
Quiroz R, Ramirez DA, Kroschel J, et al. (2018) Impact of climate change on the potato crop and biodiversity in its center of origin. Open Agric 3: 273-283. doi: 10.1515/opag-2018-0029
|
| [48] |
Raymundo R, Asseng S, Robertson R, et al. (2018) Climate change impact on global potato production. Eur J Agron 100: 87-98. doi: 10.1016/j.eja.2017.11.008
|
Figures(5) / Tables(1)

Tayyaba Khalil, Saeed A. Asad, Nusaiba Khubaib, Ayesha Baig, Salman Atif, Muhammad Umar, Jürgen P. Kropp, Prajal Pradhan, Sofia Baig. Climate change and potential distribution of potato (Solanum tuberosum) crop cultivation in Pakistan using Maxent[J]. AIMS Agriculture and Food, 2021, 6(2): 663-676. doi: 10.3934/agrfood.2021039


 DownLoad: