We aimed to evaluate the financial literacy of working adults in Saudi Arabia and to examine its correlation with various demographic factors. Data from 1,127 employed individuals were collected through an online survey. Descriptive analysis was used to compare the levels of financial literacy, while chi-square tests and regression analysis were employed to determine the impact of demographic factors. The results indicated that working adults in Saudi Arabia have satisfactory financial knowledge, particularly concerning gender, age, education, and the field of study. These demographic factors had a significant relationship with financial literacy. However, weaker connections were observed between financial literacy, living conditions, marital status, and job sector. This study highlights the importance of collaborative efforts to promote financial education among Saudi Arabian professionals. These findings offer valuable insights for policymakers and stakeholders by improving financial literacy among working adults.
Citation: Mansour Saleh Albarrak, Sara Ali Alokley, Yasmeen Ansari. Financial literacy among working adults: The case of Saudi Arabia[J]. Quantitative Finance and Economics, 2024, 8(4): 841-866. doi: 10.3934/QFE.2024032
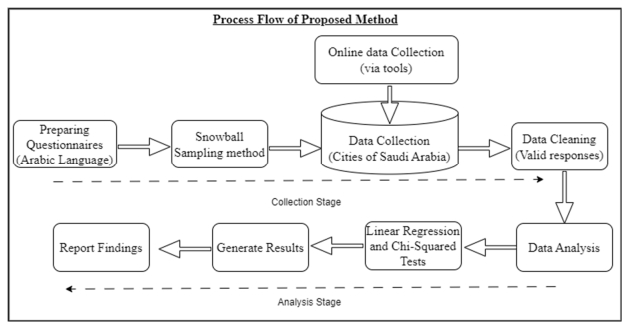
We aimed to evaluate the financial literacy of working adults in Saudi Arabia and to examine its correlation with various demographic factors. Data from 1,127 employed individuals were collected through an online survey. Descriptive analysis was used to compare the levels of financial literacy, while chi-square tests and regression analysis were employed to determine the impact of demographic factors. The results indicated that working adults in Saudi Arabia have satisfactory financial knowledge, particularly concerning gender, age, education, and the field of study. These demographic factors had a significant relationship with financial literacy. However, weaker connections were observed between financial literacy, living conditions, marital status, and job sector. This study highlights the importance of collaborative efforts to promote financial education among Saudi Arabian professionals. These findings offer valuable insights for policymakers and stakeholders by improving financial literacy among working adults.

| [1] |
Ali I, Ali M, Badghish S (2019) Symmetric and asymmetric modeling of entrepreneurial ecosystem in developing entrepreneurial intentions among female university students in Saudi Arabia. Int J Gend Entrep 11: 435–458. https://doi.org/10.1108/IJGE-02-2019-0039 doi: 10.1108/IJGE-02-2019-0039

|
| [2] |
Ansari Y, Albarrak MS, Sherfudeen N, et al. (2023) Examining the relationship between financial literacy and demographic factors and the overconfidence of Saudi investors. Financ Res Lette 52: 103582. https://doi.org/10.1016/j.frl.2022.103582 doi: 10.1016/j.frl.2022.103582
|
| [3] |
Bakk Z, Kuha J (2018) Two-step estimation of models between latent classes and external variables. Psychometrika 83: 871–892. https://doi.org/10.1007/s11336-017-9592-7 doi: 10.1007/s11336-017-9592-7
|
| [4] |
Benjamin DJ, Laibson D, Mischel W, et al. (2020) Predicting mid-life capital formation with pre-school delay of gratification and life-course measures of self-regulation. JEcon Behav Organ 179: 743–756. https://doi.org/10.1016/j.jebo.2019.08.016 doi: 10.1016/j.jebo.2019.08.016
|
| [5] |
Biener C, Eling M, Schmit JT (2014) Regulation in microinsurance markets: principles, practice, and directions for future development. World Dev 58: 21–40. https://doi.org/10.1016/j.worlddev.2013.12.012 doi: 10.1016/j.worlddev.2013.12.012
|
| [6] |
Breitbach E, Walstad WB (2016) Financial literacy and financial behavior among young adults in the United States, Economic competence and financial literacy of young adults—status and challenges.Verlag Barbara Budrich, Opladen, 81–100. https://doi.org/10.2307/j.ctvbkk29d.7 doi: 10.2307/j.ctvbkk29d.7
|
| [7] |
Burcher SA, Serido J, Danes S, et al. (2021) Using the expectancy–value theory to understand emerging adult's financial behavior and financial well–being. Emerg Adulthood 9: 66–75. https://doi.org/10.1177/2167696818815387 doi: 10.1177/2167696818815387
|
| [8] |
Coulter R (2017) Local house prices, parental background and young adults' homeownership in England and Wales. Urban Studies 54: 3360–3379. https://doi.org/10.1177/0042098016668121 doi: 10.1177/0042098016668121
|
| [9] |
De Bassa Scheresberg C (2013) Financial literacy and financial behavior among young adults: Evidence and implications. Numeracy 6: 5. https://doi.org/10.5038/1936-4660.6.2.5 doi: 10.5038/1936-4660.6.2.5
|
| [10] |
Fan L, Babiarz P (2019) The determinants of subjective financial satisfaction and the moderating roles of gender and marital status. Fam Consum Sci Res J 47: 237–259. https://doi.org/10.1111/fcsr.12297 doi: 10.1111/fcsr.12297
|
| [11] | Grødem AS, Kitterød H (2021) Combining Work and Pension in Norway: Gathering Information and Imagining the Future. |
| [12] |
Herbert A (2023) Why older rural women in Ireland want to work: it's not all about the money. Ageing Soc 43: 1810–1832. https://doi.org/10.1017/S0144686X21001501 doi: 10.1017/S0144686X21001501
|
| [13] |
James BD, Boyle PA, Bennett JS, et al. (2012) The impact of health and financial literacy on decision making in community–based older adults. Gerontology 58: 531–539. https://doi.org/10.1159/000339094 doi: 10.1159/000339094
|
| [14] |
James H, Price D, Buffel T (2020) How do people think about later life when making workplace pension saving decisions? J Aging Stud 54: 100869. https://doi.org/10.1016/j.jaging.2020.100869 doi: 10.1016/j.jaging.2020.100869
|
| [15] |
Karagiannaki E (2017) The Impact of Inheritance on the Distribution of Wealth: Evidence from G reat B ritain. Rev Income Wealth 63: 394–408. https://doi.org/10.1111/roiw.12217 doi: 10.1111/roiw.12217
|
| [16] | Kiril K (2020) OECD/INFE 2020 international survey of adult financial literacy. |
| [17] |
Klapper L, Lusardi A (2020) Financial literacy and financial resilience: Evidence from around the world. Financ Manage 49: 589–614. https://doi.org/10.1111/fima.12283 doi: 10.1111/fima.12283
|
| [18] | Lin T, Fu X, Chen F, et al. (2021) A novel approach for code smells detection based on deep leaning, Applied Cryptography in Computer and Communications: First EAI International Conference, AC3 2021, Virtual Event, May 15–16 2021, Proceedings 1 2021, Springer, 171–174. https://doi.org/10.1007/978-3-030-80851-8_12 |
| [19] |
Lusardi A (2012) Financial literacy and financial decision–making in older adults. Generations 36: 25–32. https://doi.org/10.3386/w17821 doi: 10.3386/w17821
|
| [20] |
Madeira C, Margaretic P (2022) The impact of financial literacy on the quality of self-reported financial information. J Behav Exp Financ 34: 100660. https://doi.org/10.1016/j.jbef.2022.100660 doi: 10.1016/j.jbef.2022.100660
|
| [21] | Mitchell OS, Lusardi A (2022) Financial literacy and financial behavior at older ages. Wharton Pension Research Council Working Paper (2022–01). https://doi.org/10.2139/ssrn.4006687 |
| [22] |
Noone J, O'Loughlin K, Kendig H (2012) Socioeconomic, psychological and demographic determinants of Australian baby boomers' financial planning for retirement. Australas J Ageing 31: 194–197. https://doi.org/10.1111/j.1741-6612.2012.00600.x doi: 10.1111/j.1741-6612.2012.00600.x
|
| [23] |
Payne SH, Yorgason JB, Dew JP (2014) Spending today or saving for tomorrow: The influence of family financial socialization on financial preparation for retirement. J Fam Econ Issues 35: 106–118. https://doi.org/10.1007/s10834-013-9363-2 doi: 10.1007/s10834-013-9363-2
|
| [24] |
Robertson–Rose L (2019) Good job, good pension? The influence of the workplace on saving for retirement. Ageing Soc 39: 2483–2501. https://doi.org/10.1017/S0144686X18000600 doi: 10.1017/S0144686X18000600
|
| [25] |
Salignac F, Marjolin A, Reeve R, et al. (2019) Conceptualizing and measuring financial resilience: A multidimensional framework. Soc Indic Res 145: 17–38. https://doi.org/10.1007/s11205-019-02100-4 doi: 10.1007/s11205-019-02100-4
|
| [26] |
Seraj AHA, Fazal SA, Alshebami AS (2022) Entrepreneurial competency, financial literacy, and sustainable performance—examining the mediating role of entrepreneurial resilience among Saudi entrepreneurs. Sustainability 14: 10689. https://doi.org/10.3390/su141710689 doi: 10.3390/su141710689
|
| [27] |
Siegfried C, Wuttke E (2021) What influences the financial literacy of young adults? A combined analysis of socio–demographic characteristics and delay of gratification. Frontiers Psychol 12: 663254. https://doi.org/10.3389/fpsyg.2021.663254 doi: 10.3389/fpsyg.2021.663254
|
| [28] |
Suh E (2022) Can't save or won't save: financial resilience and discretionary retirement saving among British adults in their thirties and forties. Ageing Soc 42: 2940–2967. https://doi.org/10.1017/S0144686X21000337 doi: 10.1017/S0144686X21000337
|
| [29] |
Suh E (2020) Young British adults' homeownership circumstances and the role of intergenerational transfers. Longitudinal Life Course 11: 383–407. https://doi.org/10.1332/175795920X15846933259695 doi: 10.1332/175795920X15846933259695
|
| [30] |
Tavor T, Garyn–Tal S (2016) Risk tolerance and rationality in the case of retirement savings. Stud Econ Financ 33: 688–703. https://doi.org/10.1108/SEF-10-2015-0240 doi: 10.1108/SEF-10-2015-0240
|
| [31] |
Van Dalen HP, Henkens K (2020) The COVID–19 pandemic: Lessons for financially fragile and aging societies. Work Aging Retire 6: 229–232. https://doi.org/10.1093/workar/waaa011 doi: 10.1093/workar/waaa011
|
| [32] |
Van Rooij M, Lusardi A, Alessie R (2011) Financial literacy and stock market participation. J Financ Econ 101: 449–472. https://doi.org/10.1016/j.jfineco.2011.03.006 doi: 10.1016/j.jfineco.2011.03.006
|
| [33] |
Ventura L, Horioka CY (2020) The wealth decumulation behavior of the retired elderly in Italy: the importance of bequest motives and precautionary saving. Rev Econ Household 18: 575–597. https://doi.org/10.1007/s11150-020-09486-y doi: 10.1007/s11150-020-09486-y
|
| [34] |
Walker A (2018) Why the UK needs a social policy on ageing. J Soc Policy 47: 253–273. https://doi.org/10.1017/S0047279417000320 doi: 10.1017/S0047279417000320
|
| [35] |
Watts TW, Duncan GJ, Quan H (2018) Revisiting the marshmallow test: A conceptual replication investigating links between early delay of gratification and later outcomes. Psychol Sci 29: 1159–1177. https://doi.org/10.1177/0956797618761661 doi: 10.1177/0956797618761661
|
| [36] | Zazili ASA, Ghazali MFB, Bakar NTBA, et al. (2017) Retirement planning: Young professionals in private sector SHS Web of Conferences 2017, EDP Sciences, 00024. https://doi.org/10.1051/shsconf/20173600024 |


Figures(5) / Tables(17)

Mansour Saleh Albarrak, Sara Ali Alokley, Yasmeen Ansari. Financial literacy among working adults: The case of Saudi Arabia[J]. Quantitative Finance and Economics, 2024, 8(4): 841-866. doi: 10.3934/QFE.2024032


 DownLoad: